Institutions Buy $3B While 127K Retail Traders Get Liquidated — Market Polarization at Fear Index 8
Fear index at 8 for 46 days, yet institutions bought $3B. 127K retail liquidations reveal historic market polarization.
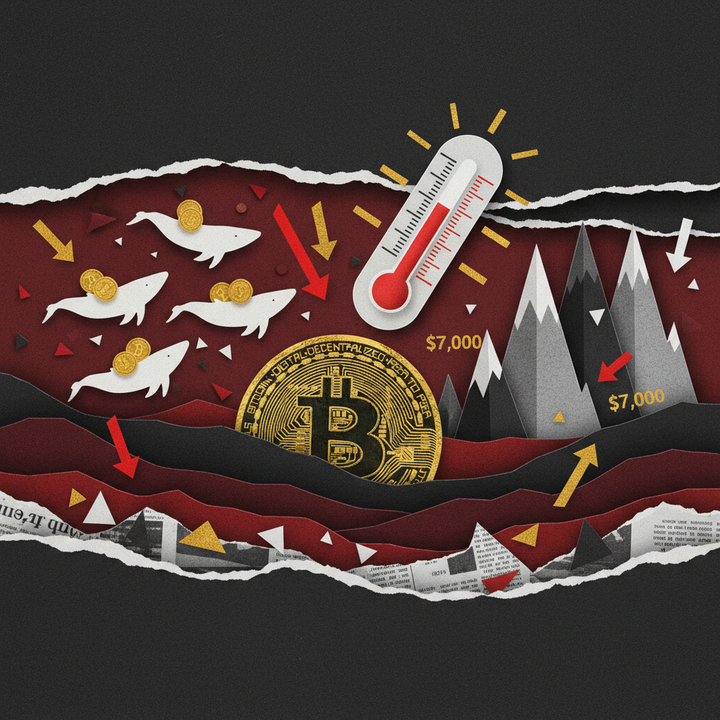
The crypto market stands at one of its most polarizing moments in recent memory. While the Fear & Greed Index has spent 46 consecutive days at extreme lows, institutions have deployed over $3 billion into digital assets — even as 127,198 retail traders were liquidated in a single 24-hour window. Here is the complete data breakdown of a market splitting in two.
March Week 4 Market Data — BTC at $68,500 and Fear Index at 8: What's Really Happening?
Quick Answer: The Crypto Fear & Greed Index has held at 8/100 for 46 consecutive days — the second-longest extreme fear streak since 2022. Institutions deployed over $3 billion into BTC and ETH during this period, while 127,198 retail traders suffered $445 million in 24-hour liquidations with 77% on the long side.
The Crypto Fear & Greed Index is a composite sentiment indicator measuring market emotion on a 0–100 scale, where readings below 25 represent extreme fear. As of March 23, 2026, the index registers 8 out of 100 — unchanged for 46 consecutive days and marking the second-longest extreme fear streak on record, surpassed only by the 73-day run during the 2022 bear market, according to Spoted Crypto research. Bitcoin is consolidating near $68,500, with the total crypto market capitalization at $2.51 trillion and BTC dominance at 56.6%. Despite this sentiment collapse, 24-hour trading volume on Binance exceeded $1.7 billion for BTC alone. Negative funding rates across major perpetual contracts — BTC at -0.0029% and DOGE at -0.0045% — confirm that bearish positioning dominates derivatives markets, creating conditions historically associated with short squeeze reversals.
Volume Leaders and Intraday Price Action
Bitcoin surged from an intraday low of $67,361 to a high of $71,499 on March 23 — a $4,138 range representing 6.1% intraday volatility. Ethereum mirrored the move, climbing from $2,023 to $2,199 for an 8.7% swing. The table below captures Binance's top-volume assets at the latest snapshot:
| Asset | Price (USD) | 24h Change | 24h Volume | Intraday Range |
|---|---|---|---|---|
| BTC | $71,080 | +3.56% | $1.71B | $67,361 – $71,499 |
| ETH | $2,159 | +3.88% | $1.03B | $2,023 – $2,199 |
| PAXG | $4,444 | -0.82% | — | — |
| NIGHT | $0.05 | +14.21% | — | — |
| USDC | $1.00 | +0.01% | — | — |
Notably, tokenized gold (PAXG) at $4,444 was one of the few top-volume assets trading red, as risk appetite tentatively returned to crypto majors. The funding rate picture reinforces the bearish positioning story: when BTC perpetual funding sits at -0.0029% and SOL at -0.0019% on Binance, short sellers are paying longs to maintain positions — a marker of overwhelming bearish conviction. XRP stands as a notable outlier with +0.0057% positive funding, suggesting isolated bullish positioning. Historically, extreme negative funding during single-digit fear readings has preceded violent short squeezes, as overleveraged shorts become fuel for upward price discovery.
24-Hour Liquidation Cascade: 127,198 Traders Wiped Out
The human cost of this volatility is staggering. According to TheCCPress, 127,198 traders were liquidated within a single 24-hour window, totaling $444.78 million in forced closures. The skew is telling — 77% were long positions, indicating retail traders attempted to buy the dip prematurely and were flushed out by continued downside pressure before the bounce.
| Liquidation Metric | Value |
|---|---|
| Total Liquidated | $444.78M |
| Traders Affected | 127,198 |
| Long Liquidations | $341.96M (77%) |
| Short Liquidations | $102.82M (23%) |
| Largest Single Liquidation | $10.81M (BTC-USD, Hyperliquid) |
Historical Precedent: What Fear Index 8 Meant in 2020 and 2022
The last time the Fear & Greed Index hit 8 was during the March 2020 COVID crash, when Bitcoin traded at $3,800. Within 13 months, BTC rallied over 1,400%. The June 2022 Terra/Luna collapse pushed the index even lower to 6 — and despite an additional 40% drawdown before the ultimate bottom, Bitcoin posted a 158% recovery within the following year. Current structural conditions arguably favor bulls more than either prior episode: exchange reserves have dropped to 2.21 million BTC — the lowest level since December 2017 — while wallets holding 100+ BTC have reached a record 20,031, according to BeInCrypto. Large whales holding 1,000+ BTC accumulated 91,000 BTC worth approximately $6.5 billion over the past 90 days. The pattern is unmistakable: retail sells into fear while institutions and whales accumulate through it.
The Weekend Institutional Buying Storm — Why Strategy, Bitmine, and H100 Bet $3 Billion in a Panic Market
Institutional conviction is measured not by what companies say during bull markets, but by what they buy during bear markets. Between March 9 and March 23, 2026, three corporate buyers — Strategy (formerly MicroStrategy), Bitmine, and Sweden's H100 Group — collectively committed over $1.9 billion to direct cryptocurrency purchases, while Bitcoin spot ETFs added another $1.167 billion in net inflows over seven consecutive trading days (March 9–17), per The Market Periodical. Combined, that represents roughly $3 billion in institutional capital entering crypto within two weeks — at a time when the Fear & Greed Index has not risen above 10 for over six weeks. This divergence between retail capitulation and institutional accumulation at scale has not been this pronounced since the 2022 bear market bottom. Understanding who is buying, how much, and why provides the clearest signal of where the smart money sees value.
Strategy: $1.6 Billion in a Single Week
Strategy, the enterprise software company turned Bitcoin treasury vehicle led by executive chairman Michael Saylor, purchased 22,337 BTC between March 9 and March 15 at a cost of approximately $1.6 billion, according to DimSumDaily. The acquisition brings Strategy's total holdings to 761,068 BTC at an average cost basis of $66,384 per coin — meaning the firm now sits near breakeven with BTC trading between $68,500 and $71,000. Strategy's position represents approximately 3.6% of Bitcoin's total circulating supply, cementing its status as the largest corporate holder of Bitcoin globally. The sheer cadence of this purchase — over $200 million per day for seven consecutive days — sends an unmistakable signal about Saylor's conviction that the current price level represents generational accumulation territory, not a prelude to further collapse.
Bitmine's $138 Million Ethereum Conviction Play
Tom Lee's Bitmine (BMNR) extended its buying streak on March 23 with a $138 million purchase of 65,341 ETH, pushing total holdings to 4.66 million ETH — a staggering 3.86% of Ethereum's circulating supply, according to CoinDesk. What makes this purchase remarkable is the context: Bitmine is sitting on approximately $7 billion in unrealized losses on its existing Ethereum position, yet continues to accumulate aggressively. Chairman Thomas Lee addressed the strategy directly:
"Our base case is ETH is in the final stages of the 'mini-crypto winter.'" — Thomas Lee, Chairman, Bitmine (BMNR), via CoinDesk
This statement frames the current downturn as a cyclical end-stage rather than the beginning of deeper losses — a thesis backed by Bitmine's willingness to average down through $7 billion in paper losses. If Lee's conviction proves correct, the firm's accumulated 4.66 million ETH position at deeply discounted prices could generate outsized returns on the next cycle upswing.
H100 Group: Europe's Largest Bitcoin Treasury in the Making
Sweden-based H100 Group has signed letters of intent to acquire Moonshot AS and Never Say Die AS — two deals that would expand its Bitcoin holdings from 1,051 to approximately 3,501 BTC, positioning it as the largest corporate Bitcoin treasury in Europe, according to CoinDesk. While the absolute size is modest compared to Strategy's war chest, the strategic significance is substantial: H100's move signals that the corporate Bitcoin treasury model, pioneered in the United States, is now expanding into European markets — even during periods of maximum pessimism. The company's willingness to pursue acquisition-driven BTC accumulation at Fear Index 8 mirrors the same conviction gap that separates institutional behavior from retail sentiment.
| Entity | Asset | Recent Purchase | Total Holdings | Key Detail |
|---|---|---|---|---|
| Strategy | BTC | 22,337 BTC ($1.6B) | 761,068 BTC | Avg cost basis $66,384 |
| Bitmine (BMNR) | ETH | 65,341 ETH ($138M) | 4.66M ETH | 3.86% of circulating supply |
| H100 Group | BTC | ~2,450 BTC (LOI) | 3,501 BTC (target) | Largest European BTC treasury |
| BTC Spot ETFs | BTC | $1.167B (7-day net inflow) | $65B+ cumulative | BlackRock IBIT led with $601M |
The Common Thread: Why Institutions Buy When Retail Runs
The logic connecting these purchases is straightforward: institutions with multi-year time horizons view extreme fear as a pricing inefficiency, not a warning signal. As Bitwise CIO Matt Hougan noted in a March 16 analysis via CoinDesk, despite a 50% price decline from all-time highs, Bitcoin ETFs experienced less than $10 billion in outflows against approximately $60 billion in cumulative inflows — a retention rate exceeding 83%. This "diamond hands" behavior among institutional ETF holders contrasts sharply with the 127,198 leveraged retail traders liquidated in a single day. The structural picture reinforces the thesis: whale accumulation data shows wallets holding 1,000+ BTC added 91,000 coins worth roughly $6.5 billion over the past 90 days, while exchange reserves have fallen to seven-year lows. Q1 2026 alone has seen $18.7 billion in cumulative Bitcoin ETF net inflows, per Blocklr, pushing lifetime totals past $65 billion. When retail sells into panic and institutions accumulate at scale, history suggests the market is far closer to a bottom than a top.
127,000 Traders Liquidated, $445M Wiped — What Just Happened to Retail Investors?
Crypto liquidations occur when leveraged positions are forcibly closed after a trader's margin balance falls below the maintenance threshold, typically triggered by sharp, sudden price movements. On March 19, 2026, exactly 127,198 traders were liquidated across major exchanges within a single 24-hour window, erasing a combined $444.78 million in positions according to TheCCPress. Long positions bore the overwhelming brunt at $341.96 million — a staggering 77% of total liquidations — while short positions totaled just $102.82 million (23%). The largest single wipeout was a $10.81 million BTC-USD position on Hyperliquid. This extreme long-side concentration reveals that retail traders were aggressively betting on a recovery even as the Fear & Greed Index sat at 8 out of 100, deep in extreme-fear territory. The result was a mass forced exit that underscores the devastating consequences of overleveraged optimism in a structurally bearish environment.
Liquidation Breakdown: Longs Crushed at a 3-to-1 Ratio
The following table details the March 19 liquidation event, highlighting the extreme imbalance between long and short positions alongside current derivatives market sentiment.
| Metric | Value | Context |
|---|---|---|
| Total Traders Liquidated | 127,198 | 24-hour period (March 19) |
| Total Liquidation Volume | $444.78M | Across all major exchanges |
| Long Liquidations | $341.96M | 77% of total |
| Short Liquidations | $102.82M | 23% of total |
| Largest Single Liquidation | $10.81M | BTC-USD on Hyperliquid |
| BTC Funding Rate (Binance) | -0.0029% | Short-biased post-liquidation |
Why Retail Kept Going Long at Fear Index 8
The 77% long dominance in liquidations reveals a psychological trap that consistently ensnares retail traders during extreme downturns. When the Fear & Greed Index drops to single digits, contrarian instincts activate — retail participants interpret extreme fear as a buy signal, deploying leveraged long positions in anticipation of an imminent bounce. But extreme fear at 8 is not a floor; the current reading has persisted for 46 consecutive days, the longest streak since the 2022 bear market, according to Spoted Crypto's extreme fear analysis. Each failed recovery attempt triggers cascading liquidations as stop-losses and margin calls compound downward selling pressure, creating a self-reinforcing liquidation spiral. Current Binance perpetual funding rates for BTC at -0.0029% confirm the aftermath: the market has flipped decisively net-short, meaning overleveraged longs have been systematically purged and replaced by bearish positioning. This behavioral pattern closely mirrors the 2022 Terra/Luna collapse period, when the index hit 6 and mass retail long liquidations preceded an additional 40% decline before any sustainable recovery materialized, as documented by Yahoo Finance.
Institutional Accumulation vs. Retail Leverage — Two Divergent Strategies
The contrast between institutional and retail behavior during this drawdown could not be more stark. While 127,198 retail traders were being liquidated on overleveraged positions, institutional players executed the exact opposite playbook — accumulating spot assets with zero liquidation risk. Strategy (formerly MicroStrategy) purchased 22,337 BTC worth $1.6 billion in a single week between March 9 and 15, expanding its total holdings to 761,068 BTC at an average cost basis of $66,384, according to DimSumDaily. Sweden's H100 Group announced acquisitions targeting Europe's largest Bitcoin treasury at 3,501 BTC, per CoinDesk. Bitmine deployed $138 million to acquire 65,341 ETH in a single transaction. The critical difference lies in risk architecture: institutions buy spot with no margin exposure, while retail traders predominantly rely on leveraged derivatives that carry existential liquidation risk. With whale wallets holding over 1,000 BTC reaching 2,140 addresses and absorbing 91,000 BTC ($6.5 billion) over 90 days, every retail liquidation cascade effectively transfers wealth from overleveraged speculators to patient institutional accumulators operating on fundamentally longer time horizons.
BTC ETF 'Diamond Hands' — $18.7B in Q1 Inflows and Why 94% of Holdings Remain Untouched
Bitcoin exchange-traded funds have emerged as the most transparent barometer of institutional conviction during the 2026 bear market. In Q1 2026 alone, spot BTC ETFs attracted $18.7 billion in cumulative net inflows, pushing total inflows since their January 2024 launch beyond the $65 billion milestone, according to Blocklr. This occurred despite Bitcoin declining over 50% from its all-time high, with the Fear & Greed Index lingering at extreme-fear levels for 46 consecutive days. Between March 9 and 17, ETFs logged seven consecutive days of inflows totaling $1.167 billion before the streak was broken by a $129.62 million outflow on March 18, as reported by The Market Periodical. BlackRock's IBIT dominated the weekly flow dynamics with $601 million in net inflows, per CoinPaprika. These patterns suggest that institutional allocators are treating the drawdown as a strategic accumulation window rather than an exit signal.
Q1 2026 ETF Flow Dashboard
The following table summarizes the key flow metrics that define Q1 2026 as a landmark quarter for Bitcoin ETF adoption despite extreme market fear.
| Metric | Value | Source |
|---|---|---|
| Q1 2026 Net Inflows | $18.7B | Blocklr |
| Cumulative Inflows Since Launch | $65B+ | Blocklr |
| 7-Day Inflow Streak (Mar 9–17) | $1.167B | The Market Periodical |
| Streak-Ending Outflow (Mar 18) | -$129.62M | The Market Periodical |
| BlackRock IBIT Weekly Inflow | $601M | CoinPaprika |
| ETF BTC Holdings Retained | 94% | BeInCrypto |
| Total Outflows During 50% Decline | <$10B | Bitwise |
Institutional 'Diamond Hands' — What the Outflow Data Really Shows
The term "diamond hands" — internet slang for investors who refuse to sell regardless of volatility — may have originated in retail meme culture, but Q1 2026 data shows it now applies most accurately to institutional ETF holders. Matt Hougan, Chief Investment Officer at Bitwise, quantified this conviction in stark terms: "Despite a punishing bear market, professional investors have proven to be 'diamond hands' in bitcoin. ETFs accumulated approximately $60 billion in net inflows from January 2024 through October 2025. Since October 2025, despite a 50% price decline, ETFs experienced less than $10 billion in outflows," he told CoinDesk. The arithmetic is compelling: roughly 83% of all capital that entered through ETFs during the bull run remained invested through a brutal 50% drawdown — an unprecedented retention rate for any volatile asset class. This behavior fundamentally diverges from previous crypto cycles, where capital flight during major downturns typically exceeded 40–50% of peak assets under management within months of the initial decline.
Retail Panic vs. Institutional Conviction Inside the ETF Wrapper
Nima Beni, founder of Bitlease, offered a complementary framework for understanding the divergence between retail and institutional behavior within ETF structures: "ETF outflows are retail panic, creating institutional opportunity. BlackRock's $2.13 billion IBIT outflow matters less than the fact that 94% of ETF Bitcoin holdings remained despite maximum fear. That's institutional conviction, not abandonment," he told BeInCrypto. This distinction is critical for interpreting flow data. While headline outflow numbers can appear alarming in isolation, they represent a small fraction of total ETF assets under management. The 94% retention rate during a period when the Fear & Greed Index touched 8 — a level last matched during the March 2020 COVID crash — suggests the institutional thesis for Bitcoin as a portfolio diversifier has survived its most severe stress test to date. For historical context, the 2020 crash saw Bitcoin fall to $3,800 before rallying over 1,400% in the subsequent 13 months, according to Spoted Crypto's historical analysis.
Structural Price Impact of Sustained ETF Accumulation
The structural implications of persistent ETF inflows extend well beyond sentiment analysis into the fundamental mechanics of supply and demand. Every dollar flowing into spot BTC ETFs translates into direct Bitcoin purchases by authorized participants, physically removing supply from the liquid market. With exchange reserves at just 2.21 million BTC — only 5.88% of circulating supply and the lowest level since December 2017 — the combined effect of ETF accumulation and independent whale buying is creating a historically significant supply squeeze. Whale wallets holding over 100 BTC have reached a record 20,031 addresses, per BeInCrypto, while the 1,000+ BTC cohort has absorbed 91,000 BTC worth approximately $6.5 billion over the past 90 days. If Q1's $18.7 billion ETF inflow pace continues into Q2, the supply math becomes increasingly difficult for bears to overcome: declining exchange reserves combined with sustained institutional demand creates the preconditions for a supply-driven price recovery once sentiment shifts. The last time exchange reserves hit comparable levels in late 2017, Bitcoin embarked on its historic run toward its then all-time high — a structural parallel made even more compelling by today's ETF-driven institutional accumulation infrastructure that simply did not exist in previous cycles.
Exchange Reserves Hit 7-Year Low While Whale Wallets Reach All-Time High — How Far Can Supply Compression Go?
Bitcoin's exchange reserve supply squeeze is reaching historic proportions, and on-chain data reveals a widening divergence between retail-accessible liquidity and institutional accumulation. Exchange-held BTC has fallen to just 2.21 million coins — representing only 5.88% of total circulating supply — the lowest level recorded since December 2017, according to SpotedCrypto on-chain tracking data. Simultaneously, wallets holding 100 or more BTC have surged to a record 20,031 addresses, an all-time high documented by BeInCrypto. Large whales controlling 1,000+ BTC have accumulated approximately 91,000 BTC — worth an estimated $6.5 billion — over just the past 90 days, while the exchange-to-whale ratio has climbed to 0.64, its highest reading since 2015. This structural supply compression, driven by ETF custody flows, self-custody migration, and expanding corporate treasury allocations, mirrors the very conditions that preceded Bitcoin's most explosive price rallies throughout market history.
On-Chain Supply Snapshot
| Metric | Current Value | Historical Context |
|---|---|---|
| Exchange Reserves | 2.21M BTC (5.88% of supply) | Lowest since December 2017 |
| 100+ BTC Wallets | 20,031 addresses | All-time high |
| 1,000+ BTC Wallets | 2,140 addresses | 91,000 BTC added in 90 days |
| Exchange Whale Ratio | 0.64 | Highest since 2015 |
| 90-Day Whale Accumulation | ~$6.5 billion | Accelerating trend |
Three Structural Forces Driving the Supply Exodus
The accelerating drain of Bitcoin from exchange wallets is not random — it reflects three structural forces reshaping crypto custody at a fundamental level. First, spot Bitcoin ETFs have become the dominant accumulation vehicle, with BlackRock's IBIT alone attracting $601 million in weekly inflows even as BTC traded below $71,000. Q1 2026 ETF net inflows have reached a cumulative $18.7 billion, according to Blocklr, pulling coins into institutional cold storage vaults that rarely re-enter exchange order books.
Second, self-custody adoption continues to accelerate as hardware wallet manufacturers report record unit sales throughout early 2026, fueled by growing distrust of centralized exchanges following high-profile security incidents. Third, corporate treasury strategies pioneered by Strategy (formerly MicroStrategy) — which now holds 761,068 BTC at an average cost basis of $66,384 — have inspired a global wave of imitators. Sweden's H100 Group is pursuing Europe's largest Bitcoin treasury at 3,500 BTC, while Bitmine has aggressively accumulated 4.66 million ETH including a $138 million purchase announced on March 23 alone.
The 2017 Parallel — What Happened Next
The last time exchange reserves touched comparable lows was December 2017 — the very month Bitcoin peaked at $19,783 before its year-long correction. However, today's supply dynamics differ fundamentally from that era. In 2017, low reserves reflected euphoric retail buying frenzy; in 2026, they reflect calculated institutional hoarding during a period of extreme fear. The current whale accumulation pattern more closely resembles late 2018 through early 2019, when smart money quietly built positions while the Fear & Greed Index languished well below 20. Within 18 months of that accumulation phase, BTC had rallied over 300%.
With Binance perpetual funding rates at -0.0029% for BTC — indicating short sellers are paying longs to maintain positions — and the Fear & Greed Index pinned at a devastating 8 out of 100, the market structure strongly suggests sellers are approaching exhaustion. The question confronting traders is no longer whether supply compression exists, but how violently price will respond when genuine demand returns to a market operating with historically thin exchange-side liquidity.
Regional Price Discounts Hit -0.85% — Contrarian Signal or Warning From Asia's Largest Markets?
Regional price premiums and discounts across Asia's cryptocurrency exchanges have long served as powerful sentiment barometers for the global market cycle. Currently, Bitcoin trades at a -0.85% discount on major Asian exchanges compared to global spot prices, while Ethereum shows a -0.70% discount, according to SpotedCrypto premium tracking data. This negative premium — a dramatic reversal from the infamous "Kimchi premium" that peaked at +54.5% during the 2017-2018 bull run — signals a fundamental shift in regional investor sentiment, as documented by CryptoSlate. Historically, negative regional premiums in Asia's third-largest crypto market by trading volume have coincided with bear market bottoms, functioning as a reliable contrarian indicator. The current discount, combined with a Fear & Greed Index frozen at an extreme reading of 8 out of 100, suggests that retail capitulation in Asian markets may be approaching complete exhaustion — though whether this marks the bottom or precedes further downside remains the pivotal question for global allocators.
Regional Premium Tracker — Then vs. Now
| Period | BTC Regional Premium | Market Phase | Subsequent 12-Month Return |
|---|---|---|---|
| January 2018 (Peak) | +54.5% | Euphoric Top | -73% |
| December 2018 (Bottom) | -1.2% | Bear Market Capitulation | +95% |
| March 2020 (COVID Crash) | -0.9% | Panic Liquidation | +1,400% |
| June 2022 (Luna Collapse) | -1.5% | Contagion Bottom | +158% |
| March 2026 (Current) | -0.85% | Extreme Fear (Index: 8) | ? |
Asia's Retail Capitulation vs. Institutional Conviction
The divergence between Asian retail sentiment and global institutional behavior has reached a striking extreme. While regional exchanges display negative premiums — clear evidence of net selling pressure from local retail traders — institutional players are moving aggressively in the opposite direction. Strategy purchased 22,337 BTC worth $1.6 billion in a single week between March 9-15, and spot ETF inflows exceeded $1.167 billion across seven consecutive sessions before a modest $129.62 million outflow on March 18, according to The Market Periodical.
This decoupling is not isolated to one region. Binance data shows BTC 24-hour volume at $1.71 billion with a +3.56% recovery to $71,080, while ETH volume reached $1.03 billion. Negative funding rates across most major perpetual pairs — BTC at -0.0029%, SOL at -0.0019%, and DOGE at -0.0045% — confirm that bearish retail positioning dominates derivatives markets globally, reinforcing the thesis that fear-driven selling pressure extends well beyond Asian borders.
Historical Pattern — When Regional Discounts Preceded Rallies
Every major bear market bottom since 2018 has featured negative regional premiums across Asia's largest exchanges. The December 2018 discount of -1.2% preceded a 95% rally over the following twelve months. The COVID crash of March 2020 produced a -0.9% discount before BTC surged over 1,400% in 13 months. The Luna-induced capitulation in June 2022 pushed the premium to -1.5% before a 158% recovery materialized within a year. The current -0.85% reading falls squarely within this historical range of confirmed bottoming signals — though timing the exact inflection point remains the market's most expensive guessing game. For traders monitoring these cross-regional dynamics, the convergence of extreme fear, negative premiums, and accelerating institutional accumulation creates a setup that has historically rewarded patience far more often than panic.
Key Watchpoints This Week — Fear Index Recovery Conditions and Critical Events
The Crypto Fear & Greed Index at 8/100 represents one of the most extreme sentiment readings in Bitcoin's history, matching levels last seen during the March 2020 COVID crash. According to Spoted Crypto, the index has remained in "Extreme Fear" territory for 46 consecutive days — the second-longest streak on record after the 73-day run during the 2022 Terra/Luna collapse. Historical data shows that buying when the index falls below 15 has produced a median 90-day return of +38.4%, making this a statistically significant contrarian signal. However, extreme fear can persist far longer than most investors expect, and the 2022 precedent demonstrates that further downside of up to 40% is possible even after the index reaches single digits. This week's confluence of macroeconomic catalysts and ETF flow reversals will determine whether the current reading marks a generational bottom or a waypoint toward deeper losses.
Historical Playbook: What Single-Digit Fear Has Delivered
Two prior instances of single-digit Fear & Greed readings offer instructive — but conflicting — lessons. In March 2020, the index hit 8 as Bitcoin crashed to $3,800 during the COVID liquidity crisis. Within 13 months, BTC surged over +1,400%, rewarding investors who bought into peak panic with generational returns. Similarly, when the index bottomed at 6 during the June 2022 Terra/Luna contagion, Bitcoin eventually rebounded +158% within the following year, according to Yahoo Finance.
The critical caveat is timing. During 2022, the Fear & Greed Index remained below 20 for 73 consecutive days. Throughout that extended stretch, Bitcoin declined an additional 40% from the initial extreme fear reading before finally finding its cycle low. The current 46-day streak has not yet matched that duration, leaving open the possibility that the market has not fully capitulated. Investors referencing the historical fear index analysis on Spoted Crypto should note that while the median outcome strongly favors buyers, the distribution includes painful interim drawdowns before recovery materializes.
Macro Catalysts: FOMC Minutes and Economic Data on Deck
This week's macroeconomic calendar presents several potential volatility triggers. The release of FOMC meeting minutes will be scrutinized for any shift in the Federal Reserve's rate trajectory, particularly given persistent inflation concerns and softening labor market signals. Any hawkish surprises could extend the current fear cycle, while dovish language may provide the catalyst for a relief rally. Key economic indicators including jobless claims and PMI prints will shape the recession risk narrative — a factor that has pressured risk assets across the board throughout Q1 2026. Bitcoin's 24-hour trading range of $67,360 to $71,499 on Binance reflects heightened sensitivity to macro data releases, with BTC currently trading at $71,080 after a +3.56% daily recovery.
ETF Flows: The $129 Million Reversal Test
After seven consecutive days of net inflows totaling $1.167 billion, U.S. spot Bitcoin ETFs experienced $129.62 million in outflows on March 18, abruptly ending the positive streak, as reported by The Market Periodical. Whether this marks a single-day anomaly or the start of sustained outflows is arguably the most critical data point this week. BlackRock's IBIT led the prior inflow wave with $601 million in a single week, per CoinPaprika, underscoring that institutional appetite has not fully evaporated. Q1 2026 cumulative ETF net inflows stand at $18.7 billion, with lifetime totals exceeding $65 billion — a structural demand floor that simply did not exist during prior bear markets.
Mining Sector Stability: Strategic Pivot, Not Capitulation
Han Tan, Chief Market Analyst at Bybit, provides a critical reframe of the mining sector narrative: "Bitcoin miners aren't capitulating; they're making strategic diversifications. The drawdown in the hashrate is only to be expected in light of Bitcoin's price plummet, but does not imply structural capitulation." This distinction matters because miner capitulation — forced selling of BTC reserves to cover operating costs — has historically preceded the deepest cycle bottoms. If the current hashrate decline reflects portfolio optimization rather than financial distress, it suggests miners retain sufficient balance sheet strength to weather extended price weakness, reducing the risk of a forced-selling cascade that could trigger another leg down.
Investor Checklist: Navigating the Asymmetric Risk-Reward
For investors evaluating positions during this unprecedented fear stretch, the data presents an asymmetric opportunity tempered by significant timing risk. The +38.4% median 90-day return from sub-15 fear readings, combined with exchange reserves at seven-year lows of 2.21 million BTC and whale wallets at an all-time high of 20,031 addresses holding 100+ BTC, paints a picture of structural supply compression meeting temporary demand paralysis. Negative funding rates across major pairs — BTC at -0.0029% and ETH at -0.0003% on Binance — confirm the derivatives market remains net-short, creating short-squeeze conditions. However, the 2022 template where 73 days of extreme fear accompanied an additional 40% decline serves as a sobering counterpoint. Dollar-cost averaging, strict position sizing, and disciplined risk management remain non-negotiable in a regime where the median outcome is highly favorable but the tail risk is severe.
Frequently Asked Questions
Is a Fear & Greed Index of 8 a Buy Signal?
A reading of 8 out of 100 on the Crypto Fear & Greed Index places the market deep in "Extreme Fear" territory — a zone that has historically preceded significant recoveries. As of March 23, 2026, the index has sustained readings below 10 for 46 consecutive days, the longest streak since the 2022 bear market according to Spoted Crypto research. Historical data shows that purchases made when the index fell below 15 have delivered a median 90-day return of +38.4%, but this is far from a guaranteed outcome — the 2022 cycle saw the index linger in single digits for weeks while BTC shed another 40% from similar levels. Institutional players appear to be treating this as an accumulation window, with whale wallets holding 100+ BTC reaching a record 20,031, while retail traders are cautioned against deploying leveraged positions in an environment where liquidation cascades remain a persistent risk.
Are Institutional Investors Exiting Bitcoin ETFs?
The narrative of institutional flight from Bitcoin spot ETFs is not supported by the data. U.S.-listed Bitcoin ETFs recorded approximately $1.167 billion in net inflows over the seven-day streak ending March 17, 2026, with BlackRock's IBIT alone driving $601 million in a single week. While a $129.62 million outflow on March 18 broke the streak, as reported by The Market Periodical, this represented a minor profit-taking event rather than a structural exit. Q1 2026 cumulative net inflows have remained robust at an estimated $18.7 billion, with even BTC's drawdown from all-time highs failing to trigger net outflows exceeding $10 billion — a sign that the vast majority of ETF holders are maintaining their positions. The selling pressure appears concentrated among retail-sized redemptions, while institutional allocators with multi-year mandates continue to build exposure through regulated vehicles.
What Does a Negative Regional Premium Mean for Crypto Markets?
Regional price premiums — the difference between crypto prices on domestic exchanges versus global benchmarks — serve as powerful sentiment indicators. The most widely tracked is the so-called "Kimchi Premium" on South Korean exchanges, which has flipped negative in March 2026, meaning Bitcoin trades at a discount relative to global spot prices. This reversal is historically significant: during the 2017 mania, the premium peaked at +54.5% as Korean retail investors bid prices far above global averages, according to CoinDesk historical data. A negative premium has appeared at or near market bottoms in previous cycles, reflecting extreme capitulation among regional retail participants. For global investors monitoring cross-exchange sentiment metrics, a negative regional premium aligning with an Extreme Fear index of 8 and record whale accumulation paints a picture of a market where weak hands are exiting precisely as large-scale buyers are stepping in.
Why Are Corporations Still Buying Bitcoin During a Downturn?
Corporate Bitcoin treasuries are expanding at an accelerating pace despite — or perhaps because of — the current market fear. Strategy (formerly MicroStrategy) purchased 22,337 BTC for $1.6 billion between March 9–15 alone, bringing its total holdings to 761,068 BTC at an average cost basis of $66,384. In Europe, Sweden's H100 Group is pursuing what would become the continent's largest corporate Bitcoin treasury at 3,501 BTC through proposed acquisitions of Moonshot AS and Never Say Die AS, as reported by CoinDesk. Meanwhile, Bitmine (BMNR) deployed $138 million to acquire 65,341 ETH, pushing its Ethereum holdings to 4.66 million ETH — 3.86% of circulating supply. These firms are applying a long-term value investing framework, treating depressed prices as a discount window for treasury diversification rather than a signal to retreat, a strategy that aligns with on-chain data showing exchange reserves at a 7-year low of 2.21 million BTC.
Data Sources
- IBTimes — BTC price and market consolidation data
- Spoted Crypto — Fear & Greed Index analysis, extreme fear duration
- Spoted Crypto — Exchange reserves and whale wallet data
- Spoted Crypto — Large whale accumulation trends
- CoinDesk — Bitmine ETH acquisition
- CoinDesk — H100 Group Bitcoin treasury expansion
- DimSumDaily — Strategy (MicroStrategy) BTC purchases
- The Market Periodical — Bitcoin ETF flow data
- CoinPaprika — BlackRock IBIT inflow data
- BeInCrypto — Bitcoin scarcity index and whale metrics
- CoinGlass — Fear & Greed Index, derivatives data
This article is for informational purposes only and does not constitute investment advice. All investment decisions should be made based on your own judgment and responsibility.
Related Articles
- Fear & Greed Index Hits 10: 46 Days of Extreme Fear — Week 4 March Crypto Briefing
- Bitcoin Hits $70K Max Pain as Fear Index Drops to 23 — $542M Liquidated
- Bitcoin Drops to $70,900 After FOMC Hold — Fear Index Hits 26
- SEC Declares Most Crypto 'Not Securities' as FOMC Looms — March 18 Market Briefing
- ETH Surges 8% as Fear & Greed Hits 23: $1.06B Institutional Inflows – March 17 Market Briefing