The Fear & Greed Index sits at 23/100 — Extreme Fear. Total crypto market cap stands at $2.59 trillion as of April 15, 2026, with Bitcoin trading at $73,868 on Binance and Ethereum at $2,317. For long-term investors, moments like this are precisely when dollar-cost averaging earns its reputation.
DCA exploits the one thing crypto has in abundance: volatility. When markets drop and sentiment collapses, DCA investors accumulate more coins per dollar than they did at higher prices. With Bitcoin dominance at 57.3% and Ethereum (-2.37%) and Solana (-3.22%) deep in the red, the math is working in your favor — if you are buying systematically.
What Is Dollar-Cost Averaging in Crypto?
Quick Answer: Dollar-cost averaging (DCA) means investing a fixed dollar amount at regular intervals regardless of price. With Bitcoin at $73,868 and the Fear & Greed Index at 23/100 (Extreme Fear), each weekly purchase buys more BTC when prices fall — automatically lowering your average cost over time.
Instead of timing a perfect entry — which even professional traders rarely achieve — DCA commits a fixed amount (say, $100 weekly) to buy at whatever the current price is. When prices are low, your $100 buys more coins. When prices are high, it buys fewer. Over time, your average cost per coin ends up significantly below the market's highest peaks.
In traditional finance, DCA is applied to index funds and ETFs. In crypto, larger price swings make it even more powerful — a 30% drawdown accelerates accumulation rather than hurting you. Track your DCA portfolio at SpotedCrypto.
Current Market Snapshot: Binance Volume Leaders
As of April 15, 2026 at 20:00 KST, here are the top assets by Binance volume — the environment your DCA is operating in:
| # | Coin | Price | 24h Change | Volume(24h) | High | Low |
|---|---|---|---|---|---|---|
| 1 | USDC | $1.00 | +0.01% | $3.7B | $1.00 | $1.00 |
| 2 | BTC | $73,868 | -0.62% | $1.8B | $76,038 | $73,514 |
| 3 | ETH | $2,317 | -2.37% | $846.1M | $2,415.50 | $2,302.90 |
| 4 | SOL | $83 | -3.22% | $280.8M | $87.67 | $82.65 |
| 5 | XRP | $1.36 | -1.01% | $128.2M | $1.40 | $1.35 |
| 6 | XAUT | $4,778 | +0.72% | $126.7M | $4,844.84 | $4,740.48 |
| 7 | DOGE | $0.09 | -1.42% | $104.7M | $0.10 | $0.09 |
Bitcoin leads with $1.8B in 24-hour volume at $73,868 (-0.62%). Ethereum sits at $2,317 (-2.37%) and Solana at $83 (-3.22%). Notably, gold-backed XAUT is the only major outperformer at +0.72% — a classic flight-to-safety signal. Anthony Pompliano, founder of Pomp Investments, has consistently argued that extreme fear calls for DCA acceleration, not retreat: "When others are fearful, that's when DCA investors should lean in — not pull back."
What Futures Data Tells DCA Investors Right Now
Derivatives markets give DCA investors a real-time sentiment reading. Here is the full Binance futures snapshot:
| Coin | Funding Rate | Open Interest | Long/Short |
|---|---|---|---|
| BTC | -0.0051% | $7.2B | 42.6% / 57.4% |
| ETH | +0.0016% | $5.2B | 57.9% / 42.1% |
| SOL | -0.0091% | $798.8M | 72.7% / 27.3% |
| XRP | -0.0018% | $362.2M | 70.3% / 29.7% |
| DOGE | -0.0026% | $211.3M | 71.7% / 28.3% |
| BNB | 0.0000% | $340.3M | N/A |
| ADA | -0.0146% | $78.7M | N/A |
| DOT | -0.0850% | $55.3M | N/A |
| AVAX | +0.0089% | $79.8M | N/A |
| LINK | +0.0005% | $81.4M | N/A |
Three signals stand out for DCA investors. Bitcoin's negative funding rate (-0.0051%) means short sellers are paying longs — bearish overcrowding that historically precedes sharp reversals. Only 42.6% of BTC futures positions are long, with $7.2B open interest skewed short. Ethereum tells a different story: positive funding (+0.0016%) and 57.9% long positioning indicate the market retains a recovery bias. DOT's extreme negative funding (-0.0850%) signals peak pessimism in mid-caps. For spot DCA buyers, this derivatives environment is a confirmation to keep accumulating. OKX corroborates: BTC at $73,872.80 and ETH at $2,317.22 — near-identical to Binance, confirming no unusual arbitrage distortions.
Setting Up Your DCA: 3 Variables to Define First
Effective DCA is systematic, not random. Pre-define these three variables before placing your first recurring order:
| Variable | Recommended Range | Example |
|---|---|---|
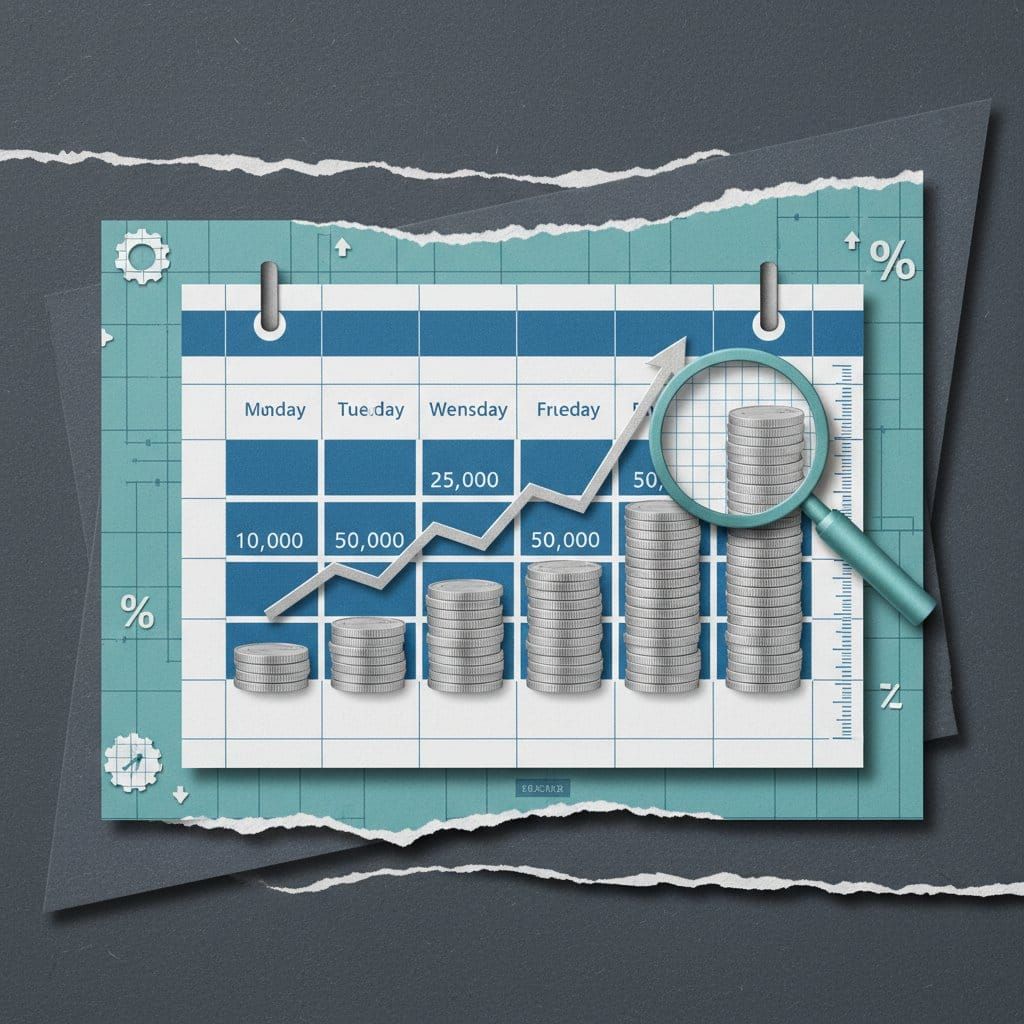
| Frequency | Weekly or bi-weekly | Every Monday, automated |
| Amount | 5–20% of monthly disposable income | $300/month → $75/week |
| Asset Mix | Focus on large-cap assets | BTC 60% + ETH 30% + Alts 10% |
At current Binance prices, $75 weekly into ETH at $2,317 buys approximately 0.0324 ETH per purchase. A $45 weekly BTC buy at $73,868 yields roughly 0.00061 BTC. These amounts compound meaningfully over 12–24 months of consistent accumulation — especially during extended periods of suppressed prices. Explore portfolio strategies at SpotedCrypto.
Bitcoin vs. Ethereum for DCA: 2026 Comparison
Both BTC and ETH are solid DCA targets. Your choice depends on risk tolerance and time horizon:
| Metric | Bitcoin (BTC) | Ethereum (ETH) |
|---|---|---|
| Price (Binance) | $73,868 | $2,317 |
| 24h Change | -0.62% | -2.37% |
| Market Dominance | 57.3% | 10.8% |
| Funding Rate | -0.0051% | +0.0016% |
| Open Interest | $7.2B | $5.2B |
| Long/Short | 42.6% / 57.4% | 57.9% / 42.1% |
| DCA Profile | Conservative anchor | Growth-oriented accumulation |
Bitcoin's 57.3% dominance reflects capital consolidation into the strongest asset during uncertainty. Its negative funding and majority-short futures positioning are contrarian signals: overcrowded shorts tend to unwind sharply when sentiment reverses. BTC is the appropriate anchor for conservative DCA portfolios.
Ethereum's larger daily decline (-2.37%) means each dollar buys proportionally more ETH today. With 57.9% of futures positions long, the market has not abandoned ETH's recovery thesis. For investors with a 2–3 year horizon and higher volatility tolerance, ETH at $2,317 offers compelling accumulation territory. Get the latest Ethereum analysis at SpotedCrypto.
Four DCA Rules Never to Break
- Only invest what you can ignore for 12+ months. Emergency funds and borrowed capital destroy discipline. DCA requires the ability to weather drawdowns without liquidating.
- Keep buying when prices fall — especially then. Pausing during corrections is the most common DCA failure. Lower prices mean your fixed investment buys more coins, producing a better long-term cost basis.
- Diversify across assets. A BTC/ETH split — with an optional small SOL allocation at $83 — reduces single-asset concentration risk.
- Rebalance quarterly. If BTC surges and shifts your allocation from 60% to 80%, trim back to target. Quarterly rebalancing locks in relative gains without emotional timing. Monitor your allocations at SpotedCrypto.
Frequently Asked Questions
How much should I invest weekly for crypto DCA?
The standard guideline is 5–20% of monthly disposable income, split into weekly or bi-weekly purchases. With the Fear & Greed Index at 23 (Extreme Fear), modestly increasing your normal allocation is historically defensible — provided the funds are truly disposable. At current Binance prices (BTC $73,868, ETH $2,317), even $50–$100 per week builds meaningful exposure over a 12–24 month horizon. Never invest money you may need within the next six months.
When should I stop a DCA strategy?
Stop DCA when you have reached your target allocation or a pre-defined profit goal — not because prices keep falling. A practical rule: set a coin target (e.g., 0.5 BTC or 2 ETH), then shift to quarterly rebalancing maintenance once reached. Some investors automate partial profit-taking at pre-set price levels to lock in gains without emotional timing. Track progress and set price alerts at SpotedCrypto.
This article is for informational purposes only and does not constitute financial or investment advice. Cryptocurrency investments carry significant risk of loss. Always conduct your own research and consult a licensed financial advisor before making any investment decisions.
Related Articles
- Crypto DCA Strategy Guide 2026: +1,648% Backtest Results Proven
- BTC Dominance at 57%: What It Means and When Altcoin Season Begins
- Korea Crypto Exchanges 2026: Upbit vs Bithumb vs Coinone Compared
- Best Crypto Wallets in 2026: Cold Wallet vs Hot Wallet Complete Guide
- AI Crypto Coins: The Complete 2026 Guide to Top Projects