Trezor Has Three Models Now — Which One Should You Buy?
Compare Trezor Safe 3, Safe 5, and Safe 7 with live 2026 market data. Step-by-step setup guide, security risk table, and expert-backed buying recommendations for every level of crypto investor.


Crypto guides for beginners and beyond. Learn about Bitcoin, DeFi, blockchain technology, and smart investing in plain English.
Compare Trezor Safe 3, Safe 5, and Safe 7 with live 2026 market data. Step-by-step setup guide, security risk table, and expert-backed buying recommendations for every level of crypto investor.

Everything you need to know about Exodus Wallet in 2026: features, step-by-step setup, risk table, staking APYs, and live Binance market context — the definitive self-custody guide for beginners.

Everything you need to know about Exodus wallet in 2026: how it works, how it compares to Trezor, a four-step setup guide, and a data-driven security risk table — with live market context from Binance and OKX.
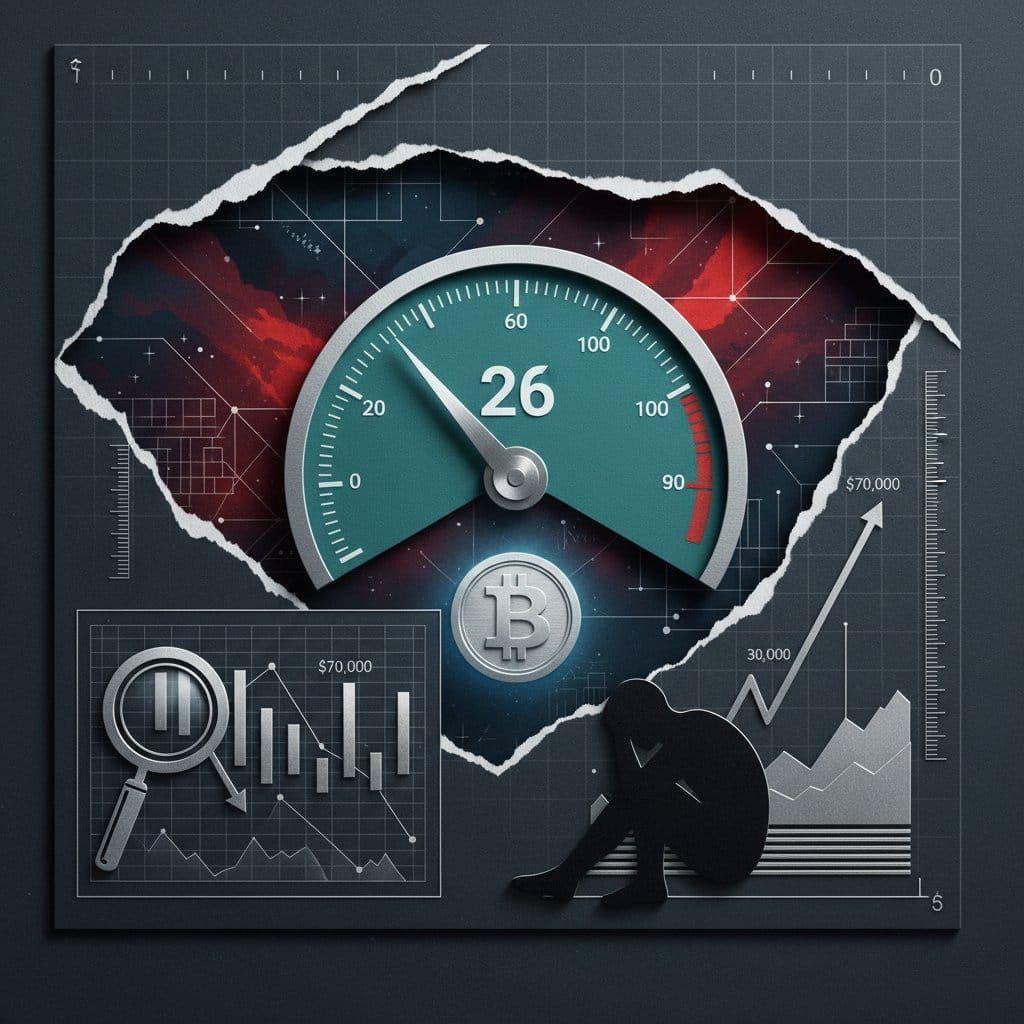
The Crypto Fear & Greed Index dropped to 26 on April 29, 2026 — down 7 points in a single day. BTC holds at $76,967 with 58.1% dominance. Here is what the Fear zone means historically and how investors should respond.
Over $600M stolen from crypto users in 2026 YTD. We compare Trezor, Ledger, and Exodus on real security data—plus a beginner checklist built for the AI hacking era.

The RWA tokenization market surpassed $18.6 billion in April 2026. Learn how to invest in tokenized real estate, bonds, and art — with platform comparisons, a step-by-step guide, and live market data.
Solana's 5,000 TPS and $11.49B weekly DEX volume vs Ethereum's $55.6B TVL and 31,869 developers — a complete data-driven comparison of the two dominant L1 blockchains in 2026.

BTC at $78,111 or ETH at $2,331 — which belongs in your 2026 portfolio? We break down the tech specs, live derivatives data, ecosystem depth, and institutional adoption to help you decide.

BTC at $77,542, dominance at 58.1%, Fear & Greed at 31: here's how to build and rebalance a crypto portfolio that survives the volatility and captures the next cycle's upside — using live Binance and OKX data.
Master the four core technical indicators — candlestick patterns, RSI, MACD, and Bollinger Bands — with verified 2026 data, live market context, and a combined strategy that delivers a 77% backtested win rate.
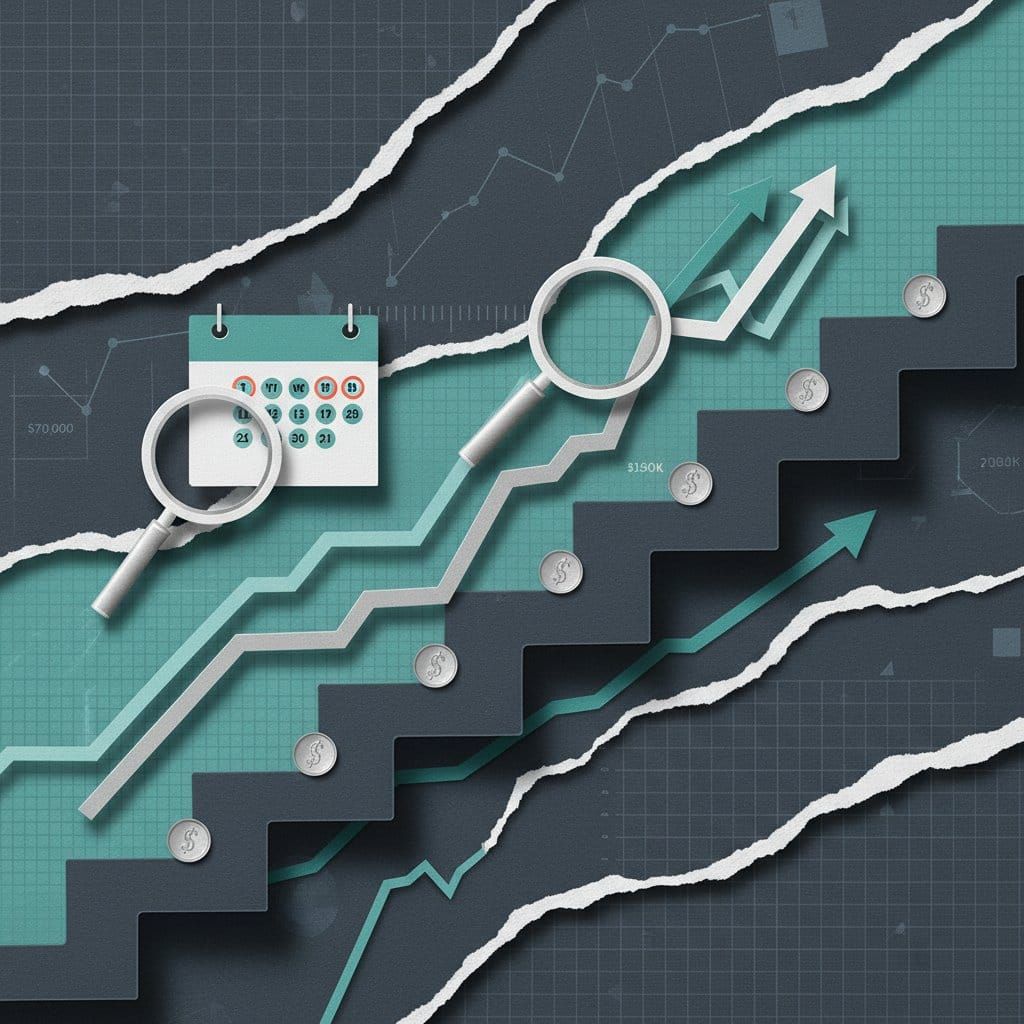
A $100/month Bitcoin DCA from 2014 to 2026 turned $14,600 into $994,950 — a +6,712% return. Complete guide: 12-year backtesting data, exchange fee comparison, frequency analysis, and live April 2026 market context.
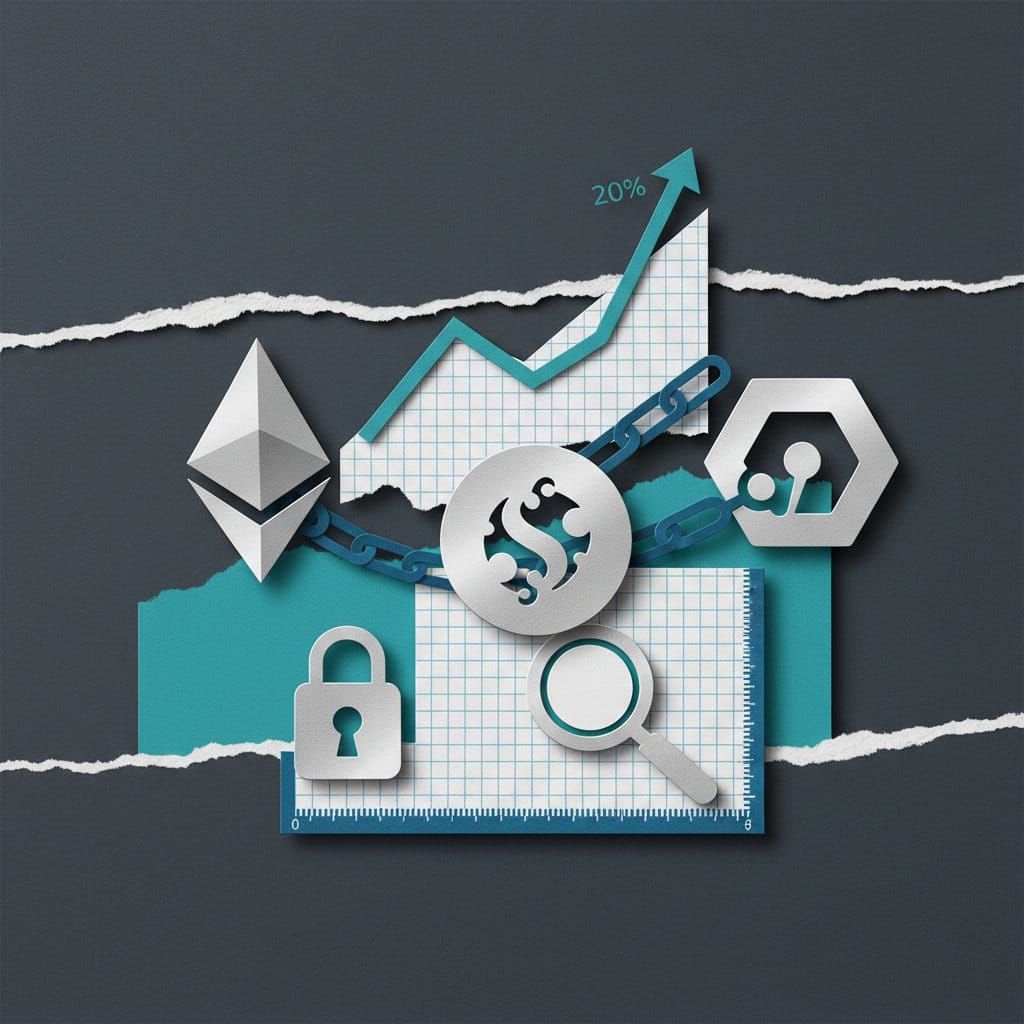
Compare ETH, SOL, DOT, and ATOM staking APYs, unbonding periods, and slashing risks with live 2026 data. Liquid staking vs. traditional staking — everything you need to know before you commit.