The Complete Guide to Long-Term Crypto Investing in 2026: DCA, Staking & Self-Custody
DCA backtested at 1,145% returns, staking APY comparisons, and self-custody security — a data-driven 2026 guide.
Is Long-Term Crypto Investing Still a Winning Strategy in 2026?
Quick Answer: Long-term cryptocurrency investing remains one of the most compelling wealth-building strategies in 2026, anchored by three pillars: Dollar-Cost Averaging (DCA), staking yields, and self-custody security. A simple $10 weekly Bitcoin DCA over five years delivered a 202% return — dwarfing gold (34%) and the Dow Jones (23%) over the same period, according to dcabtc.com.
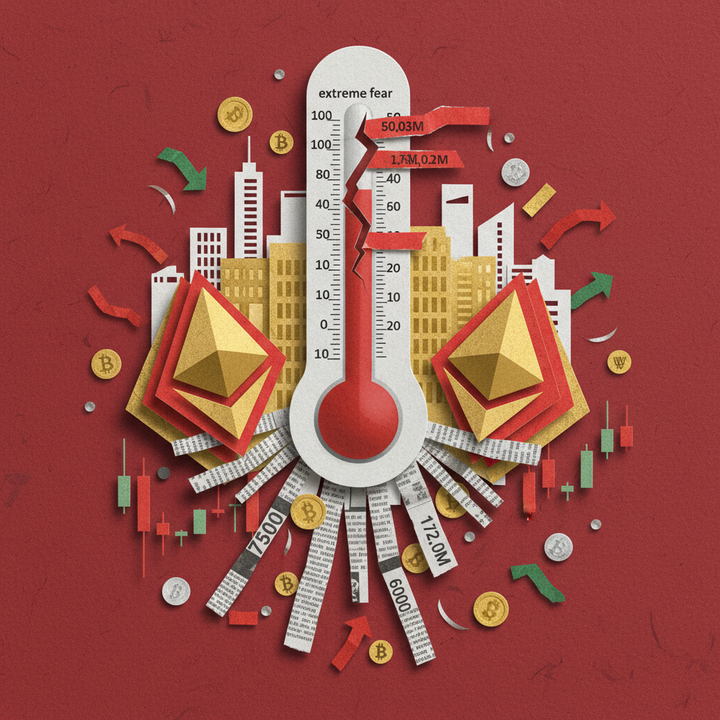
Long-term crypto investing is the disciplined practice of accumulating digital assets over months or years, weathering volatility in pursuit of asymmetric returns. With the Fear & Greed Index sitting at 28 (Fear) as of March 17, 2026, and Bitcoin trading at $75,661 according to Binance, the market is once again testing investor conviction. Yet history consistently rewards those who stay the course. A $10 weekly Bitcoin DCA from 2019 to 2024 turned $2,610 into $7,913 — a 202.03% gain — while gold returned just 34.47% and the Dow Jones a mere 23.43% over the identical window, per dcabtc.com. This isn't a speculative anomaly; it's a structural edge driven by Bitcoin's fixed supply, quadrennial halving cycles, and accelerating institutional adoption. For investors willing to ignore short-term noise, these fundamentals make 2026 one of the most strategic entry points in crypto's 17-year history.
Institutional conviction is no longer theoretical — it's quantifiable. Strategy (formerly MicroStrategy), led by Executive Chairman Michael Saylor, now holds 738,731 BTC at an average cost basis of $75,862, representing over 3.4% of Bitcoin's total 21-million supply, according to The Block. Saylor's methodical, quarter-after-quarter accumulation — what he calls "the second century" — is arguably the largest real-world DCA experiment ever conducted, with roughly $56 billion deployed. If the world's most aggressive corporate Bitcoin buyer treats every price level as an opportunity, individual investors sitting on the sidelines face a sobering question: what do they know that Saylor doesn't?
Why Fear Is Your Biggest Advantage Right Now
Market sentiment analytics firm Santiment noted in February 2026: "High negativity is often a bullish signal. When the crowd is convinced prices will go lower, it is often the time to start looking for long entries." The current Fear & Greed reading of 28 places the market firmly in the fear zone — precisely where disciplined long-term investors have historically built their most profitable positions. Bitcoin's funding rate on Binance sits at a neutral 0.0002%, indicating neither excessive leverage long nor short, a rare equilibrium that often precedes significant directional moves.
| Asset | 5-Year Return ($10/week DCA) | Total Invested | Ending Value |
|---|---|---|---|
| Bitcoin (BTC) | +202.03% | $2,610 | $7,913 |
| Gold (XAU) | +34.47% | $2,610 | $3,510 |
| Dow Jones (DJIA) | +23.43% | $2,610 | $3,222 |
This guide breaks down everything you need to master long-term crypto investing in 2026. We start with DCA mechanics and seven years of backtested performance data. From there, we cover staking yields — how to earn passive income on assets you already hold — and exchange fee structures that silently erode your returns. Finally, we tackle self-custody: why controlling your own private keys isn't optional after $14 billion was stolen in the 2025 Bybit hack alone, and how hardware wallets from Ledger and Trezor stack up. Whether you're deploying your first $50 or managing a six-figure portfolio, the principles are identical — and the data proves they work.
What Is Dollar-Cost Averaging (DCA)? A 7-Year Backtest Breakdown
Dollar-cost averaging is a systematic investment strategy where a fixed dollar amount is allocated to an asset at regular intervals — weekly, biweekly, or monthly — regardless of its current price. Applied to Bitcoin between 2018 and 2025, a fear-based contrarian DCA approach delivered a staggering 1,145% return, outperforming a simple buy-and-hold strategy (1,046%) by 99 percentage points, according to Spoted Crypto research compiled from Bitcoin Magazine Pro data. The mechanism is deceptively simple: by purchasing more units when prices are depressed and fewer when prices are elevated, DCA systematically lowers the average cost basis over time. During the 2022 bear market, DCA practitioners achieved an average entry price of $35,000 per BTC, while one-time buyers who deployed capital at the start of the downturn averaged $43,000 — a 33-percentage-point disadvantage that compounded dramatically during the subsequent recovery.
Raoul Pal, CEO and Founder of Real Vision and former Goldman Sachs executive, captured the thesis succinctly: "Bitcoin is the best-performing asset in all history... Just buy Bitcoin and use DCA (cost averaging) strategy," as reported by U.Today via TradingView. Pal's conviction is rooted in Bitcoin's unique combination of absolute scarcity and network effects — properties that no traditional asset class replicates. For long-term investors, DCA transforms these structural advantages into a repeatable, emotionally manageable process.
The Monday Effect: When You Buy Matters More Than You Think
Not all DCA schedules are created equal. Backtesting data from 2018 to 2025 reveals a meaningful "Monday effect": investors who executed their recurring purchases on Mondays accumulated 14.36% more Bitcoin than those buying on other weekdays, according to dcabtc.com. This edge likely stems from weekend sell pressure and lower institutional activity, which depress Sunday-to-Monday prices relative to mid-week levels. While 14% may seem marginal over a single week, compounded across 52 weekly buys per year over five or seven years, the difference translates into thousands of additional dollars in portfolio value. For DCA practitioners setting up automated purchases on exchanges like Binance or OKX, simply scheduling the buy for Monday mornings could meaningfully boost long-term returns at zero additional cost.
Halving Cycles: Diminishing Returns, But Still Dominant
Bitcoin's four-year halving cycle — when block rewards are cut in half — has historically been the single most powerful catalyst for price appreciation. However, the data reveals a clear trend of diminishing post-halving returns as the asset matures and its market capitalization grows, per research from Kaiko Research and ARK Invest.
| Halving Year | Pre-Halving Price | 1-Year Post-Halving Return | Post-Halving Peak |
|---|---|---|---|
| 2012 | ~$12 | +7,000% | $650+ |
| 2016 | ~$650 | +291% | $8,570 |
| 2020 | ~$8,570 | +541% | $63,850 |
| 2024 | ~$63,000 | ~+100% | ~$126,000 |
The pattern is unmistakable: the 2024 halving delivered roughly +100% one-year gains — the lowest post-halving return on record, yet still vastly outperforming virtually every traditional asset class. This diminishing trajectory reflects market maturation: as Bitcoin's market cap approaches and exceeds $1.5 trillion, it takes exponentially more capital to move the price by the same percentage. For long-term DCA investors, this means calibrating expectations — the era of 7,000% post-halving runs is over, but triple-digit annualized returns remain firmly on the table.
Bear Market DCA: Where Fortunes Are Built
The most compelling evidence for DCA's superiority emerges during bear markets — exactly when most investors stop buying. During the 2022 crypto winter, Bitcoin plunged from $47,000 to below $16,000, wiping out over $2 trillion in total market value. Investors who maintained a disciplined weekly DCA through that drawdown achieved an average cost basis of $35,000, compared to $43,000 for those who attempted a single lump-sum entry at the cycle's start. That $8,000-per-coin difference — roughly 23% — became pure profit acceleration when Bitcoin subsequently recovered past $75,000. Arthur Hayes, Co-Founder of BitMEX, reinforced this outlook, stating: "Obviously, I believe [Bitcoin will reach $200,000] in 2026... Dollar liquidity must expand for that to happen," as cited by Spoted Crypto. With the current Fear & Greed Index at 28 and BTC at $75,661, history suggests today's fear zone may once again be tomorrow's DCA sweet spot.
How to Optimize DCA Buy Timing Using the Fear & Greed Index
The Fear & Greed Index is a composite sentiment indicator that measures market emotions on a scale of 0 (extreme fear) to 100 (extreme greed), aggregating volatility, trading volume, social media trends, and Bitcoin dominance data into a single actionable score. As of March 17, 2026, the index sits at 28—firmly in "Fear" territory, according to live Binance market data. Historical backtesting reveals that initiating DCA positions when the index drops below 10 has produced returns ranging from +500% to +2,056% within 12 months, dramatically outperforming random-entry strategies. A seven-year backtest (2018–2025) of a contrarian fear-based DCA approach delivered 1,145% cumulative returns, surpassing simple buy-and-hold (1,046%) by 99 percentage points, according to Bitcoin Magazine Pro. This data underscores a counterintuitive truth: the moments that feel worst to invest are statistically the most profitable entry points for long-term crypto accumulation strategies.
Why Extreme Fear Creates the Best DCA Entry Points
Market sentiment works as a contrarian indicator because crowd psychology systematically misprices risk at extremes. When the Fear & Greed Index plunges into single digits, retail investors panic-sell while institutional accumulators quietly build positions. Blockchain analytics firm Santiment confirmed this pattern in February 2026:
"High negativity is often a bullish signal. When the crowd is convinced prices will go lower, it is often the time to start looking for long entries."— Santiment, Blockchain Analytics Platform
The 2022 bear market provides a compelling case study. Investors who employed DCA during the extreme fear zone achieved an average cost basis of $35,000 per BTC, compared to $43,000 for lump-sum buyers—a 33-percentage-point advantage, according to Spoted Crypto research. With BTC currently trading at $75,661 (+4.00% in 24 hours) and funding rates near neutral at 0.0002% on Binance, the derivatives market signals cautious positioning rather than euphoria—precisely the conditions that have preceded strong medium-term rallies historically. For investors building a long-term crypto investment portfolio, these fear-zone signals offer a quantifiable edge over emotional decision-making.
Building a Rule-Based DCA Plan for Maximum Returns
Emotional buying consistently underperforms systematic execution. A dcabtc.com backtest of weekly $10 BTC purchases from 2019–2024 turned a total investment of $2,610 into $7,913—a 202.03% return that crushed both gold (34.47%) and the Dow Jones (23.43%) over the same period. Notably, Monday purchases accumulated 14.36% more Bitcoin than other weekdays across the 2018–2025 testing window.
BitMEX co-founder Arthur Hayes has set an aggressive target that adds urgency to accumulation timelines:
"Obviously, I believe [Bitcoin will reach $200,000] in 2026... Dollar liquidity must expand for that to happen."— Arthur Hayes, Co-Founder, BitMEX (Spoted Crypto)
Here is a practical fear-indexed DCA framework for 2026:
- Base layer: Fixed weekly purchase (e.g., $50–$200) regardless of market conditions, executed every Monday for optimal accumulation based on backtested data.
- Fear bonus (Index 20–30): Increase weekly allocation by 50%. The current reading of 28 activates this tier today.
- Extreme fear bonus (Index below 10): Double or triple the base allocation. Historically, these windows have lasted only 2–4 weeks before sharp reversals.
- Greed reduction (Index above 75): Reduce allocation by 50% or pause new purchases entirely to avoid buying into euphoria.
Strategy's Michael Saylor has validated this systematic approach at institutional scale, accumulating 738,731 BTC at an average cost of $75,862 through consistent quarterly purchases—now holding over 3.4% of Bitcoin's total supply, according to The Block. For a comprehensive breakdown of dollar-cost averaging strategies in crypto, systematic rule-based execution remains the single greatest edge retail investors hold over emotional market participants.
Crypto Staking Yield Comparison: Real APY for ETH, SOL, DOT & ATOM
Crypto staking promises passive income, but the headline APY numbers most platforms advertise can be deeply misleading without accounting for token inflation. Staking rewards are paid in the native token, meaning that if the network's annual inflation rate exceeds your yield, the real purchasing power of your holdings actually shrinks over time. According to on-chain data from StakingRewards and protocol-level analytics, Ethereum currently offers 3–4% nominal APY with real yields of approximately 2–3% after inflation, while Solana advertises 6–8% nominal but delivers just 0–3% in real terms due to its higher emission schedule. Polkadot (12–14% nominal, 3–6% real) and Cosmos (15–19% nominal, 2–8% real) show even wider gaps between advertised and actual returns. With Bitcoin trading at $75,661 and ETH at $2,361 as of March 2026 on Binance, understanding these distinctions is critical before committing capital to any staking protocol.
Nominal vs. Real Staking Yields: The Inflation Trap
The table below reveals the critical gap between what staking platforms promise and what investors actually keep after network inflation dilutes their holdings:
| Asset | Nominal APY | Network Inflation | Real APY (After Inflation) | Key Risk Factor |
|---|---|---|---|---|
| ETH | 3–4% | ~0.5–1% | 2–3% | Slashing penalties |
| SOL | 6–8% | ~5–6% | 0–3% | High inflation erosion |
| DOT | 12–14% | ~8–10% | 3–6% | 28-day unbonding period |
| ATOM | 15–19% | ~10–13% | 2–8% | Variable inflation rate |
The pattern is unmistakable: the higher the nominal APY, the greater the inflation offset eating into real returns. ATOM's eye-catching 15–19% headline yield looks attractive until you realize that 10–13% of that is simply compensating for token supply expansion. Non-stakers effectively lose purchasing power through dilution, making staking less of an income "bonus" and more of a mandatory defense against inflation. Ethereum stands out as the most capital-efficient staking asset, with post-merge burn mechanics (EIP-1559) keeping net inflation near zero—and occasionally pushing the network deflationary—resulting in real yields that closely mirror nominal rates. SOL stakers face the harshest reality: despite advertising 6–8% APY, the 5–6% inflation rate means real returns can approach zero in unfavorable conditions.
Slashing Risks and Staking Infrastructure Challenges
Beyond inflation, validators face slashing—a penalty mechanism designed to punish dishonest or negligent behavior that can erase months of staking rewards in seconds. On Ethereum, slashing imposes an immediate penalty of approximately 1 ETH (1/32 of the effective balance), followed by a 36-day exit queue during which validators incur additional penalties of roughly 8,000 GWei per epoch, according to Consensys. During correlated slashing events—where multiple validators fail simultaneously—penalties scale dramatically, potentially wiping out a significant portion of staked capital.
Ethereum co-founder Vitalik Buterin has identified infrastructure complexity as the primary barrier to decentralized staking adoption:
"Running staking infrastructure should never require a team of experts. Simplifying the process is key to true decentralization."— Vitalik Buterin, Co-Founder, Ethereum (Yahoo Finance)
This complexity explains why liquid staking protocols like Lido and Rocket Pool have captured over 30% of all staked ETH—investors prefer delegating technical risk even at the cost of a 10–15% commission on rewards. Unbonding periods add another layer of illiquidity risk: DOT requires 28 days to unstake, while ATOM locks funds for 21 days. During volatile periods, this inflexibility can be costly—the 2025 Bybit hack, which resulted in $1.4 billion in losses according to Crystal Intelligence, triggered a market crash that locked stakers out of selling positions entirely.
For investors weighing staking against pure DCA accumulation strategies, the decision hinges on time horizon and risk tolerance. Short-term holders may find slashing and unbonding periods too restrictive, while long-term accumulators can compound real yields meaningfully: even a modest 2–3% real APY on ETH compounds to 22–34% additional returns over a decade. A 0.5% fee differential compounds to over 26% in lost returns across 10 years of weekly transactions. Investors exploring detailed coin analysis should always calculate real yields—not nominal rates—before committing to any staking position.
Exchange Fee Comparison: Binance vs. Kraken vs. Coinbase — Which Is Cheapest for Long-Term Investors?
Could a seemingly small difference in trading fees silently erode more than a quarter of your crypto portfolio over a decade? Exchange fee structures vary dramatically across the three most popular global platforms, with base maker/taker rates ranging from 0.10%/0.10% on Binance to 0.40%/0.60% on Coinbase — a spread that compounds ruthlessly against long-term dollar-cost averaging strategies. According to analysis by Spoted Crypto, a 0.5% fee differential applied to weekly trades accumulates to approximately 26% in lost returns over a 10-year investment horizon. For investors executing a disciplined DCA plan — purchasing Bitcoin or Ethereum at regular intervals regardless of price — choosing the wrong exchange is equivalent to accepting a hidden tax on every transaction. With BTC at $75,661 and ETH at $2,361 as of March 2026, even basis-point-level fee savings translate into thousands of dollars preserved over a multi-year accumulation phase. Understanding the true all-in cost of each platform is not optional — it is essential.
Maker/Taker Fee Breakdown: The Numbers That Matter
| Exchange | Maker Fee | Taker Fee | Fee Discount Program | Staking Available |
|---|---|---|---|---|
| Binance | 0.10% | 0.10% | Up to 25% off with BNB | Yes |
| Kraken | 0.16% | 0.26% | Volume-based tiers | Yes |
| Coinbase Advanced | 0.40% | 0.60% | Coinbase One ($29.99/mo) | Yes |
At base tier, Binance offers the lowest trading costs at a flat 0.10% for both makers and takers — a rate that drops further when users pay fees with BNB tokens. Kraken sits in the middle at 0.16%/0.26%, offering competitive rates that decrease through volume-based tiers. Coinbase Advanced, while providing the strongest regulatory standing in the United States, carries the steepest base fees at 0.40%/0.60%. For a $500 weekly DCA purchase, the per-trade cost difference between Binance ($0.50) and Coinbase ($3.00) is $2.50 — a figure that seems negligible in isolation until compounding takes effect over years of consistent accumulation.
The Compound Cost of Fees: 26% Lost Over a Decade
Here is where fee differences become genuinely alarming for long-term DCA investors. A 0.5% fee gap applied to 52 weekly trades per year compounds to approximately 26% in cumulative lost returns over 10 years. On a $500 weekly DCA portfolio — totaling $260,000 in principal over a decade — this translates to roughly $67,600 in eroded gains at historical Bitcoin growth rates. Consider the concrete example: an investor paying 0.10% per trade on Binance versus 0.60% on Coinbase surrenders $2.50 per transaction. Over 520 weekly purchases, that $1,300 in direct fee costs balloons through lost compounding into a five-figure drag on total portfolio value. The lesson is unambiguous: fee optimization is not a micro-detail but a macro-level portfolio decision.
Regional Price Premiums: A Hidden Variable for Global Investors
Beyond explicit fee structures, regional price discrepancies introduce another layer of cost — or opportunity. As of March 2026, BTC trades at a -0.68% reverse premium on certain Asian exchanges relative to global benchmarks, with ETH showing a similar -0.66% discount, according to market data tracked by CoinGlass. These negative premiums — the inverse of the historically observed "Kimchi premium" in Asian markets — signal subdued regional demand and can serve as a contrarian entry indicator for attentive global investors. When major exchanges in Asia trade below the global spot price, it often reflects localized regulatory uncertainty or capital outflow pressure. For DCA practitioners operating across multiple platforms, monitoring these cross-exchange spreads on aggregators like CoinGlass provides an additional informational edge when deciding where to execute their recurring purchases.
Exchange Selection Checklist for Long-Term Investors
- Fee structure: Compare base maker/taker rates, volume discounts, and token-based fee reductions against your expected weekly or monthly trade frequency.
- Security track record: Verify proof-of-reserves audits, insurance fund size, and historical incident response — the $1.4 billion Bybit hack in 2025 underscores that no platform is immune.
- Asset coverage: Ensure the exchange lists all tokens in your target portfolio, including staking-eligible assets like ETH, SOL, and DOT.
- Regulatory compliance: Prioritize exchanges licensed in your jurisdiction — Coinbase holds U.S. state licenses, Kraken is registered with FinCEN, and Binance operates under varying regional frameworks.
- Withdrawal fees: On-chain withdrawal costs vary significantly between platforms and can negate trading fee savings, particularly for frequent transfers to self-custody wallets.
Hardware Wallet Comparison: Ledger vs. Trezor — A Self-Custody Security Guide
What happens to your crypto when the exchange holding it collapses overnight? The answer — demonstrated by FTX's $8 billion customer fund misappropriation in 2022 and the record-breaking $1.4 billion Bybit hack in February 2025 — is that you lose everything. Self-custody, the practice of holding your own private keys through hardware wallets, eliminates this counterparty risk entirely. The two dominant hardware wallet manufacturers, Ledger and Trezor, offer fundamentally different approaches to security architecture: Ledger devices support over 5,500 cryptocurrencies using a proprietary secure element chip, while Trezor covers approximately 1,500 assets with a fully open-source firmware model, according to comparative analysis by Coin Bureau. With the total crypto market capitalization sitting at $2.65 trillion as of March 2026, the stakes of custodial negligence have never been higher. Choosing between these platforms requires understanding their distinct security trade-offs, incident histories, and operational philosophies.
Ledger vs. Trezor: Feature-by-Feature Comparison
| Feature | Ledger | Trezor |
|---|---|---|
| Supported Cryptocurrencies | 5,500+ | ~1,500 |
| Secure Element Chip | Yes (CC EAL5+ certified) | No |
| Open-Source Firmware | Partial (app layer only) | Fully open-source |
| Bluetooth Connectivity | Yes (Nano X, Stax, Flex) | No |
| Touchscreen Models | Stax, Flex | Model T, Safe 5 |
| Price Range | $79 – $399 | $69 – $219 |
| Companion Software | Ledger Live | Trezor Suite |
Ledger's primary advantage is breadth: supporting over 5,500 coins makes it the default choice for diversified portfolios spanning DeFi tokens, Layer-2 assets, and niche altcoins. Trezor's fully open-source codebase, however, appeals to security purists who demand complete code auditability — every line of firmware can be independently verified by the community. Neither device stores private keys on internet-connected servers; all transaction signing occurs on the physical device itself, making both fundamentally resistant to remote attack vectors that plague exchange-held funds.
Security Incident History: What Every Buyer Must Know
No security product should be evaluated without confronting its failures. In December 2023, Ledger's Connect Kit library — a JavaScript component used by third-party DApps including SushiSwap, Zapper, and Phantom — was compromised through a phishing attack targeting a former employee. Approximately $500,000 was stolen before Ledger deployed a fix within 40 minutes. Critically, funds stored on Ledger hardware devices themselves were never at risk — the exploit targeted browser-based DApp interactions, not the device's secure element chip.
More damaging to long-term user trust was Ledger's July 2020 data breach, in which over 1 million customer email addresses, physical mailing addresses, and phone numbers were exposed. While no funds were directly compromised, the breach subjected affected users to highly targeted phishing campaigns for years afterward — a stark reminder that operational security extends well beyond the device itself. Trezor has avoided data breaches of comparable scale, and its fully open-source model means vulnerabilities, when discovered, are publicly documented and rapidly patched by the broader developer community.
Why Self-Custody Exists: The Exchange Hack Timeline
The case for self-custody is written in the catastrophic history of exchange failures. In 2014, Mt. Gox lost approximately 850,000 BTC — then valued at $473 million and representing 7% of all Bitcoin in circulation — in what remains one of crypto's most devastating disasters, according to documented records. Bitcoin's price subsequently collapsed from $828 to $440. FTX's 2022 implosion revealed $8 billion in misappropriated customer funds, wiping out retail and institutional investors alike. Then in February 2025, the Bybit hack set a new all-time record at $1.4 billion stolen, as documented by Crystal Intelligence. The foundational crypto principle — "Not your keys, not your coins" — is not ideological rhetoric. It is a risk management imperative validated by billions of dollars in verifiable losses across every market cycle since Bitcoin's inception.
Getting Started: Three Steps to Self-Custody
Transitioning from exchange custody to self-custody does not require technical expertise. For investors implementing a long-term crypto investment strategy, the following three-step process provides a secure foundation:
- Choose your wallet: Select Ledger for maximum asset coverage (5,500+ coins) or Trezor for full open-source transparency. Purchase exclusively from the manufacturer's official website — never from third-party resellers or marketplaces where devices may have been physically tampered with.
- Secure your seed phrase: During initial setup, your device generates a 24-word recovery phrase that serves as the master key to all your assets. Write it on the included backup card — or better yet, stamp it onto a stainless steel plate — and store it in a fireproof, waterproof location physically separate from the device. Never photograph, screenshot, or digitally store your seed phrase under any circumstances.
- Execute a test transaction: Before transferring your full portfolio, send a small amount — $10 in BTC or ETH — to your new hardware wallet address. Verify receipt on a block explorer such as Etherscan or Mempool. Then practice a full recovery by restoring your wallet from the seed phrase on the same device after a factory reset. Only after confirming both send and recovery functionality should you migrate larger holdings from your exchange accounts.
Self-custody is the single most impactful security decision a long-term crypto investor can make. In a market where exchange failures are not hypothetical risks but historical certainties, holding your own keys transforms portfolio protection from a hope into a guarantee.
Integrated Long-Term Portfolio Design: Combining DCA, Staking, and Self-Custody
Building a resilient crypto portfolio requires more than simply buying and holding—it demands a systematic three-phase approach integrating dollar-cost averaging, staking yield generation, and self-custody security. According to The Block, Strategy (formerly MicroStrategy) has accumulated 738,731 BTC worth approximately $56 billion through disciplined quarterly DCA purchases, now controlling over 3.4% of Bitcoin's total supply. This institutional-grade methodology can be adapted for individual investors at any scale. The integrated framework follows a clear pipeline: systematic exchange purchases via DCA, immediate deployment of eligible assets into staking protocols for passive yield, and periodic transfer to hardware wallets for maximum security. Data from dcabtc.com confirms that a simple $10 weekly Bitcoin DCA from 2019 to 2024 turned $2,610 into $7,913—a 202% return that crushed both gold (34.47%) and the Dow Jones (23.43%) over the same period.
The Three-Step Integration Flow
The optimal long-term strategy operates as a continuous cycle. Step one: execute scheduled DCA purchases on a major exchange like Binance or Coinbase, ideally on Mondays—backtesting from 2018 to 2025 reveals Monday purchases accumulate 14.36% more Bitcoin than other weekdays. Step two: deploy staking-eligible assets immediately. ETH, SOL, and DOT can generate 3–8% APY while remaining part of your active portfolio. Step three: once staking positions reach a meaningful threshold, transfer non-staked assets to a hardware wallet like Ledger (supporting 5,500+ assets) or Trezor (1,500+ assets) for cold storage protection.
Portfolio Allocation by Risk Profile
Conservative portfolios should weight 70% BTC, 20% ETH, and 10% blue-chip altcoins like SOL—prioritizing capital preservation with minimal staking exposure. Balanced investors can target 50% BTC, 30% ETH, and 20% diversified alts, deploying the full ETH and SOL allocation into staking protocols. Aggressive portfolios might shift to 40% BTC, 30% ETH, and 30% high-conviction altcoins, maximizing staking yields across multiple chains. For monthly DCA allocations, a practical framework dedicates 60% of each purchase to immediate cold storage (BTC), 30% to staking positions (ETH/SOL), and 10% to opportunistic altcoin accumulation during fear-driven dips.
Rebalancing, Tax Efficiency, and the Strategy Blueprint
Raoul Pal, CEO of Real Vision and former Goldman Sachs executive, reinforces the power of disciplined accumulation: "Bitcoin is the best-performing asset in all history... Just buy Bitcoin and use DCA (cost averaging) strategy," as reported by U.Today. Rebalancing quarterly keeps allocations aligned—when any asset deviates more than 10% from its target, trim winners and reinforce underweight positions. However, each rebalancing event may trigger taxable obligations in jurisdictions including the U.S. and EU nations operating under MiCA regulatory frameworks. Transaction fee differences compound dramatically over time: a 0.5% fee differential across 52 weekly trades can erode over 26% of returns across a decade. Strategy's real-world results validate the model at institutional scale—their average acquisition cost of $75,862 per BTC through consistent quarterly purchases demonstrates that systematic DCA, paired with secure self-custody, remains the most battle-tested path to long-term crypto wealth accumulation.
Second Half 2026 Outlook: Critical Variables Long-Term Investors Must Watch
With Bitcoin trading at $75,661 and the total crypto market cap at $2.65 trillion as of March 2026, the second half of the year presents a pivotal inflection point for long-term investors navigating an increasingly complex landscape. BTC dominance stands at 56.9% according to CoinGlass data, while the Fear and Greed Index registers just 28—deep in "Fear" territory. Historically, this combination of elevated Bitcoin dominance and extreme market fear has preceded significant capital rotations and outsized buying opportunities. The 2024 halving cycle is now producing markedly different results than its predecessors, with post-halving returns of approximately +100% representing the lowest cycle gain on record per Kaiko Research. This deceleration signals a maturing asset class where explosive multipliers are giving way to steadier institutional-grade appreciation, fundamentally reshaping how long-term investors should calibrate return expectations and portfolio strategies for the critical months ahead.
BTC Dominance and the Alt Season Equation
At 56.9%, Bitcoin dominance remains elevated but has not yet breached the 60–65% threshold that historically triggers aggressive capital rotation into altcoins. ETH dominance at just 10.7% suggests the broader altcoin market remains significantly compressed. With ETH surging 8.02% in 24 hours to $2,361 and SOL gaining 3.94% to $96, early signs of rotational capital flow are emerging across major exchanges. Long-term DCA practitioners should evaluate whether to maintain BTC-heavy allocations or begin gradually increasing ETH and alt exposure ahead of a potential dominance reversal in the second half of 2026.
Dollar Liquidity: The Path to $200K
BitMEX co-founder Arthur Hayes has identified dollar liquidity expansion as the single most decisive variable for Bitcoin reaching $200,000 in 2026, as noted by Spoted Crypto. The correlation between global M2 money supply and Bitcoin price has strengthened each successive cycle. Diminishing halving returns reinforce this liquidity dependency: post-halving gains dropped from +7,000% (2012) to +291% (2016) to +541% (2020) to just ~+100% (2024), according to ARK Invest analysis. Each cycle delivers smaller multiples as the asset class matures and requires ever-larger liquidity injections to sustain comparable price appreciation.
Ethereum Staking Evolution and the Fear Signal
Ethereum's staking ecosystem stands at a critical turning point. Co-founder Vitalik Buterin has publicly advocated for simplifying staking infrastructure toward one-click solutions, a shift that could dramatically increase participation rates and strengthen ETH's yield proposition for long-term holders. Meanwhile, the Fear and Greed Index at 28 carries powerful historical significance—blockchain analytics firm Santiment observed in February 2026 that periods of peak crowd negativity have consistently preceded strong recovery rallies across multiple market cycles. Current derivatives data supports a constructive setup: BTC funding rates sit at a neutral 0.0002% and ETH at 0.0052% on Binance, indicating the market is not overleveraged—a healthy foundation for sustainable upside in the months ahead.
Frequently Asked Questions
What kind of returns can you expect from crypto dollar-cost averaging (DCA)?
Historical backtests reveal that a disciplined Bitcoin DCA strategy can dramatically outperform both traditional assets and even lump-sum crypto investing. According to dcabtc.com, a simple weekly $10 Bitcoin DCA from 2019 to 2024 turned a total investment of $2,610 into $7,913—a 202.03% return. Over the same period, gold returned just 34.47% and the Dow Jones only 23.43%, making Bitcoin DCA the clear winner among major asset classes. Even more striking, a fear-based contrarian DCA strategy over a 7-year backtest (2018–2025) delivered a staggering 1,145% return, outperforming a simple buy-and-hold approach (1,046%) by 99 percentage points, as reported by Spoted Crypto. Timing also matters at the micro level: Monday DCA purchases accumulated 14.36% more Bitcoin than other weekdays over the same period. During the 2022 bear market, DCA investors achieved an average cost basis of $35,000 per BTC versus $43,000 for lump-sum buyers—a 33-percentage-point advantage that underscores why systematic DCA investing remains one of the most effective strategies for building long-term crypto wealth.
What is the real yield from cryptocurrency staking after inflation?
Nominal staking APYs can be misleading because they rarely account for token inflation diluting your holdings. Ethereum staking, for instance, advertises yields around 3–4% APY, but after subtracting the network's issuance-driven inflation, real yields settle at roughly 2–3%. Solana's real staking return drops to approximately 0–3% once its higher inflation schedule is factored in, while Polkadot offers a relatively attractive real yield of 3–6% and Cosmos ranges between 2–8% depending on the specific zone and validator commission. Beyond inflation, stakers must also account for slashing risk: on Ethereum, a slashing event triggers an immediate penalty of approximately 1 ETH (1/32 of the effective balance), followed by an extended exit queue penalty of roughly 8,000 GWei per epoch over 36 days, according to Consensys. This means stakers should evaluate net real yield—nominal APY minus inflation minus expected slashing loss—before committing capital, and consider diversifying across multiple validators and chains to mitigate concentration risk.
Ledger vs. Trezor: Which hardware wallet is better for securing crypto?
The choice between Ledger and Trezor ultimately depends on whether you prioritize asset coverage or open-source transparency. Ledger devices support over 5,500 cryptocurrencies and use a proprietary Secure Element chip for key storage, making them ideal for investors with diverse multi-chain portfolios, as noted by Coin Bureau. Trezor, by contrast, supports approximately 1,500 coins but runs fully open-source firmware that has been independently audited by the security community—a significant trust advantage for privacy-conscious users. However, both brands carry security baggage: Ledger suffered a major customer data breach in 2020 that exposed over 1 million email addresses, names, and physical addresses, as documented by Bitdefender, and a 2023 Connect Kit exploit resulted in approximately $500,000 in stolen funds across DApps like SushiSwap and Zapper before a patch was deployed within 40 minutes, per Ledger's official report. In an era where exchange hacks like the $1.4 billion Bybit breach in 2025 remind us that custodial risk is real, either hardware wallet is vastly superior to leaving funds on an exchange. For a deeper comparison, see our crypto security guides on Spoted Crypto.
How much do exchange trading fees cost you over the long term?
Trading fees may seem negligible on any single transaction, but compounding turns small percentage differences into massive long-term wealth erosion. A 0.5% fee differential—for example, Binance's 0.10% maker/taker fee versus Coinbase's 0.60%—compounds to over 26% in cumulative lost returns over a 10-year period when trading weekly (52 transactions per year), according to analysis by Spoted Crypto. To put that in dollar terms: on a $10,000 portfolio, that fee drag could cost you more than $2,600 in foregone gains over a decade—enough to fund an entirely separate DCA position. This effect is especially punishing for active traders and DCA investors who execute frequent, smaller transactions. The lesson is clear: choosing a low-fee exchange is not a minor optimization but a foundational decision that directly impacts your compound growth curve. Investors should compare fee structures across tiers, factor in withdrawal and deposit costs, and consider using exchange-native tokens (like BNB on Binance) for additional fee discounts on crypto trades.
Data Sources
- dcabtc.com — Bitcoin DCA backtesting calculator and historical performance data
- Spoted Crypto — DCA strategy analysis, fee impact modeling, and contrarian investing research
- Coin Bureau — Ledger vs. Trezor hardware wallet comparison
- Consensys — Ethereum staking slashing mechanics and penalties
- Ledger Official Report — 2023 Connect Kit security incident disclosure
- Bitdefender — Ledger 2020 customer data breach reporting
- Crystal Intelligence — Historical crypto exchange hack database
- The Block — Strategy (MicroStrategy) Bitcoin holdings tracker
This article is for informational purposes only and does not constitute investment advice. All investment decisions should be made based on your own judgment and responsibility.
Related Articles
- Kimchi Premium Explained: How It Works, Real Data & Investment Strategies in 2026
- Crypto Fear & Greed Index Guide: How to Read It and Trade Smarter in 2026
- Complete Crypto Investment Strategy Guide 2026: DCA, Staking & Wallet Security Roadmap for Beginners
- Crypto DCA Strategy Guide — 202% Returns Over 5 Years & How to Buy the Fear
- Hardware Wallet vs Exchange: How to Safely Store Crypto in 2026