Fear & Greed Index Hits 8: 46 Days of Extreme Fear — Crypto Market Briefing March 24, 2026
Fear & Greed at 8 for 46 days straight. $336M liquidated, Kimchi premium inverted — yet whales keep buying BTC.
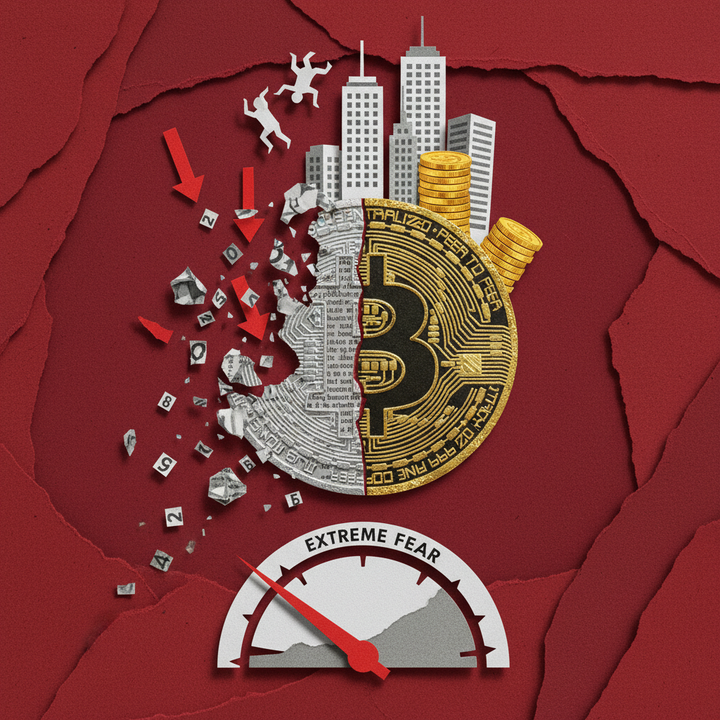
With the Crypto Fear & Greed Index plunging to just 8 out of 100, March 24, 2026 marks the 46th consecutive day of extreme fear — the longest unbroken streak since the post-FTX collapse of late 2022. Total market capitalization holds at $2.50 trillion as Bitcoin reclaims $70,000, yet sentiment remains pinned near historic lows. This briefing dissects the critical data, volume leaders, and structural signals shaping the market as the Asian trading session opens on Tuesday.
Crypto Market Snapshot: What Does a Fear & Greed Index of 8 Mean?
Quick Answer: The Crypto Fear & Greed Index has fallen to 8/100 — marking 46 consecutive days in extreme fear territory, the longest streak since late 2022. Total crypto market cap stands at $2.50 trillion with BTC dominance at 56.6%, while 24-hour liquidations reached $336 million and Bitcoin spot ETFs recorded $129 million in net outflows.
The Crypto Fear & Greed Index is a composite sentiment gauge that blends volatility measurements, market momentum, social media trends, and Bitcoin dominance data into a single 0-to-100 score. As of March 24, 2026, the index has dropped to 8 — deep within extreme fear territory and down 2 points from the prior session, according to Alternative.me. This marks the 46th straight day below 25, the longest sustained fear reading since the FTX collapse shook markets in late 2022. Historical data compiled by Glassnode reveals that entries made when the index dips below 25 have produced an average 30-day return of +18%, vastly outperforming the +2.3% average from purchases during extreme greed above 75. Yet every historical precedent carried its own unique risk profile, and the current macro backdrop — with Brent crude surging past $114 per barrel amid escalating geopolitical tensions — adds a layer of complexity that pure sentiment metrics cannot capture.
Key Market Metrics at a Glance
| Metric | Value | Change / Note |
|---|---|---|
| BTC Price | $70,797 | +3.69% (24h) |
| ETH Price | $2,154 | +4.47% (24h) |
| Total Market Cap | $2.50T | — |
| BTC Dominance | 56.6% | — |
| Fear & Greed Index | 8/100 | -2 vs. prior day |
| 24h Liquidations | $336M | ~$100M in BTC longs |
| BTC Spot ETF Flow | -$129M | Ended 7-day inflow streak |
| Regional Premium (KR) | -2.15% | Discount vs. Binance |
The 46-day extreme fear streak demands historical context. During the COVID crash of March 2020, the index hit 8 when Bitcoin was trading near $4,900 — six months later, BTC had rallied 133% to $11,400. The Luna/3AC collapse of June 2022 pushed the reading to 6 with BTC at $17,600, and while the FTX shock delayed recovery, the ultimate bottom in November 2022 (index at 10, BTC at $15,500) preceded a 96% surge within six months. As Spoted Crypto's Fear & Greed Index guide details, extreme fear phases since 2018 have historically preceded rallies ranging from 150% to 1,400% — though timing remains the elusive variable.
Derivatives markets paint a nuanced picture beneath the headline fear reading. Funding rates on Binance remain near neutral for BTC at 0.0002% and slightly positive for ETH at 0.0061%, suggesting traders are not aggressively leveraged in either direction. However, the liquidation map reveals significant risk clusters: approximately $1.27 billion in short positions face liquidation if BTC breaks above $71,421, while $758 million in longs are at risk below $64,705, according to CoinGlass. The $336 million in 24-hour liquidations — with roughly $100 million in BTC longs wiped out — underscores the volatility that persists despite historically muted sentiment scores.
The Tuesday Asian session opened against the backdrop of a sharp ETF reversal: Bitcoin spot ETFs posted $129 million in net outflows on March 18, abruptly ending a seven-day inflow streak that had accumulated approximately $1.47 billion, according to The Market Periodical. Meanwhile, regional premiums across Asia have turned decidedly negative, with Bitcoin trading at a 2.15% discount on Korean exchanges relative to Binance — a level not seen since the June 2022 capitulation when the discount reached -4.8%. This negative Kimchi premium signals that Asian retail investors remain firmly on the sidelines, a pattern that historically aligns with the final stages of fear-driven capitulation cycles.
Top Volume Coins and 24-Hour Price Action Breakdown
Exchange volume data provides a real-time window into where capital is flowing during periods of extreme market stress, revealing both defensive repositioning and opportunistic speculation. On March 24, 2026, Binance — the world's largest cryptocurrency exchange by volume — recorded over $3.3 billion in combined spot trading volume across its top two pairs alone, with Bitcoin generating $1.99 billion and Ethereum contributing $1.31 billion, according to Binance market data. Notably, ETH outpaced BTC on a percentage-gain basis with a 4.47% surge versus Bitcoin's 3.69%, suggesting that risk appetite is cautiously returning to large-cap altcoins even as the Fear & Greed Index sits at single digits. Meanwhile, SOL posted a 5.56% gain to $92, and micro-cap token NIGHT surged 12.10%, demonstrating that speculative pockets of activity persist even in the deepest fear environments. The volume distribution reveals a market bifurcating between safe-haven positioning and selective dip-buying across the risk curve.
Binance Volume Leaders — March 24, 2026
| Rank | Symbol | Price (USD) | 24h Change | 24h Volume | 24h High | 24h Low |
|---|---|---|---|---|---|---|
| 1 | BTC | $70,797 | +3.69% | $1.99B | $71,817 | $67,445 |
| 2 | ETH | $2,154 | +4.47% | $1.31B | $2,199 | $2,023 |
| 3 | SOL | $92.00 | +5.56% | — | — | — |
| 4 | NIGHT | $0.05 | +12.10% | — | — | — |
| 5 | USDC | $1.00 | +0.02% | — | — | — |
Ethereum's dominance in percentage gains is particularly significant given the current sentiment environment. The 4.47% rally pushed ETH from a 24-hour low of $2,023 to a high of $2,199 — a $176 trading range that attracted both spot buyers and derivatives traders. Funding rates for ETH on Binance sit at 0.0061%, positive but far from overheated, indicating measured long positioning rather than speculative frenzy. The ETH/BTC ratio has been under sustained pressure throughout 2026, and today's relative outperformance could signal early rotation into altcoins as contrarian traders begin treating the extreme fear reading as an entry signal. For a deeper analysis of which assets historically benefit most from fear-driven recoveries, see Spoted Crypto's top coins to buy during extreme fear.
Small-Cap Movers and Speculative Rotation
Beyond the large caps, NIGHT's 12.10% surge to $0.05 stands out as the session's leading micro-cap mover on Binance. While volume data for smaller tokens is inherently less reliable as a directional signal, sharp moves during extreme fear environments often reflect concentrated whale activity or localized short squeezes rather than broad-based retail participation. SOL's 5.56% gain to $92 carries more structural weight, as Solana has maintained elevated network activity and DeFi total value locked throughout the downturn, according to DefiLlama. The pattern mirrors prior capitulation recoveries where layer-1 tokens with strong on-chain fundamentals led the early rebound before momentum spread to mid- and small-cap assets.
Stablecoin Flows and Risk-Off Signals
USDC's virtually flat price action (+0.02%) masks significant underlying volume as traders rotate into dollar-denominated stability. During fear cycles, stablecoin trading volume typically surges as participants exit volatile positions and park capital on the sidelines. Bryan Tan, Analyst at Wintermute, noted that "investors are better off holding dry powder while prices swing wildly on headlines" — a stance that aligns with current stablecoin flow dynamics. The broader risk-off thesis is reinforced by Brent crude's breach of $114 per barrel, which has amplified macro uncertainty and driven correlations between crypto and traditional risk assets higher. With BTC's 20-week correlation to the S&P 500 turning positive at 0.13, digital assets remain vulnerable to cross-market contagion from equities and commodities alike.
The Asian trading session on Tuesday revealed distinct behavioral patterns across regional time zones. Volume concentration during the KST 08:00–10:00 window showed elevated spot buying in BTC and ETH, consistent with dip-buying behavior observed during prior extreme fear phases. However, persistent negative regional premiums tell a more cautious story: BTC trading at a 2.15% and ETH at a 2.19% discount on Korean exchanges versus global Binance pricing suggests that regional retail conviction remains subdued. Clara Wu, Head of Research at Kaiko, observed that "regional premiums are a real-time referendum on local retail conviction," adding that "sustained negative premiums in historically bullish markets signal the retail capitulation cycle hasn't bottomed yet." Until these premiums flip positive, the recovery thesis for Asia-driven volume remains on hold.
Regional Premium Reversal at -2.15%: Is Asia's Retail Capitulation a Bottom Signal?
The regional crypto premium — the price differential between local exchanges and global benchmarks like Binance — has turned sharply negative across key Asian markets, with the widely tracked Kimchi premium dropping to -2.15% for BTC and -2.19% for ETH as of March 24, 2026. This metric, which measures the spread between Korean exchange prices and Binance spot rates, historically serves as a powerful barometer for retail sentiment across Asia's most active trading corridors. According to Spoted Crypto's Kimchi Premium tracker, the current discount represents a dramatic reversal from the +54.5% peak recorded during the 2017 bull market mania. Similar negative premiums have emerged across Indian and Southeast Asian platforms, pointing to broad regional retail disengagement. When paired with a Fear & Greed Index reading of just 8/100 — marking 46 consecutive days of extreme fear — the data strongly suggests a capitulation phase may be unfolding across Asia's retail investor base.
Historical Premium Cycles and Market Bottoms
Negative regional premiums carry a compelling track record as contrarian indicators. The deepest recorded Kimchi discount of -4.8% occurred in June 2022, coinciding with the Luna/3AC collapse when BTC traded near $17,600 — a level that ultimately marked a generational bottom. Similarly, a milder -1.3% discount in January 2024 preceded the Bitcoin spot ETF approval rally that sent prices above $50,000. The pattern repeats across multiple cycles: extreme positive premiums mark euphoric tops, while negative premiums align with periods of maximum pain.
| Period | Regional Premium (BTC) | BTC Price | 6-Month Outcome |
|---|---|---|---|
| Dec 2017 (Peak Mania) | +54.5% | $19,800 | -84% crash to $3,200 |
| Jun 2022 (Luna/3AC) | -4.8% | $17,600 | Bottom confirmed; +96% by May 2023 |
| Jan 2024 (Pre-ETF) | -1.3% | ~$42,000 | ETF rally above $50,000 |
| Mar 2026 (Current) | -2.15% | $70,797 | TBD |
Critically, the current -2.15% reading sits above the -4.8% June 2022 extreme, according to data compiled by The Block. Historical precedent suggests the full capitulation cycle may not yet be complete — but the trajectory is unmistakably moving in the direction that has previously preceded major recoveries.
Three Forces Driving the Asian Discount
A trio of structural forces is converging to push Asian regional premiums into negative territory. First, regulatory uncertainty across the continent — from South Korea's tightening exchange requirements to India's 30% crypto tax regime and Japan's evolving licensing framework under its revised Payment Services Act — has created a chilling effect on retail participation. Second, retail investors across these markets have turned net sellers, contributing to sustained capital outflows from regional exchanges toward offshore platforms offering deeper liquidity and fewer restrictions. Third, surging Brent crude past $114 per barrel, driven by escalating Iran-U.S. tensions, has amplified risk aversion in retail-heavy Asian markets already stretched thin by macroeconomic uncertainty.
Clara Wu, Head of Research at Kaiko, framed the situation in stark terms: "Regional premiums are a real-time referendum on local retail conviction. When you see sustained negative premiums in historically bullish markets like Korea and India, it tells you the retail capitulation cycle hasn't bottomed yet."
Marcus Thielen, Head of Research at 10x Research, offered a structural diagnosis: "Negative premiums in Asia aren't just a sentiment signal — they're a structural symptom of regulatory fragmentation. When you combine BTC dominance at 56.8% with extreme fear readings, capital naturally flows toward the deepest, least-restricted liquidity pools, which are predominantly offshore."
What Regional Premium Data Means for Global Investors
For global market participants, the Asian premium reversal adds another data point to the mounting body of capitulation evidence. With BTC dominance at 56.6% and ETH trading at a regional -2.19% discount, capital rotation into Bitcoin as a perceived safe haven within the crypto ecosystem continues unabated. Investors monitoring extreme fear buying opportunities should watch for the premium to approach or exceed the -4.8% June 2022 trough — historically, such extremes have preceded the most explosive recoveries. According to Glassnode data, buying during Fear & Greed readings below 25 has produced an average 30-day return of +18%, compared to a mere +2.3% at readings above 75. Until the premium bottoms out, however, Asia's retail base — responsible for a significant share of global crypto volume — remains in active de-risking mode, and patience is the highest-conviction trade.
$336M Liquidated in 24 Hours: Mapping the Long and Short Liquidation Walls
A total of $336 million in leveraged positions were liquidated across crypto derivatives markets in the past 24 hours, with Bitcoin long positions accounting for approximately $100 million of the carnage, according to Coinglass data. The liquidation cascade unfolded as BTC whipsawed between a 24-hour low of $67,445 and a high of $71,817 on Binance — a $4,372 range that caught overleveraged traders on both sides of the trade. This level of forced selling, concentrated predominantly on long positions, underscores the fragility of leveraged conviction at current price levels. What makes the current derivatives landscape particularly noteworthy is the stark asymmetry in liquidation walls above and below the current price of $70,797. A breakout above $71,421 would trigger an estimated $1.27 billion in short liquidations, while a breakdown below $64,705 would wipe out $758 million in longs — creating a 1.67:1 ratio that heavily favors an upside squeeze if momentum turns.
Asymmetric Liquidation Structure Above and Below BTC
The derivatives market is currently loaded with a significant concentration of short positions vulnerable just above the current price, while long exposure thins out at a much lower threshold. This lopsided structure creates a landscape where the path of least resistance — and maximum liquidation impact — tilts upward.
| Scenario | Price Trigger | Est. Liquidation Volume | Direction | Distance from Current |
|---|---|---|---|---|
| Short Squeeze Zone | Above $71,421 | $1.27B | Shorts liquidated | +0.88% |
| Long Cascade Zone | Below $64,705 | $758M | Longs liquidated | -8.60% |
| 24h Realized Liquidations | $67,445 – $71,817 range | $336M total (~$100M BTC longs) | Mixed | Realized |
A sustained move above $71,421 — less than 1% from the current spot price — could trigger a cascading short squeeze worth nearly $1.3 billion, potentially propelling BTC toward the $73,000–$75,000 range in rapid succession. Conversely, bears would need to push prices 8.6% lower to $64,705 to trigger equivalent long-side damage, suggesting that downside momentum must be substantially stronger to create a comparable liquidation event. For traders, this asymmetry represents a compressed spring favoring upside volatility — but only if a catalyst can push BTC beyond that narrow $71,421 threshold.
Funding Rates Signal Fading Long Conviction
Binance perpetual funding rates paint a picture of rapidly diminishing directional conviction. BTC funding has declined to a near-neutral 0.0002%, a sharp drop from the 0.0071% readings seen earlier this month, according to Coinglass — a clear indication that long-side dominance is evaporating. ETH funding at 0.0061% and SOL at 0.0050% retain marginally bullish positioning, while XRP (-0.0046%) and DOGE (-0.0006%) have flipped to net short bias, reflecting fragmented sentiment across the altcoin complex. This broad funding rate compression signals a market in wait-and-see mode, where neither bulls nor bears hold strong enough conviction to pay for directional positioning.
Bryan Tan, Analyst at Wintermute, advised restraint in this headline-driven environment: "Investors are better off holding 'dry powder' while prices swing wildly on headlines."
Macro Crosswinds Amplifying Derivatives Risk
The derivatives landscape is not operating in isolation. Fed rate hike probability has climbed 12.4 percentage points, according to CME FedWatch, adding a hawkish overhang to risk asset positioning across all time frames. Meanwhile, Brent crude oil's breach above $114 per barrel — fueled by escalating Iran-U.S. tensions — is compounding the inflation narrative that has kept the Fear & Greed Index pinned at 8 for over six weeks. Historically, as tracked by Spoted Crypto's extreme fear analysis, liquidation cascades of this magnitude during extreme fear periods have marked pivotal inflection points. For leveraged traders, the convergence of compressed funding rates, massive asymmetric liquidation walls, and macro headwinds creates a powder keg: the next decisive move — in either direction — could generate outsized, violent volatility that punishes the underprepared.
Today's Top 3 Headlines: Strategy's $42B Bitcoin Bet, BlackRock's Tokenization Push, and the USR Hack
The crypto market on March 24, 2026, is defined by three headline-grabbing developments spanning institutional accumulation, Wall Street adoption, and DeFi security failure. Strategy (formerly MicroStrategy) announced a massive $42 billion capital-raising program to fund further Bitcoin purchases, reinforcing its position as the largest corporate BTC holder with 762,099 coins. BlackRock CEO Larry Fink used his annual shareholder letter to outline a sweeping tokenization vision, with the firm's BUIDL fund now managing $2.5 billion in assets. Meanwhile, Resolv Labs suffered a devastating exploit that saw 80 million USR stablecoins minted without backing, resulting in approximately $24 million in losses and an 86% price collapse. These three stories encapsulate the competing forces shaping crypto in 2026: aggressive institutional conviction, legacy finance integration, and persistent smart contract vulnerabilities that continue to erode trust in decentralized protocols.
Strategy Doubles Down: $42 Billion Capital Raise for Bitcoin
Strategy has unveiled its most ambitious capital-raising program yet, targeting $42 billion in fresh funding split across $21 billion in common stock and $21 billion in STRC preferred shares, with an additional $2.1 billion via STRK instruments. According to CoinDesk, the firm purchased 1,031 BTC last week at an average price of $74,326, bringing its total holdings to 762,099 BTC — worth over $53.9 billion at current prices.
The scale of this program is unprecedented in corporate Bitcoin strategy. At $42 billion, Strategy's planned raise exceeds the entire market capitalization of most mid-cap S&P 500 companies. The move signals that executive chairman Michael Saylor remains unfazed by the 46-day extreme fear cycle, treating the current drawdown as a generational accumulation window. For markets already grappling with thin liquidity, Strategy's sustained buying pressure could establish a meaningful price floor beneath Bitcoin — or amplify volatility if the equity raise encounters resistance from investors wary of concentrated crypto exposure during a prolonged fear regime.
BlackRock's Larry Fink: Tokenization Is "the Next Internet"
BlackRock CEO Larry Fink devoted a significant portion of his 2026 annual shareholder letter to digital assets, framing tokenization as a force comparable to the internet's impact on communication. According to CoinDesk, the world's largest asset manager now oversees $2.5 billion in its BUIDL tokenized fund, manages $65 billion in stablecoin reserve assets, and administers $80 billion in digital asset exchange-traded products globally.
Fink's public endorsement carries outsized weight — BlackRock manages over $11 trillion in total assets. His letter also advocated for regulatory clarity around stablecoins, aligning with the bipartisan CLARITY Act compromise reached by Senators Tillis and Alsobrooks. The proposed legislation prohibits simple yield on stablecoin holdings but permits activity-based rewards, and is expected to reach Senate Banking Committee markup by late April, according to CoinDesk. If enacted, CLARITY would create the first comprehensive U.S. federal framework for stablecoin issuance, potentially unlocking trillions in institutional capital currently sidelined by regulatory uncertainty. Combined with the EU's MiCA framework already operational, 2026 could mark the year stablecoin regulation achieves critical global coherence.
Resolv Labs USR Hack: $24M Stolen, DeFi Security Crisis Deepens
A critical exploit struck Resolv Labs' USR stablecoin protocol, allowing an attacker to mint 80 million USR tokens without any collateral backing. According to The Block, the hacker extracted approximately 11,400 ETH (worth ~$24 million) before the team could intervene. USR's price collapsed 86% to $0.14 before partially recovering to around $0.42 — still well below its intended $1 peg.
The USR incident pushes cumulative DeFi hack losses in 2026 to $137 million, according to FameEX. This pattern underscores a persistent paradox: while institutions pour billions into tokenized assets and Bitcoin ETFs, the DeFi ecosystem continues to hemorrhage user funds through preventable smart contract vulnerabilities. For investors navigating extreme fear conditions in March 2026, the USR hack serves as a stark reminder that protocol risk remains the single largest unpriced variable in decentralized finance.
Whale and Institutional Activity: Who's Buying During Extreme Fear?
Whale and institutional accumulation patterns during prolonged periods of extreme fear often signal major market inflection points — and the current data is flashing one of the strongest institutional buying signals in over a decade. On-chain data reveals that a single entity executed a 12,500 BTC over-the-counter block trade worth approximately $925 million, with the same wallet cluster accumulating over 38,000 BTC since January 2026, according to CoinReporter. Large whale addresses have collectively added 270,000 BTC over the past 30 days, marking the highest monthly accumulation rate since 2013. This aggressive buying stands in stark contrast to the Fear and Greed Index reading of 8 — its 46th consecutive day in extreme fear territory. Bitcoin spot ETFs, after recording seven straight days of net inflows, posted a $129 million outflow on March 18, though cumulative Q1 net inflows still total $18.7 billion. The divergence between retail panic selling and institutional accumulation creates a classic contrarian setup that has historically preceded significant price recoveries.
Institutional and Whale Accumulation Snapshot: March 2026
| Metric | Value | Context |
|---|---|---|
| OTC Block Trade | 12,500 BTC (~$925M) | Sovereign wealth fund or major institution suspected |
| Same Cluster Accumulation (Jan–Mar 2026) | 38,000+ BTC | Consistent buying across 3 months |
| Large Whale 30-Day Accumulation | +270,000 BTC | Highest monthly rate since 2013 |
| BTC ETF Q1 2026 Net Inflows | $18.7B | Lifetime cumulative inflows surpass $65B |
| BTC ETF Latest Daily Flow | −$129M | Ended 7-day inflow streak on Mar 18 |
| Fear & Greed Index | 8/100 | 46 consecutive days in extreme fear |
The Smart Money Divergence: Retail Capitulation vs. Institutional Conviction
The data paints a clear picture of bifurcation. Retail investors, battered by 46 days of extreme fear and a BTC drawdown from cycle highs, are capitulating — funding rates on Coinglass show BTC perpetual funding at a near-neutral 0.0002% on Binance, indicating exhausted directional conviction among leveraged traders. XRP and DOGE funding rates have flipped negative at −0.0046% and −0.0006% respectively, confirming short-side pressure dominates altcoin sentiment.
Meanwhile, whales are executing the opposite playbook. The 270,000 BTC accumulated in 30 days dwarfs even the aggressive accumulation seen during the 2022 post-FTX bottom, when whale addresses added roughly 150,000 BTC over a comparable period. The $925 million OTC block trade — deliberately routed off-exchange to minimize market impact — suggests the buyer is a sovereign wealth fund or pension allocator operating with a multi-year time horizon, not a speculative fund trading quarterly cycles.
The ETF flow picture adds nuance. While the $129 million outflow on March 18 ended a seven-day inflow streak, the broader trend remains decisively bullish: $18.7 billion in net Q1 inflows and over $65 billion since launch, according to The Market Periodical. History favors the patient: Glassnode data shows that buying when the Fear and Greed Index falls below 25 has produced an average 30-day return of +18%, compared to just +2.3% when buying above 75. With the index pinned at 8, the risk-reward calculus increasingly favors those with the capital and conviction to accumulate against the crowd.
Historical Comparison: What Happened After Single-Digit Fear & Greed Readings?
Single-digit readings on the Crypto Fear & Greed Index represent some of the rarest and most consequential signals in digital asset markets. Since the index's inception in 2018, readings below 10 have occurred during only three distinct periods — March 2020 amid the COVID-19 liquidity crisis, June 2022 following the Terra/Luna and Three Arrows Capital collapse, and now March 2026 with the index sitting at 8 for the 46th consecutive day in extreme fear territory. Historical data compiled by Glassnode reveals a striking asymmetry: investors who purchased Bitcoin when the index read 25 or below achieved an average 30-day return of +18%, compared to just +2.3% for those who entered positions above 75 during extreme greed. This pattern suggests that the moments of maximum psychological discomfort have consistently preceded the strongest recoveries — though the path from capitulation to rally has never been linear, and timing remains the critical variable separating profit from further drawdown.
Extreme Fear Episodes: A Performance Scorecard
| Period | Fear & Greed Reading | BTC Price at Signal | 6-Month Return | Key Catalyst |
|---|---|---|---|---|
| March 2020 | 8 | $4,900 | +133% | COVID crash → Fed QE infinity |
| June 2022 | 6 | $17,600 | -4.5%* | Luna / Three Arrows Capital collapse |
| November 2022 | 10 | $15,500 | +96% | FTX bottom → recovery cycle begins |
| March 2026 | 8 | $70,797 | TBD | Macro headwinds + 46-day fear streak |
*June 2022's initial reading led to a secondary collapse — the FTX implosion pushed BTC to $15,500 by November before the +96% recovery began. Sources: Glassnode, CoinGlass
The March 2020 episode offers the cleanest parallel to today's reading. Bitcoin hit a Fear & Greed score of 8 when prices cratered to $4,900 during the pandemic liquidity shock. Within six months, BTC surged 133% to $11,400, powered by unprecedented monetary stimulus and the first wave of institutional adoption. The pattern repeated — albeit with a painful detour — in 2022: June's reading of 6 at $17,600 initially led to further decline as the FTX implosion delivered a devastating secondary shock. But investors who accumulated during that November 2022 bottom at index level 10 captured a 96% gain over the following six months, ultimately riding the wave into the 2024 ETF approval rally.
Regional Premiums as Confirmation Signals
Regional exchange premiums have historically served as powerful confirmation tools alongside the Fear & Greed Index. In June 2022, the Kimchi premium — the price differential between Korean exchanges and global platforms like Binance — plunged to -4.8%, signaling deep retail capitulation across Asia's largest retail-driven market. That negative premium preceded a multi-year bullish reversal. Today, with the Kimchi premium at -2.15% and similar discounts appearing on regional exchanges throughout Asia, the structural setup rhymes with previous bottoming patterns. As Clara Wu, Head of Research at Kaiko, recently observed: "When you see sustained negative premiums in historically bullish markets like Korea and India, it tells you the retail capitulation cycle hasn't bottomed yet."
The Contrarian Edge in Numbers
Glassnode on-chain analytics confirm the statistical advantage of contrarian positioning during extreme fear. Over the index's full history, entering at readings of 25 or below has produced an average 30-day return of +18% — nearly eight times the +2.3% average return for purchases made above 75 during extreme greed phases. Rony Szuster, Head of Research at Mercado Bitcoin, distilled the dynamic: "Buying during periods of fear has been more effective than buying during euphoria."
However, today's environment carries unique structural risks. Unlike the 2020 and 2022 episodes that coincided with aggressive central bank pivots, the current cycle confronts persistent macro headwinds — Brent crude above $114 per barrel and no imminent Fed rate cuts on the horizon. The 46-day extreme fear streak exceeds any previous episode on record, signaling either a deeper structural repricing or the coiled setup for an explosive reversal. Historically, sustained extreme fear periods of this magnitude have preceded rallies ranging from 150% to 1,400%, but timing has always been the critical variable that separates conviction from catastrophe. For a deeper analysis of how sentiment indicators inform entry timing, see our comprehensive Fear & Greed Index guide.
Market Outlook: Key Price Levels and Catalyst Events for Q2 2026
Bitcoin's near-term trajectory now hinges on a narrow $6,700 corridor between two massive liquidation walls that could trigger cascading price moves in either direction. According to CoinGlass derivatives data, approximately $1.27 billion in short liquidations are stacked at the $71,421 level — just $625 above the current spot price of $70,797 — while $758 million in long liquidations cluster at $64,705. This asymmetric positioning creates a coiled-spring dynamic where a decisive break in either direction would unleash forced buying or selling that amplifies the initial move by significant multiples. The stakes are further elevated by Bitcoin's shifting correlation with traditional equities: the BTC–S&P 500 20-week correlation coefficient has turned positive at 0.13, a pattern that analyst Tony Severino warns has preceded an average drawdown of approximately 50% since 2018, raising serious questions about whether crypto can decouple from broader risk-off sentiment during this cycle.
April 2026: A Catalyst-Rich Calendar
The next four to six weeks present a convergence of policy, monetary, and corporate catalysts that will likely determine whether the current 46-day extreme fear streak resolves to the upside or deepens into a prolonged bear phase:
- CLARITY Act Senate Markup (Late April): The bipartisan stablecoin legislation advances to the Senate Banking Committee after Senators Tillis (R) and Alsobrooks (D) reached a compromise on yield provisions. According to CoinDesk, the bill would prohibit passive stablecoin interest while permitting activity-based rewards — a regulatory framework that could unlock institutional DeFi participation at scale.
- Federal Reserve Rate Decision: With Brent crude above $114 per barrel fueling persistent inflationary pressures, the probability of near-term rate cuts has diminished substantially. Any hawkish surprise would compound downward pressure on risk assets including Bitcoin and crypto broadly.
- Strategy Capital Deployment Begins: Strategy's newly announced $42 billion capital-raising program — split between $21 billion in common stock and $21 billion in STRC preferred shares — enters its active deployment phase. With 762,099 BTC already on its balance sheet, continued accumulation at these levels could provide sustained institutional bid support beneath the market.
Balancing the Bull and Bear Case
Alex Thorn, Head of Firmwide Research at Galaxy Digital, captured the prevailing institutional uncertainty in his latest assessment: "2026 is too chaotic to predict… risk remains to the downside in the near term." His cautious stance aligns with the structural warning embedded in the equity correlation data — when Bitcoin re-couples with the S&P 500 during periods of macro stress, it has historically followed traditional risk assets lower before establishing independent price discovery.
Yet history offers a compelling counterweight that investors cannot afford to ignore. Every prior extreme fear streak of comparable duration — from 2018's crypto winter through 2022's cascading collapses — ultimately preceded rallies of 150% to 1,400%. The critical difference today is that Bitcoin enters this fear cycle from $70,797 rather than $4,900 or $15,500, meaning the absolute dollar magnitude of any percentage recovery would be unprecedented in market history. For investors weighing these competing dynamics, maintaining what Wintermute analyst Bryan Tan calls "dry powder" while closely monitoring the $71,421 short squeeze trigger and $64,705 support level may prove the most prudent strategy. For more on positioning during high-volatility regimes, explore our top coins to buy during extreme fear analysis.
Frequently Asked Questions
Is a Fear & Greed Index Reading of 8 a Buy Signal?
A Fear & Greed Index score of 8 out of 100 places the market firmly in "extreme fear" territory — a zone that has historically preceded significant recoveries. According to Spoted Crypto research, the index has now spent 46 consecutive days in extreme fear, the longest streak since late 2022. Historical data from Glassnode shows that previous single-digit readings were followed by gains ranging from +96% to +133% within six months — but timing matters enormously. The 2022 cycle, for example, saw an additional 40% drawdown after the index first hit single digits before a true bottom was confirmed months later. Rather than treating any single reading as a definitive entry signal, most analysts recommend a disciplined dollar-cost averaging strategy that spreads purchases across weeks or months, reducing the risk of catching a falling knife while still capitalizing on historically depressed sentiment.
Why Are Regional Exchange Premiums Turning Negative?
The so-called "Kimchi premium" — the price difference between Bitcoin on Korean exchanges and global platforms like Binance — has inverted to approximately −2.15% for BTC and −2.19% for ETH, according to Spoted Crypto's Kimchi Premium tracker. This discount signals that regional retail investors are selling more aggressively than their global counterparts, driven by a combination of local regulatory uncertainty and broader risk-off sentiment. For context, this same premium surged as high as +54.5% during the 2017 bull market frenzy, making the current negative reading a stark reversal of speculative appetite. The last comparable inversion occurred in 2022 when the premium hit −4.8%, which ultimately coincided with a macro bottom within several months. Negative regional premiums often reflect capitulation-stage selling, and while the current −2.15% is less severe than 2022's trough, it serves as a meaningful gauge of retail exhaustion across Asian markets that global traders closely monitor.
What Is the Current State of Bitcoin ETF Fund Flows?
Bitcoin spot ETFs recorded a $129 million net outflow on March 18, snapping a seven-day consecutive inflow streak, as reported by The Market Periodical. Ethereum ETFs mirrored the reversal with $55 million in outflows on the same day. However, the broader context remains overwhelmingly bullish for institutional adoption: the two weeks preceding the outflow saw approximately $1.47 billion in cumulative net inflows, and Q1 2026 alone has attracted an estimated $18.7 billion. Since their launch in January 2024, U.S. spot Bitcoin ETFs have now absorbed over $65 billion in total net inflows — a figure that dwarfs any single-day outflow event. Market strategists widely characterize the March 18 reversal as routine profit-taking rather than a structural shift, particularly given that BlackRock continues to expand its digital asset footprint with $80 billion in digital asset ETP exposure and a $2.5 billion tokenized BUIDL fund.
What Are the Biggest Risks Facing the Crypto Market Right Now?
The current risk landscape is defined by a convergence of macro, regulatory, and security threats that compound one another. Brent crude oil has surged past $114 per barrel amid escalating Iran-U.S. tensions, reigniting inflation concerns and pushing the probability of a Federal Reserve rate hike to 12.4%, per FameEX's market recap — a sharp reversal from the rate-cut expectations that fueled early-2025 optimism. On the security front, cumulative DeFi exploits have already reached $137 million in 2026, punctuated by the Resolv Labs USR stablecoin hack that saw an attacker mint 80 million unbacked tokens and extract roughly $24 million in ETH. Meanwhile, the 24-hour liquidation volume stands at $336 million, with $1.27 billion in short liquidations queued above $71,421 and $758 million in long liquidations below $64,705 — creating a highly volatile liquidation cascade zone. Perhaps most concerning for portfolio managers, Bitcoin's correlation with the S&P 500 has turned positive again — a pattern that has historically preceded average drawdowns of roughly 50% during prior equity bear markets.
Data Sources
- Spoted Crypto — Fear & Greed Index Analysis
- Spoted Crypto — Kimchi Premium Guide 2026
- The Market Periodical — Bitcoin ETF Flow Data
- CoinDesk — BlackRock Tokenization & Digital Asset ETP Data
- FameEX — Crypto Market Recap (March 23, 2026)
- The Block — Resolv Labs USR Stablecoin Exploit
- Glassnode — On-Chain Analytics
- CoinGlass — Liquidation & Derivatives Data
This article is for informational purposes only and does not constitute investment advice. All investment decisions should be made based on your own judgment and responsibility.
Related Articles
- Institutions Buy $3B While 127K Retail Traders Get Liquidated — Market Polarization at Fear Index 8
- Fear & Greed Index Hits 10: 46 Days of Extreme Fear — Week 4 March Crypto Briefing
- Bitcoin Hits $70K Max Pain as Fear Index Drops to 23 — $542M Liquidated
- Bitcoin Drops to $70,900 After FOMC Hold — Fear Index Hits 26
- SEC Declares Most Crypto 'Not Securities' as FOMC Looms — March 18 Market Briefing