Crypto Market Today: Fear & Greed at 14, Bitcoin Rebounds to $66,843 — First Week of March Outlook
Fear & Greed Index hits 14 — the third most extreme fear reading since 2018. Whales accumulate 270,000 BTC ($23B) as Bitcoin rebounds from weekend war-driven crash. ETF inflows reverse. Here's what it all means for March.
The Fear & Greed Index sits at 14 — the third most extreme fear reading since 2018. Yet Bitcoin whales have quietly accumulated 270,000 BTC (roughly $23 billion) over the past month.
Monday, March 2, 2026. The crypto market is attempting to recover from a weekend rattled by U.S.-Iran military confrontation. After Bitcoin plunged below $64,000 on Saturday, it staged a sharp rebound to $66,843 (+5.2%) on Sunday — only to give back those gains as Monday's Asian session opened. As of 08:00 KST, BTC trades at $65,225 on Binance, down 2.86% over the past 24 hours, with most major assets following suit. The Fear & Greed Index has now spent 22 consecutive days below 25 — a streak matched only twice in history. Both previous instances preceded substantial recoveries. Today's briefing unpacks the weekend crash, the historical significance of extreme fear, whale and ETF activity, and what to expect in the first week of March.
Key Market Indicators at a Glance
Quick Answer: As of March 2, 08:00 KST, total crypto market cap stands at $2.33 trillion with BTC dominance at 56.0%. The Fear & Greed Index reads 14 (Extreme Fear), up 3 points from yesterday. Bitcoin trades at $65,225 on Binance after giving back Sunday's rebound. BTC open interest sits at $5.1 billion with longs dominating at 62.6%.
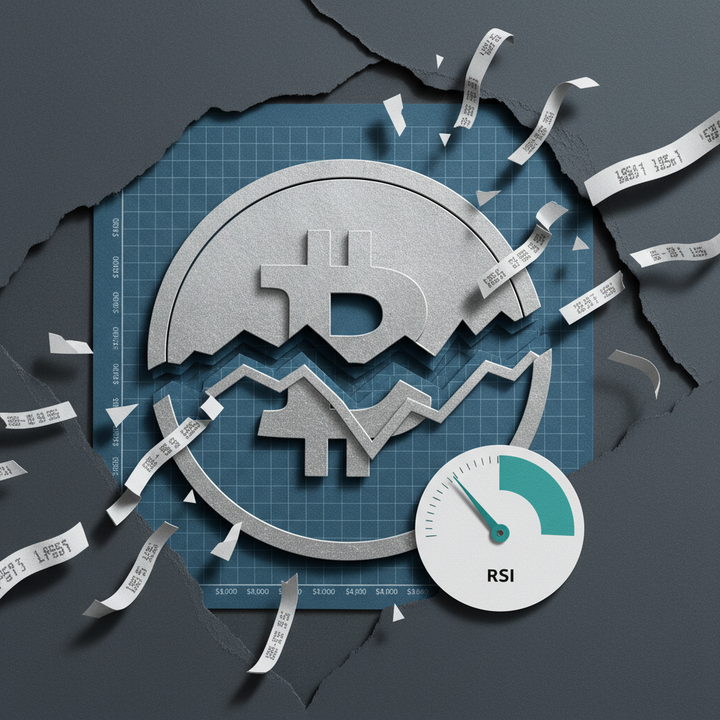
The global cryptocurrency market capitalization stands at $2.33 trillion as of March 2, 2026, 08:00 KST, with Bitcoin dominance at 56.0% and Ethereum dominance at 10.0% — reflecting a clear flight to relative safety within crypto. There are 18,670 active cryptocurrencies, with 24-hour total trading volume at approximately $106.9 billion. The Fear & Greed Index — a composite metric that quantifies market sentiment from 0 (extreme fear) to 100 (extreme greed) using social media activity, trading volume, volatility, dominance, and Google Trends data — reads 14, up 3 points from the prior day but still firmly in "Extreme Fear" territory. Notably, BTC's 14-day RSI has fallen below 30 for only the third time in Bitcoin's history, a technically oversold signal that historically preceded extended consolidation phases followed by sustained recoveries (CoinDesk).
| Indicator | Value | Note |
|---|---|---|
| Total Market Cap | $2.33T | — |
| 24h Total Volume | $106.9B | — |
| BTC Dominance | 56.0% | Flight to safety within crypto |
| ETH Dominance | 10.0% | — |
| Fear & Greed Index | 14/100 | Extreme Fear (+3 vs prior day) |
| BTC 14-Day RSI | Below 30 | 3rd time in history |
| BTC Funding Rate (Binance) | 0.0029% | Slightly long-biased |
| Active Cryptocurrencies | 18,670 | — |
In the derivatives market, funding rates across Binance perpetual futures paint a nuanced picture. BTC funding sits at 0.0029% and ETH at 0.0053%, both marginally positive — indicating a slight long bias has returned after Sunday's bounce. However, XRP (-0.0037%), ADA (-0.0038%), and DOT (-0.0217%) remain negative, with DOT's deeply negative rate signaling heavy short positioning. BTC open interest on Binance stands at $5.1 billion with a 62.6% long / 37.4% short ratio, while ETH open interest totals $3.5 billion at 67.5% long / 32.5% short.
Bitcoin's Weekend Crash and Rebound — What Happened?
Quick Answer: U.S.-Iran military confrontation crashed Bitcoin below $64,000 on Saturday. Sunday's Polymarket ceasefire odds (61% by March 31) fueled a 5.2% rebound to $66,843. Monday's Asian session erased those gains, with BTC settling at $65,225 on Binance.
Bitcoin's weekend crash refers to the sharp sell-off triggered on Saturday, February 28, when news of U.S.-Iran military confrontation sent BTC plunging below $64,000. The drop was amplified by characteristically thin weekend liquidity, where geopolitical risk was exaggerated in price action. However, on Sunday, March 1, Polymarket ceasefire prediction markets showed U.S.-Iran ceasefire probability rising to 61% by end of March and 78% by end of April, sparking a rapid recovery. Bitcoin surged to $66,843 (+5.2%), Ethereum rallied 7.5% to reclaim $2,000 at $1,994, and Solana led the pack with a 10.8% bounce to $86.42 (CoinDesk). But Monday's Asian trading session has brought a reality check.
As of 08:00 KST Monday, Bitcoin has pulled back to $65,225 on Binance (-2.86%), with the 24-hour range spanning $65,056 to $68,200. Ethereum sits at $1,920 (-2.33%), Solana at $82.54 (-2.11%), and XRP at $1.34 (-3.00%). The pattern is consistent across exchanges: OKX shows BTC at $65,210 (-2.63%) and ETH at $1,919 (-2.31%), confirming this is a broad pullback rather than an exchange-specific move.
| Asset | Sunday Peak | Monday Price (Binance) | 24h Change | 7d Change | Funding Rate |
|---|---|---|---|---|---|
| BTC | $66,843 | $65,225 | -2.86% | -1.6% | 0.0029% |
| ETH | $1,994 | $1,920 | -2.33% | +1.1% | 0.0053% |
| SOL | $86.42 | $82.54 | -2.11% | +1.7% | 0.0054% |
| XRP | $1.41 | $1.34 | -3.00% | -2.0% | -0.0037% |
| DOGE | $0.10 | $0.092 | -2.44% | -2.5% | 0.0030% |
A CoinDesk analysis note captured the dynamic well: "Saturday's sell-off happened on thin weekend liquidity. Sunday's rally happened on the same thin liquidity, just in the opposite direction." In other words, both the crash and the rebound were exaggerated price movements — the true directional test arrives as Monday's full Asian and U.S. sessions bring real volume back into the market.
The geopolitical backdrop adds another layer of complexity. Polymarket's U.S.-Iran prediction market saw total volume surpass $529 million, making it one of the largest single contracts in the platform's history (CoinDesk). However, controversy has emerged: Bloomberg reported that six suspicious wallets — most funded within 24 hours of the Iranian strike — netted $1.2 million in profit by betting on the exact date of the attack, raising insider trading concerns (Bloomberg).
Fear & Greed at 14 — What Extreme Fear Has Meant Historically
Quick Answer: The Fear & Greed Index has been below 25 for 22 straight days — only the third time since 2018. The previous two instances (March 2020, June 2022) both preceded 12-month recoveries of +1,500% and +45% respectively. History rhymes, but timing remains the challenge.
The Crypto Fear & Greed Index is a composite sentiment metric that aggregates social media activity, trading volume, market volatility, Bitcoin dominance, and Google Trends data into a single 0-to-100 score. At 14, the index has now spent 22 consecutive days below 25 — a streak that has occurred only twice before since the index launched in 2018. The first was during the March 2020 COVID crash, when the index hit 8 with Bitcoin near $5,000; the second was during the June 2022 FTX collapse era, when it touched 6 with Bitcoin around $20,000. In both cases, 12-month returns from those extreme fear readings were substantial: approximately +1,500% after March 2020, and roughly +45% after June 2022 (SpotEdCrypto).
| Date | Fear & Greed | BTC Price | 12-Month Return |
|---|---|---|---|
| March 2020 | 8 | ~$5,000 | +1,500% |
| June 2022 | 6 | ~$20,000 | +45% |
| March 2026 | 14 | ~$65,200 | TBD |
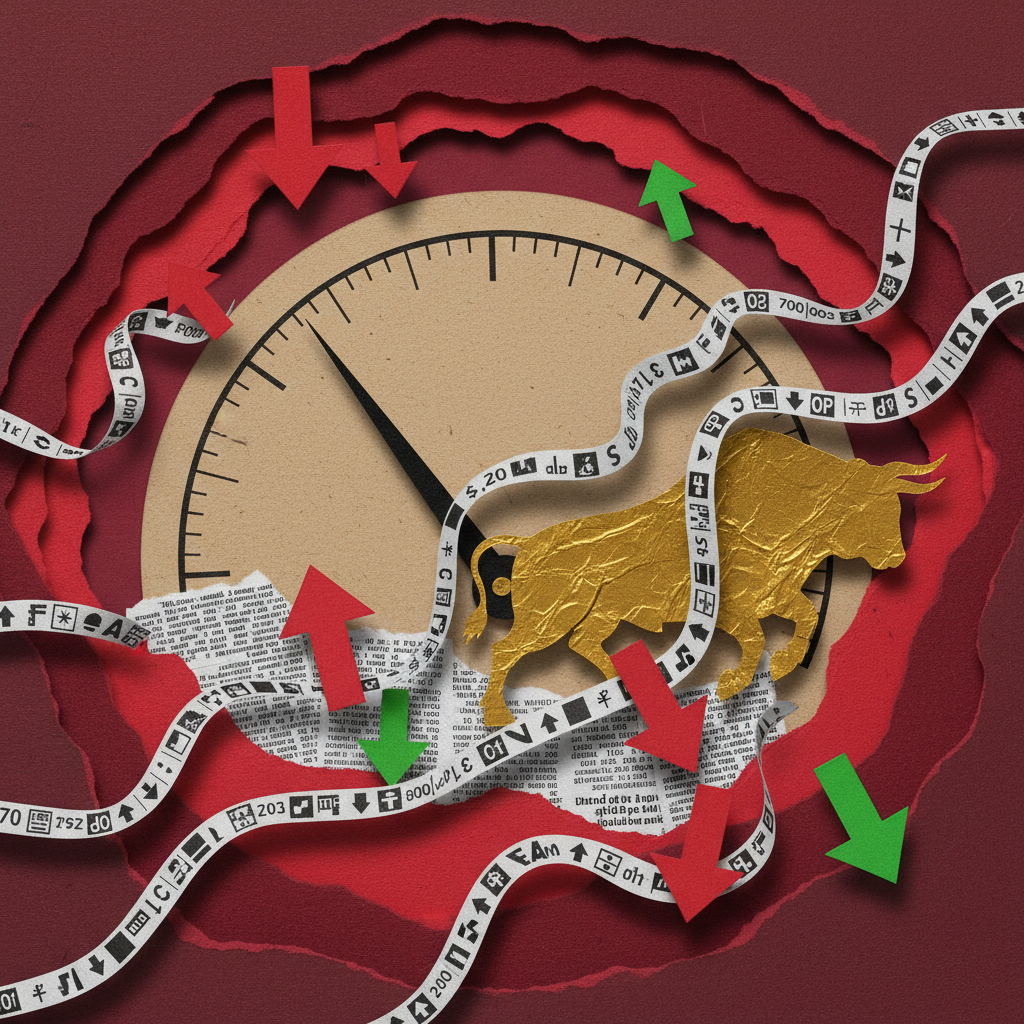
Brian Quinlivan, Marketing Director at Santiment, offered context: "When the Fear and Greed Index enters extreme fear zones, it typically coincides with retail capitulation and institutions accumulating simultaneously." This framing — retail panic meets institutional opportunism — aligns with the on-chain data we'll examine in the whale accumulation section below.
That said, the current drawdown has important differences from prior cycles. Bitcoin peaked near $126,296 in October 2025 and has since fallen roughly 47% to its current level — a significant decline, but less severe than the 77% peak-to-trough drop from $69,000 to $15,500 during 2021-2022. The 14-day RSI falling below 30 for the third time in history reinforces the technical oversold signal. The previous two RSI sub-30 readings occurred in January 2015 (RSI ~28, BTC ~$200) and December 2018 (RSI below 30, BTC ~$3,500) — both preceded months of sideways consolidation before sustained recoveries (CoinDesk).
Carol Alexander, Professor of Finance at the University of Sussex, expects Bitcoin to remain in a "high-volatility range" of $75,000 to $150,000, with a center of gravity near $110,000 (CNBC). Standard Chartered has cut its 2026 Bitcoin price target from $300,000 to $150,000, reflecting a more cautious institutional outlook.
Binance Volume Rankings and Derivatives Deep Dive
Quick Answer: BTC leads Binance spot volume at $1.5 billion, followed by ETH at $1.0 billion. Derivatives show $5.1B in BTC open interest with 62.6% longs. Tokenized gold (PAXG) at $5,424 is the only notable gainer (+0.73%), reflecting a flight to safe-haven assets.
Binance spot volume rankings for March 2, 2026 reveal a market in risk-off mode. Bitcoin dominates with $1.5 billion in 24-hour volume, followed by Ethereum at $1.0 billion and USDC at $522.9 million — the stablecoin's prominent third-place position reflecting traders parking capital on the sidelines. Solana ranks fourth at $376.1 million, while XRP rounds out the top five at $246.8 million. Crucially, every major asset outside stablecoins is in the red: BTC (-2.86%), ETH (-2.33%), SOL (-2.11%), XRP (-3.00%), DOGE (-2.44%), BNB (-0.53%), and SUI (-3.07%). The lone outlier is PAXG (tokenized gold) at $5,424, up 0.73% — a clear safe-haven bid in the current environment. OKX data mirrors the pattern: BTC at $65,210, ETH at $1,919, and gold-backed XAUT at $5,351 (+0.87%).
| # | Coin | Price | 24h Change | Volume(24h) | High | Low |
|---|---|---|---|---|---|---|
| 1 | BTC | $65,225 | -2.86% | $1.5B | $68,199.99 | $65,056.00 |
| 2 | ETH | $1,920 | -2.33% | $1.0B | $2,054.80 | $1,907.41 |
| 3 | USDC | $1.00 | +0.00% | $522.9M | $1.00 | $1.00 |
| 4 | SOL | $83 | -2.11% | $376.1M | $88.90 | $81.69 |
| 5 | XRP | $1.34 | -3.00% | $246.8M | $1.43 | $1.34 |
| 6 | USD1 | $1.00 | -0.01% | $145.4M | $1.00 | $1.00 |
| 7 | PAXG | $5,424 | +0.73% | $115.1M | $5,448.09 | $5,286.25 |
| 8 | BNB | $615 | -0.53% | $100.5M | $632.16 | $610.89 |
| 9 | DOGE | $0.09 | -2.44% | $96.7M | $0.10 | $0.09 |
| 10 | SUI | $0.88 | -3.07% | $57.9M | $0.95 | $0.87 |
The Binance futures market tells a more complex story. Open interest across the top 10 contracts totals over $10.5 billion, with BTC alone accounting for $5.1 billion and ETH at $3.5 billion. Long/short ratios reveal a market that's tilted bullish despite the price action: BTC stands at 62.6% long / 37.4% short (ratio 1.67), ETH at 67.5% / 32.5% (2.08), and SOL at 69.8% / 30.2% (2.32). These elevated long ratios during a downturn could signal either conviction in a rebound or set the stage for a long squeeze if prices continue lower.
| Coin | Funding Rate | Open Interest | Long/Short |
|---|---|---|---|
| BTC | 0.0029% | $5.1B | 62.6% / 37.4% |
| ETH | 0.0053% | $3.5B | 67.5% / 32.5% |
| SOL | 0.0054% | $783.2M | 69.8% / 30.2% |
| XRP | -0.0037% | $352.4M | 67.3% / 32.7% |
| DOGE | 0.0030% | $141.9M | 66.2% / 33.8% |
| BNB | 0.0000% | $302.6M | N/A |
| ADA | -0.0038% | $87.3M | N/A |
| AVAX | 0.0074% | $71.4M | N/A |
| DOT | -0.0217% | $48.4M | N/A |
| LINK | 0.0012% | $72.6M | N/A |
A few standouts in the funding data: DOT's deeply negative funding rate of -0.0217% indicates an unusually crowded short position — any positive catalyst could trigger a short squeeze. XRP funding is also negative at -0.0037%, while ADA sits at -0.0038%. Meanwhile, AVAX carries the highest positive funding at 0.0074%, suggesting relatively stronger bullish conviction among derivatives traders for that asset. BNB's neutral 0.0000% funding rate reflects the asset's characteristic stability during market stress.
Bitcoin ETF Flows and Whale Activity — Signs of a Reversal?
Quick Answer: Bitcoin ETFs bled $4.5 billion in 2026, but the tide may be turning: $1.1 billion flowed back in over 3 days in late February. Meanwhile, whales accumulated 270,000 BTC ($23B) — the largest net purchase in 13+ years, a classic 'smart money' signal.
Bitcoin ETF fund flows track the net capital entering or exiting U.S. spot Bitcoin exchange-traded funds, serving as a critical barometer for institutional sentiment. In 2026, Bitcoin ETFs have recorded cumulative net outflows of $4.5 billion, including an unprecedented five consecutive weeks of outflows — the longest such streak since spot Bitcoin ETFs launched in January 2024 (Yahoo Finance). However, a dramatic reversal emerged in late February: U.S. spot Bitcoin ETFs posted $1.1 billion in net inflows over three consecutive days, with BlackRock's IBIT alone accounting for $652 million (CoinDesk). February's total outflow shrank to $206.6 million — an 87% reduction from January's $1.6 billion bleed (Ainvest).
| Period | Net Flow | Notable |
|---|---|---|
| January 2026 | -$1.6B | Heavy institutional selling |
| February 2026 | -$206.6M | Outflow magnitude shrank 87% |
| Feb 25-27 (3 days) | +$1.1B | BlackRock IBIT: $652M inflow |
| 2026 YTD Cumulative | -$4.5B | 5-week outflow streak (longest ever) |
The more compelling signal comes from on-chain whale activity. According to CoinDCX data, Bitcoin whales — large-scale holders — net-purchased 270,000 BTC (approximately $23 billion) over the past month. That represents roughly 1.3% of all Bitcoin in circulation and constitutes the largest net accumulation in over 13 years (CoinDCX). SpaceX is among the notable holders, with 8,285 BTC (~$545 million) held in Coinbase Prime custody accounts across 43 addresses — down from $780 million in December 2025, a $235 million decline over three months (CoinDesk).
Taken together, the picture is familiar to seasoned market participants: retail investors panic while institutions and whales accumulate — the textbook "smart money accumulation" pattern. The question, as always, is timing. Whale accumulation is a medium-to-long-term leading indicator, not a short-term trading signal. The lag between institutional buying and price response can span weeks to months.
Week Ahead: Key Events and Outlook for March
Quick Answer: Three forces will shape this week: U.S.-Iran ceasefire talks (Polymarket: 61% by March 31), U.S. February jobs data, and whether late-February ETF inflows can sustain momentum. WTI crude at $88 adds an inflation wildcard.
The first week of March (March 2-8) will be shaped by three converging forces: geopolitical risk, macroeconomic data, and ETF flow direction. The dominant variable remains the U.S.-Iran situation. Polymarket's ceasefire contracts price a 61% probability of a deal by end of March and 78% by end of April, suggesting the market leans toward de-escalation (CoinDesk). A ceasefire would likely pull WTI crude down from its current $88 level, easing inflationary pressure and boosting risk assets broadly. An escalation, conversely, could push Bitcoin back to test the $60,000 support zone.
On the macro front, this week's U.S. February employment data — non-farm payrolls and the unemployment rate — will be closely watched. Signs of labor market cooling could strengthen the case for Fed rate cuts, a traditionally bullish catalyst for crypto. The mid-March FOMC meeting looms on the horizon, making any Fed commentary this week an additional variable to monitor.
Bullish scenario (next 1 month): U.S.-Iran ceasefire progress + sustained ETF inflows → BTC recovers to $70,000-$75,000. If whale accumulation coincides with an RSI bounce off oversold levels, a challenge of $80,000 becomes plausible.
Bearish scenario (next 1 month): Geopolitical escalation + renewed ETF outflows → BTC slides to $58,000-$62,000. An RSI below 30 could persist for months, establishing a $55,000-$67,000 trading range similar to consolidation patterns seen after previous extreme fear periods.
Key Takeaways for Traders
- Fear & Greed at 14: Historically, extreme fear zones have overlapped with medium-to-long-term buying opportunities. But rather than trying to time the bottom, dollar-cost averaging (DCA) remains the more reliable strategy.
- RSI below 30 (3rd time ever): Both prior instances were followed by months of sideways action before recovery. Patience, not urgency, is the appropriate posture.
- ETF flow reversal signal: The $1.1 billion in 3-day inflows is encouraging, but one data point doesn't reverse a 5-week trend. This week's flows will be a critical confirmation.
- Whale accumulation (270,000 BTC): The largest net purchase in 13+ years is a powerful bullish signal, but institutional accumulation typically leads price by weeks or months, not days.
- Derivatives positioning: Long/short ratios on Binance are skewed long (BTC 62.6% long, SOL 69.8% long). If the market turns lower, these crowded longs could amplify the move via liquidation cascades. DOT's -0.0217% funding rate signals an extreme short crowding that could trigger a squeeze.
- Tokenized gold outperforming: PAXG (+0.73%) and XAUT (+0.87%) rising while all major crypto assets fall is a clear flight-to-safety signal worth monitoring.
- U.S.-Iran ceasefire odds (61% by March 31): Geopolitical resolution could drive a rapid rebound; escalation could trigger another flash crash — especially during low-liquidity weekend sessions.
From a risk management standpoint, this is a market defined more by volatility than direction. The weekend's $64,000 → $66,843 → $65,225 whipsaw illustrates how quickly conditions can shift. Leveraged positions carry elevated risk; spot-based strategies with defined entry zones offer a safer approach. The convergence of extreme fear, oversold technicals, and record whale accumulation suggests a medium-term floor is forming — but the path to get there may involve more pain first.
This article is for informational purposes only and does not constitute investment advice. All investment decisions should be made based on your own judgment and risk tolerance.
Frequently Asked Questions
How extreme is a Fear and Greed Index reading of 14?
A Fear & Greed Index reading of 14 is the third most extreme fear zone since the index was introduced in 2018. It has remained below 25 for 22 consecutive days — something that has only happened twice before: during the March 2020 COVID crash (index hit 8, BTC ~$5,000 → +1,500% over 12 months) and the June 2022 FTX-era collapse (index hit 6, BTC ~$20,000 → +45% over 12 months). Both previous instances were followed by substantial recoveries, though immediate bounces were not guaranteed — months of consolidation typically preceded the sustained move higher.
What caused Bitcoin's weekend crash?
Between February 28 and March 1, news of U.S.-Iran military confrontation sent Bitcoin below $64,000. Thin weekend liquidity amplified the geopolitical shock. The crash reversed on Sunday as Polymarket ceasefire probability rose to 61% by end of March, pushing Bitcoin to $66,843 (+5.2%). CoinDesk analysts noted both the crash and rebound were "exaggerated moves" driven by low weekend volume.
What does whale accumulation of 270,000 BTC mean?
Over the past month, Bitcoin whales net-purchased 270,000 BTC — approximately $23 billion worth and roughly 1.3% of all Bitcoin in circulation. This is the largest net accumulation in over 13 years (CoinDCX). Historically, whale accumulation during extreme fear phases has served as a leading indicator for medium-to-long-term price appreciation — a classic pattern where "smart money" buys what retail is panic-selling.
What key events could move the crypto market this week?
Four key variables will shape the first week of March: U.S.-Iran ceasefire negotiations (61% probability by March 31 per Polymarket), U.S. February employment data (non-farm payrolls, unemployment rate), whether Bitcoin ETF inflows sustain the late-February reversal ($1.1B over 3 days), and energy markets with WTI crude at $88 fueling inflation concerns. The mid-March FOMC meeting also looms, making Fed commentary a secondary but important factor.
Sources
- Ether, Solana, XRP Surge Up to 10% as Majors Recover Saturday's War-Driven Losses, CoinDesk
- Fear & Greed at 14: ETH, SOL Rally — Historic Bottom Signal?, SpotEdCrypto
- Bitcoin ETFs Bleed $4.5B in Cumulative Outflows in 2026, Yahoo Finance
- U.S. Spot Bitcoin ETFs Add $1.1 Billion in Three Days, CoinDesk
- Bitcoin Whales Accumulate BTC as Market Consolidates, CoinDCX
- SpaceX's $780M Bitcoin Stack Now Down to About $545M, CoinDesk
- Polymarket Iran Bets Top $529 Million, CoinDesk
- Polymarket Iran Bets: Suspicious Wallets Draw Notice, Bloomberg
- Bitcoin's 14-Day RSI Falls Below 30 for Third Time Ever, CoinDesk
- Bitcoin Price Predictions for 2026, CNBC
- Bitcoin ETF Outflows: $206.6M February Bleed, Ainvest