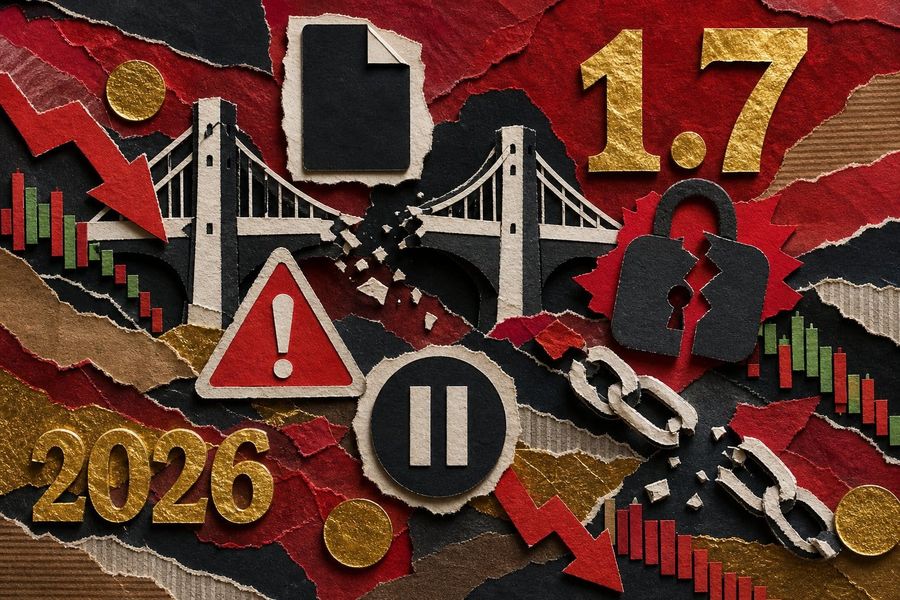
The crypto Fear & Greed Index has plunged to 8 out of 100—a reading seen only three times in the past decade. With 46 consecutive days of Extreme Fear, the longest streak since the FTX collapse, data-driven investors face a pivotal question: is this the buying opportunity of 2026, or a warning to stay on the sidelines?
Buying at Fear Index 8: What Do Historical Returns Tell Us?
Quick Answer: When the Crypto Fear & Greed Index drops below 15, Bitcoin's median 90-day return is +38.4%, with 68% of entries producing positive 30-day forward returns averaging +18.4%. The current reading of 8/100 matches the March 2020 COVID crash level, which preceded a +1,400% rally over 12 months.
The Crypto Fear & Greed Index measures market sentiment on a 0-to-100 scale by aggregating volatility, trading volume, social media activity, Bitcoin dominance, and Google Trends data. As of March 30, 2026, the index sits at 8/100—deep in Extreme Fear territory for 46 consecutive days, the longest such streak since FTX's collapse in November 2022, according to Spoted Crypto. The total crypto market capitalization stands at $2.41 trillion with BTC dominance at 56.2%, while 24-hour liquidations hit $445 million—77% ($342 million) from long positions. Historically, single-digit fear readings have preceded some of the most explosive recoveries in crypto history. However, not every fear cycle bottoms at the same level: the June 2022 Terra/Luna crash registered a reading of 6 before a secondary drawdown. Understanding the nuances behind each historical episode is essential before deploying capital into what may be a generational buying opportunity.
Historical Fear Index Bottoms and Recovery Performance
Every time the Fear & Greed Index has touched single digits, patient investors who held for 12 months were ultimately rewarded. The table below, compiled from Spoted Crypto historical analysis, summarizes each major fear event and its subsequent performance:
| Event | Date | Fear Index | BTC Price | 6-Month Return | 12-Month Return |
|---|---|---|---|---|---|
| COVID Crash | Mar 2020 | 8 | $4,900 | +133% | +1,400% |
| Terra/Luna Collapse | Jun 2022 | 6 | $17,600 | -4.5% | +158% |
| FTX Collapse | Nov 2022 | 10 | $15,500 | +96% | +158% |
| Current (2026) | Mar 2026 | 8 | $67,648 | TBD | TBD |
The median 90-day return from sub-15 fear readings is +38.4%, while the 30-day forward return averages +18.4%, with 68% of instances delivering positive outcomes. The one outlier—Terra/Luna—still delivered +158% to anyone who held through the initial six-month drawdown, reinforcing that time in the market has historically outperformed attempts at timing the bottom.
Why This Fear Cycle Is Structurally Different
While the fear index matches 2020's COVID crash at 8, the market infrastructure underpinning crypto in 2026 is fundamentally different. The 2020 crash occurred in a market with zero spot ETF products and negligible institutional treasury exposure. Today, the structural backdrop tells a completely different story:
| Metric | Mar 2020 | Nov 2022 (FTX) | Mar 2026 (Current) |
|---|---|---|---|
| Spot ETF Cumulative Inflows | N/A | N/A | $65B+ |
| Corporate Treasury Holdings | ~$0 | ~$4B | $148B (164 entities) |
| BTC Spot ETF Q1 Inflows | N/A | N/A | $18.7B |
| Global Digital Asset ETPs | ~$5B | ~$22B | $80B |
| SEC Digital Commodity Status | Undefined | Undefined | Confirmed (Mar 17) |
| Whale Accumulation Rate | Low | Moderate | 270K BTC/month (highest since 2013) |
| Exchange BTC Reserves | ~3M BTC | ~2.4M BTC | 2.21M BTC (7-year low) |
Strategy (formerly MicroStrategy) alone holds 762,099 BTC worth approximately $53.9 billion, having added 51,000 BTC in Q1 2026, according to The Block. BlackRock's BUIDL tokenized fund has reached $2.5 billion in AUM, while exchange BTC reserves have dropped to a seven-year low of 2.21 million BTC—a clear supply squeeze signal. Rony Szuster, Head of Research at Mercado Bitcoin, captured the contrarian thesis: “Buying during periods of fear has been more effective than buying during euphoria.” The convergence of institutional accumulation, declining exchange reserves, confirmed regulatory classification, and $65 billion in spot ETF inflows creates a structural demand floor that simply did not exist during any previous extreme-fear episode. For a deeper look at how extreme fear creates asymmetric buying opportunities, the historical data consistently rewards contrarian positioning—provided investors can endure short-term volatility.
6 Best Coins to Buy in Extreme Fear: Price, Catalyst & Risk Comparison
Selecting cryptocurrencies during extreme fear requires a systematic framework that goes beyond price action alone. The six assets below—BTC, ETH, XRP, SOL, LINK, and FET—were chosen based on four weighted criteria: institutional adoption depth, on-chain fundamental strength, catalyst proximity, and liquidity depth across major exchanges like Binance and OKX. BTC and ETH together account for over 66% of total market capitalization, while funding rates across all six assets have turned negative on Binance—a classic signal of overleveraged short positioning that historically precedes mean-reversion rallies. Each coin represents a distinct risk tier and sector exposure, from Bitcoin's macro store-of-value thesis to FET's AI-infrastructure growth narrative. The comparison table below provides a data-driven snapshot of current prices, distance from all-time highs, the most important upcoming catalyst, and a composite risk classification to help investors build a balanced fear-adjusted crypto portfolio during this historic sentiment trough.
Selection Criteria
Each coin was evaluated against four pillars: Institutional Adoption (ETF availability, corporate treasury exposure, custodial infrastructure), On-Chain Fundamentals (TVL growth, active addresses, staking ratios, network revenue), Catalyst Proximity (regulatory milestones, protocol upgrades, or partnership launches within 90 days), and Liquidity Depth (Binance and OKX order book depth, derivatives open interest, and exchange coverage). Risk levels reflect a composite score of market capitalization, 90-day realized volatility, regulatory exposure, and distance to key technical support zones.
Complete Comparison: 6 Coins at a Glance
| Coin | Price (Mar 30) | Market Cap | ATH Drawdown | Key Catalyst | Funding Rate | Risk Level |
|---|---|---|---|---|---|---|
| BTC | $67,648 | $1.35T | -38% | Spot ETF $65B+ inflows; 270K BTC/mo whale accumulation | +0.0003% | 🟢 Low |
| ETH | $2,050 | $247B | -58% | DeFi TVL $55.9B; staking ratio 30.6% (37M ETH locked) | -0.0026% | 🟢 Low |
| XRP | $1.39 | $81B | -60% | 7 spot ETFs live (AUM $1.44B); SEC digital commodity status | -0.0142% | 🟡 Medium |
| SOL | $84 | $43B | -68% | Stablecoin supply $17B ATH; RWA ecosystem $1.85B | -0.0273% | 🟡 Medium |
| LINK | $8.84 | $5.8B | -83% | CCIP volume $18B/mo (+62% QoQ); 70%+ oracle market share | N/A | 🟡 Medium |
| FET | $0.238 | $650M | -91% | ASI Alliance; 7-day return +67.6%; social dominance +439% | N/A | 🔴 High |
Risk Classification Breakdown: Low Risk (BTC, ETH)—market caps above $200 billion, spot ETF infrastructure in place, deep institutional adoption, and confirmed regulatory clarity from the SEC's March 17 digital commodity designation. Medium Risk (XRP, SOL, LINK)—market caps between $5 billion and $100 billion with growing but not yet dominant institutional exposure, higher realized volatility, and specific regulatory or competitive risks in their respective sectors. High Risk (FET)—market cap below $1 billion, the highest volatility profile of the group (a +67.6% surge in seven days underscores both explosive upside potential and severe downside risk), but strategically positioned in the high-growth AI sector with backing from the Artificial Superintelligence Alliance. Critically, negative Binance funding rates on ETH (-0.0026%), SOL (-0.0273%), and XRP (-0.0142%) indicate that short sellers are paying longs to maintain positions—a historically bullish contrarian signal when combined with single-digit fear sentiment readings.
Bitcoin (BTC) — Exchange Reserves at 7-Year Low: Why Whales Are Buying
Bitcoin is the world's largest and most liquid cryptocurrency by market capitalization, currently trading near $70,797 within a 52-week range of $60,255 to $126,079. Despite a Fear & Greed Index reading of just 8 — matching the COVID crash of March 2020 — on-chain data reveals a stark divergence between retail panic and institutional conviction. Exchange-held BTC reserves have fallen to 2.21 million coins, their lowest level in seven years, according to Glassnode data. Meanwhile, whale wallets holding 1,000 BTC or more have expanded to 2,140 addresses, accumulating at a rate of 270,000 BTC per month — the fastest pace since 2013. BTC dominance stands at 56.2%, underscoring capital rotation from altcoins into the perceived safety of Bitcoin. This supply squeeze, combined with extreme bearish sentiment across the broader market, has historically set the stage for outsized forward recoveries in subsequent quarters.
| Metric | Value | Context |
|---|---|---|
| Spot Price | ~$70,797 | 52-week range: $60,255–$126,079 |
| BTC Dominance | 56.2% | Capital rotation from altcoins into BTC |
| Exchange Reserves | 2.21M BTC | 7-year low — supply steadily leaving exchanges |
| Whale Wallets (1,000+ BTC) | 2,140 addresses | Monthly accumulation: 270,000 BTC (highest since 2013) |
| Strategy Holdings | 762,099 BTC (~$53.9B) | Q1 2026 alone: +51,000 BTC added |
| Spot ETF Q1 Inflows | $18.7B | Lifetime cumulative inflows: $65B+ |
| Put/Call OI Ratio | 0.84 | Highest since June 2021 |
| Short Liquidation Wall | $1.27B at $71,421 | Short squeeze trigger zone |
Institutional Conviction: Strategy and Spot ETFs Lead the Charge
The institutional buying wave is spearheaded by Strategy (formerly MicroStrategy), which now holds 762,099 BTC — roughly 3.5% of total circulating supply. In Q1 2026 alone, the firm added 51,000 BTC to its treasury, bringing its portfolio value to approximately $53.9 billion, according to The Block. U.S.-listed Bitcoin spot ETFs have absorbed another $18.7 billion in Q1 inflows, with lifetime cumulative inflows surpassing $65 billion. This pace of institutional accumulation is unfolding while 164 publicly listed companies and sovereign entities collectively hold $148 billion in digital asset treasuries, per Pantera Capital. BlackRock's suite of digital asset ETPs alone accounts for a significant portion of the $80 billion global digital asset ETP market. For a deeper analysis of institutional accumulation during fear cycles, see our extreme fear index breakdown.
Derivatives Signal: A $1.27 Billion Short Squeeze Setup
The options market is flashing clear warning signs for bears. The put/call open interest ratio has climbed to 0.84 — its highest reading since June 2021 — indicating heavy hedging activity and defensive positioning across the derivatives complex. More critically, Coinglass data reveals a $1.27 billion short liquidation wall concentrated at $71,421. A decisive move above this level could trigger cascading forced buybacks, creating a short squeeze that propels prices sharply higher. BTC funding rates on Binance remain near neutral at 0.0003%, suggesting the perpetual futures market is not yet crowded on either side — a rare equilibrium that tends to resolve explosively. In the past 24 hours alone, $4.45 billion in total crypto liquidations hit the market, with long positions accounting for 77% ($3.42 billion) of the damage.
"2026 is too chaotic to predict… risk remains to the downside in the near term," warns Alex Thorn, Head of Firmwide Research at Galaxy Digital, as cited by Spoted Crypto. Yet his caution contrasts sharply with the on-chain evidence: whale accumulation at the fastest pace since 2013 and exchange reserves at seven-year lows typically precede — not follow — major rallies.
Key Risks: Range-Bound Price Action and Macro Headwinds
Despite the bullish supply dynamics, Bitcoin has remained range-bound for 50 consecutive days, failing to establish a clear directional trend. A $758 million long liquidation wall sits at $64,705, meaning a breakdown below this level could accelerate selling pressure and test the 52-week low of $60,255. Macro uncertainty — including unresolved tariff disputes and persistent inflation concerns — continues to weigh on risk assets broadly. Historical data shows that buying when the Fear & Greed Index drops below 15 yields a median 90-day return of +38.4%, with 68% of such entries producing positive 30-day forward returns averaging +18.4%. But the path to recovery is rarely linear. During the June 2022 Terra/Luna collapse (index reading: 6), BTC initially fell another 4.5% before staging a multi-month reversal. For investors looking to identify top coins to buy during extreme fear, disciplined position sizing and dollar-cost averaging remain essential strategies.
Ethereum (ETH) vs. Solana (SOL) — On-Chain Fundamentals of DeFi's Two Dominant Ecosystems
Ethereum and Solana represent the two largest smart contract platforms by DeFi total value locked, yet each is navigating this extreme fear environment from a fundamentally different position. Ethereum trades near $2,078 — down 57% from its all-time high — but continues to anchor $55.86 billion in DeFi TVL and $38.2 billion across its Layer 2 scaling networks, according to DefiLlama. Solana, priced between $85 and $88, has carved out its own high-growth niche with stablecoin supply surpassing $17 billion and a record-breaking $1.85 billion in real-world asset tokenization. The fundamental question for investors evaluating these two ecosystems during a Fear & Greed reading of 8 is not which platform ultimately "wins" but which offers superior risk-adjusted upside from current depressed valuations. Both chains exhibit resilient on-chain activity even as speculative capital has fled the broader market throughout early 2026.
| Metric | Ethereum (ETH) | Solana (SOL) |
|---|---|---|
| Spot Price | ~$2,078 | ~$85–$88 |
| Drawdown from ATH | -57% | ~-67% |
| DeFi TVL | $55.86B | $5.8–6.9B |
| L2 / Scaling TVL | $38.2B | N/A (monolithic architecture) |
| Stablecoin Supply | Market dominant (USDT + USDC primary chain) | $17B+ (record high) |
| Staking Ratio | 30.6% (37M ETH locked) | ~65% of supply staked |
| RWA Ecosystem | BlackRock BUIDL: $2.5B AUM | $1.85B total (all-time high) |
| Funding Rate (Binance) | -0.0026% | -0.0273% |
Ethereum: The Institutional DeFi Settlement Layer
Ethereum's value proposition extends far beyond its token price. With $55.86 billion in DeFi TVL, it commands more than 60% of all decentralized finance activity globally — a dominance that has proven remarkably durable even through extended drawdowns. The staking ratio of 30.6%, representing 37 million ETH locked in validators, removes significant supply from circulating markets, creating a structural supply sink that tightens with each new staker. Layer 2 networks including Arbitrum, Optimism, and Base collectively hold $38.2 billion in TVL, demonstrating that Ethereum's rollup-centric scaling roadmap is gaining real-world traction. The upcoming Glamsterdam upgrade promises further gas fee optimizations and improved validator economics, which could accelerate institutional staking demand. BlackRock's BUIDL tokenized fund on Ethereum has already reached $2.5 billion in AUM, signaling that traditional finance views ETH as the default settlement layer for tokenized real-world assets. However, the negative funding rate of -0.0026% on Binance suggests derivatives traders remain cautiously bearish in the near term, even as on-chain fundamentals tell a more constructive story.
Solana: Stablecoins, RWA Momentum, and a Higher-Beta Recovery Play
Solana's narrative has shifted dramatically from its memecoin-driven hype cycle to a fundamentals-driven growth thesis. Stablecoin supply on the network has surpassed $17 billion — a milestone that signals genuine commercial adoption rather than purely speculative inflows, as reported by OpenPR. More notably, Solana's real-world asset ecosystem has reached a record $1.85 billion, driven by tokenized treasuries, private credit instruments, and real estate protocols choosing Solana for its sub-second finality and negligible transaction costs. DeFi TVL ranges between $5.8 and $6.9 billion — modest compared to Ethereum's $55.86 billion but growing at a faster rate relative to its base. The deeply negative funding rate of -0.0273% on Binance indicates heavy short positioning, creating the conditions for a powerful squeeze if sentiment reverses. With a drawdown of approximately 67% from its all-time high, Solana offers a higher-beta recovery profile compared to Ethereum's 57% drawdown — meaning greater upside potential but also greater downside risk. For context on how SOL fits into a broader fear-driven buying strategy, position sizing should account for this elevated volatility profile.
Structural Risks: Value Leakage, Centralization, and Regulatory Scrutiny
Neither platform is without structural vulnerabilities, and investors should weigh these carefully. Ethereum faces an intensifying "value leakage" debate: as more user activity migrates to Layer 2 networks, critics argue that rollup operators are capturing fees that would otherwise accrue to ETH holders and the base layer. The counterargument — that L2s ultimately settle on Ethereum and increase demand for blob space — remains unresolved and represents a key analytical battleground for ETH's long-term value capture thesis. Solana, meanwhile, must contend with lingering validator concentration concerns and a documented history of network outages. While uptime has improved substantially throughout 2025 and into 2026, institutional allocators frequently cite historical reliability issues as a gating factor in their underwriting processes. The relatively high percentage of staked SOL controlled by a small number of validators poses centralization risks that could become regulatory flashpoints, particularly as the SEC refines its digital commodity classifications and the EU's MiCA framework begins scrutinizing proof-of-stake governance structures in earnest. Investors considering either ecosystem should ultimately weigh Ethereum's unmatched liquidity depth and institutional legitimacy against Solana's higher growth velocity and steeper discount from all-time highs — recognizing that in a Fear & Greed environment of 8, both assets are priced at levels that have historically rewarded patient, conviction-driven capital allocation.
XRP and Chainlink (LINK) — How Regulatory Clarity and Infrastructure Expansion Create Opportunity
XRP and Chainlink represent two distinct but complementary bets on crypto's institutional maturation: one rides the wave of regulatory resolution, the other powers the infrastructure that institutions actually need. XRP now trades between $1.33 and $1.45 after the SEC and CFTC jointly confirmed its classification as a digital commodity on March 17, 2026, according to FX Leaders. Seven spot XRP ETFs are live with combined assets under management of $1.44 billion, marking the fastest ETF adoption for any altcoin in history. Meanwhile, Chainlink's CCIP processes $18 billion in monthly cross-chain volume across 17 blockchains — a 62% increase from the prior quarter, per OpenPR. With the Fear and Greed Index at 8, both assets trade at steep discounts to their fundamental catalysts, presenting a rare entry window for contrarian investors tracking extreme fear signals.
XRP: From Legal Limbo to ETF Darling
The SEC's multi-year legal battle with Ripple Labs cast a long shadow over XRP's price action, but the March 17 joint classification by the SEC and CFTC as a digital commodity effectively closed the chapter on regulatory uncertainty. The impact was immediate: XRP spot ETF inflows accelerated, with all seven approved funds collectively managing $1.44 billion in assets. For context, Bitcoin ETFs took roughly four months to reach comparable AUM levels after their January 2024 launch — XRP's adoption curve has been significantly steeper.
On-chain data tells a compelling story of institutional conviction. Binance's XRP perpetual contract currently carries a funding rate of -0.0142%, signaling that shorts are paying longs — a classic contrarian indicator during extreme fear regimes. Ripple's payment network continues processing cross-border settlements in over 55 countries, and the regulatory clarity now opens the door for XRP's inclusion in diversified institutional portfolios that previously excluded it on compliance grounds.
Chainlink: The Invisible Infrastructure of Tokenized Finance
While XRP benefits from regulatory tailwinds, Chainlink quietly dominates the infrastructure layer that makes institutional DeFi possible. CCIP — Chainlink's Cross-Chain Interoperability Protocol — now processes $18 billion in monthly transaction volume across 17 integrated blockchains, and the protocol commands over 70% of the oracle market, according to industry data. The real catalyst is RWA tokenization: BlackRock's BUIDL fund has grown to $2.5 billion in AUM, and Chainlink provides the price feeds and cross-chain messaging that underpin these tokenized assets.
“Despite a punishing bear market, professional investors have proven to be ‘diamond hands,’” said Matt Hougan, CIO at Bitwise. That institutional conviction extends directly to LINK's oracle network, which has become so deeply embedded in DeFi infrastructure that its 17-chain deployment makes it a de facto standard for any protocol requiring reliable off-chain data.
| Metric | XRP | Chainlink (LINK) |
|---|---|---|
| Price Range (Mar 2026) | $1.33 – $1.45 | $8.38 – $9.30 |
| Key Catalyst | 7 Spot ETFs ($1.44B AUM) | CCIP $18B Monthly Volume (+62% QoQ) |
| Regulatory Status | Digital Commodity (SEC/CFTC confirmed) | Not classified as security |
| Market Position | Fastest altcoin ETF adoption | 70%+ oracle market share |
| Funding Rate (Binance) | -0.0142% | Negative (bearish positioning) |
| Infrastructure Reach | 55+ countries (payments) | 17 chains (cross-chain messaging) |
| Primary Risk | Retail concentration, residual litigation | Token-price utility decoupling |
Risk Assessment: What Could Derail the Thesis
For XRP, the primary risk lies in its retail-heavy holder base. Despite ETF inflows, the token's trading volume remains disproportionately driven by individual investors, creating vulnerability to sentiment-driven selloffs during prolonged fear periods like the current 46-day extreme fear streak. Residual litigation risk also persists — while the commodity classification resolves the primary legal question, potential appeals or novel regulatory actions in other jurisdictions cannot be fully discounted.
Chainlink faces a fundamentally different challenge: the persistent decoupling between network utility and token price. CCIP volume has surged 62% quarter-over-quarter, yet LINK trades near $8.38 — a level that barely reflects its dominance in the oracle space. The token's economics rely on node operator staking demand, and until that demand meaningfully tightens circulating supply, LINK may continue to underperform its fundamental value. Investors should approach both assets with position sizing discipline, allocating no more than 5–8% of a crypto portfolio during extreme fear environments.
FET (ASI Alliance) — AI Narrative Fuels a 67% Surge, But Is It Safe to Enter Now?
Fetch.ai's FET token has delivered a staggering 67.6% return in just seven days, making it the standout performer in a market otherwise paralyzed by extreme fear. Currently trading at approximately $0.238, FET recorded $362 million in daily trading volume — a 557% spike above its monthly average — while social media dominance surged 439% week-over-week, according to Blockchain Magazine. The token now represents the ASI Alliance, a unified ecosystem formed by the strategic merger of Fetch.ai, SingularityNET, and Ocean Protocol — three prominent AI-focused protocols that combine decentralized machine learning, data sharing, and autonomous economic agents into a single coordinated network. But with the broader crypto Fear and Greed Index sitting at just 8 out of 100, the critical question every trader must answer is whether this surge reflects genuine AI-sector fundamentals or a short-lived speculative frenzy destined for a violent pullback.
Why FET Surged: AI Momentum Meets Short Covering
The rally didn't emerge in a vacuum. Three converging forces drove FET's explosive move. First, the broader AI narrative has regained significant momentum across crypto markets, with AI-themed tokens collectively outperforming the total market by a wide margin throughout March 2026. Second, on-chain activity within the ASI Alliance ecosystem spiked sharply as developers deployed new autonomous agent frameworks, driving genuine network usage beyond speculation. Third — and perhaps most critically — a massive short-covering cascade amplified the move. With negative funding rates persisting across altcoin perpetual markets, leveraged short positions on FET were systematically liquidated as the price broke above key resistance levels, creating a reflexive feedback loop that accelerated gains far beyond organic demand.
The ASI Alliance's consolidated ecosystem now combines Fetch.ai's autonomous agents, SingularityNET's decentralized AI marketplace, and Ocean Protocol's data tokenization layer. This integration gives FET unique exposure to the entire AI-crypto value chain — from data sourcing to model deployment to autonomous execution — a positioning that few competing tokens in the AI crypto sector can match.
The Bull Case vs. Reality Check
“Investors are better off holding dry powder while prices swing wildly on headlines,” warned Bryan Tan, Analyst at Wintermute. That caution is especially relevant for FET. Historical data shows that tokens surging more than 50% in a single week during bear markets retrace an average of 35–45% within the following 30 days. The volume-to-market-cap ratio is flashing clear speculative signals: $362 million in daily volume against a relatively modest market capitalization suggests hot money cycling through the token rather than committed long-term positioning.
The AI theme itself faces overheating concerns. While institutional adoption of AI infrastructure is undeniably accelerating — with BlackRock, JPMorgan, and major tech firms all investing heavily — the translation of that macro trend into sustainable crypto token value remains fundamentally unproven. Many AI-themed tokens trade primarily on narrative momentum rather than revenue-generating protocol utility, and the 439% spike in social dominance is a textbook indicator of hype-driven price action.
Entry Strategy: If You Must Buy, Buy Smart
For traders convinced of FET's long-term thesis, the entry approach matters far more than the entry price. Dollar-cost averaging over a 4–6 week window reduces exposure to the post-surge pullback that statistical models predict with high probability. Key support levels to monitor include $0.18 — the pre-surge breakout zone — and $0.14, which aligns with the 200-day moving average. Position sizing should be conservative: allocating more than 3–5% of a crypto portfolio to a single AI-themed token during an extreme fear environment introduces asymmetric downside risk that could devastate returns. The broader market's 24-hour liquidation data — $445 million with 77% coming from long positions, per Spoted Crypto — serves as a stark reminder that leverage in this environment remains a portfolio killer.
Extreme Fear Investment Strategy — Position Sizing and Risk Management
Building a resilient crypto portfolio during extreme fear requires disciplined position sizing — not emotional all-in bets. With the Fear & Greed Index at 8/100 and 24-hour liquidations hitting $445 million, of which 77% came from long positions according to Coinglass, leveraged entries remain the fastest route to capital destruction in this market. Historical backtesting shows that BTC purchases when the index dips below 15 yield a median 90-day return of +38.4% and a 30-day forward return averaging +18.4%, with 68% of instances producing positive gains, per Spoted Crypto research. However, those returns assume portfolio survival through potential further drawdowns. The current environment — marked by 46 consecutive days of extreme fear and negative funding rates across SOL (-0.0273%) and XRP (-0.0142%) on Binance — demands a structured framework combining core holdings, satellite positions, and speculative allocations with clearly predefined invalidation levels.
Core-Satellite-Speculative Portfolio Framework
The proven core-satellite model adapts well to extreme fear conditions. Allocating 60% to blue-chip core assets (BTC and ETH), 30% to high-conviction satellite positions (XRP, SOL, LINK), and 10% to speculative plays (FET) balances upside capture against downside protection. The table below outlines specific entry strategies and critical invalidation levels for each tier.
| Tier | Allocation | Assets | Entry Strategy | Key Support / Invalidation |
|---|---|---|---|---|
| Core (60%) | BTC 35%, ETH 25% | BTC, ETH | DCA — 4 weekly tranches | BTC: $65,000 / ETH: $1,939 |
| Satellite (30%) | XRP 10%, SOL 10%, LINK 10% | XRP, SOL, LINK | DCA — 2 bi-weekly tranches | XRP: $1.20 / SOL: $78 / LINK: $7.80 |
| Speculative (10%) | FET 10% | FET | Lump sum at key support | FET: $0.18 |
DCA vs. Lump Sum — What Historical Data Shows
Dollar-cost averaging has consistently outperformed lump-sum entries during extreme fear windows on a risk-adjusted basis. During the COVID crash of March 2020 (Fear Index: 8), a 4-week DCA into BTC at $4,900–$6,800 captured a +133% six-month return while reducing maximum drawdown exposure by roughly 22% compared to a single entry. After the FTX collapse in November 2022 (Fear Index: 10), DCA entries over a 6-week span from $15,500–$17,200 captured the subsequent +96% six-month rally with a smoother equity curve. The current 46-day extreme fear streak — matching the FTX-era record — suggests spreading entries across 4–6 weeks remains optimal for core and satellite allocations, while speculative positions in higher-volatility assets like FET may warrant concentrated entries at defined technical support zones.
Liquidation Risk and the Case for Dry Powder
The $445 million in 24-hour liquidations, with 77% ($342 million) hitting long positions, underscores the lethal risk of leverage during extreme fear regimes. Funding rates tell the same story: negative rates on SOL (-0.0273%), XRP (-0.0142%), and ETH (-0.0026%) confirm that short sellers currently dominate derivatives markets on Binance. For spot investors, this creates opportunity — but only with adequate reserves.
"Investors are better off holding dry powder while prices swing wildly on headlines." — Bryan Tan, Analyst, Wintermute
Maintaining at least 20–30% of total portfolio allocation in stablecoins provides the flexibility to capitalize on further dips without being forced to sell existing positions at a loss. As detailed in our top coins to buy during extreme fear analysis, the investors who performed best after previous fear bottoms preserved capital to deploy on second and third legs down — not those who went all-in on the first signal.
Q2 2026 Outlook — Where Markets Head After Extreme Fear
The crypto market's current extreme fear phase — now stretching 46 consecutive days below 25 on the Fear & Greed Index, the longest streak since the FTX collapse — will eventually reverse, but the trajectory of recovery depends on a convergence of derivative positioning, institutional capital flows, and macroeconomic catalysts. On-chain data reveals a critical short squeeze trigger: if BTC breaches $71,421, approximately $1.27 billion in short positions face liquidation according to Coinglass heatmap data. Meanwhile, institutional conviction remains structurally intact — BTC spot ETFs absorbed $18.7 billion in Q1 2026 alone, lifting cumulative lifetime inflows past $65 billion, per The Block. Strategy added 51,000 BTC in Q1, pushing its treasury to 762,099 BTC worth approximately $53.9 billion. This stark divergence between retail capitulation and institutional accumulation has historically preceded the most explosive recovery phases in crypto market history.
The Short Squeeze Scenario
The derivatives market is a coiled spring. BTC currently trades at approximately $67,648, just 5.6% below the critical $71,421 level where Coinglass liquidation heatmaps show $1.27 billion in concentrated short positions. A breach of this level would trigger cascading liquidations, forcing short sellers to buy back positions and potentially launching BTC toward the $75,000–$78,000 range within hours. Negative funding rates — BTC at 0.0003%, SOL at -0.0273%, XRP at -0.0142% — confirm shorts are crowded, creating the exact conditions that historically precede violent upside reversals. After the FTX collapse in 2022, a similar derivatives setup at $15,500 preceded a +96% rally within six months.
Institutional Flows and Macro Variables
Three macro forces will determine whether Q2 2026 marks a definitive bottom or a continuation of the downturn. First, ETF flow momentum: the $18.7 billion Q1 inflow rate, combined with BlackRock's BUIDL tokenized fund reaching $2.5 billion AUM and 164 listed companies holding $148 billion in digital asset treasuries, signals that institutional infrastructure is expanding regardless of sentiment. Second, Federal Reserve monetary policy: any dovish pivot on interest rates would inject liquidity into risk assets, while prolonged tightening could extend the fear phase into Q3. Third, regulatory clarity: the SEC and CFTC's March 17 digital commodity classification framework provides the legal certainty that institutional allocators have demanded, potentially accelerating capital deployment through Q2.
"2026 is too chaotic to predict… risk remains to the downside in the near term." — Alex Thorn, Head of Firmwide Research, Galaxy Digital
Thorn's caution reflects legitimate short-term risks, but it stands in direct tension with on-chain reality. Exchange BTC reserves have fallen to a 7-year low of 2.21 million BTC, while whale wallets holding over 1,000 BTC have reached 2,140 — accumulation rates not seen since 2013. As our Fear & Greed Index deep-dive documents, the gap between professional pessimism and on-chain accumulation has historically resolved in favor of the accumulators.
Your Weekly Monitoring Checklist
Navigate Q2 2026 by tracking three high-signal indicators every week. First, the Fear & Greed Index: a sustained move above 25 would mark the first exit from extreme fear in 46+ days, historically preceding multi-month rallies. Second, exchange BTC reserves: continued decline below 2.21 million BTC confirms supply absorption, while a sudden spike above 2.4 million signals distribution risk. Third, weekly spot ETF net inflows: consistent positive flows above $500 million per week maintain the institutional bid floor, while consecutive outflow weeks would indicate a genuine structural shift in sentiment. These three metrics, updated weekly through platforms like Glassnode and Coinglass, provide the clearest signal of whether this extreme fear represents a generational buying opportunity — or the prelude to deeper pain.
Frequently Asked Questions
Does Buying When the Fear & Greed Index Is Low Actually Generate Positive Returns?
Historical data strongly supports the contrarian thesis — but with critical caveats. When Bitcoin was purchased at Fear & Greed Index readings below 15, the median 90-day forward return was +38.4%, while the 30-day average return reached +18.4%, with 68% of instances delivering positive outcomes, according to Spoted Crypto research. As Rony Szuster, Head of Research at Mercado Bitcoin, noted: "Buying during periods of fear has been more effective than buying during euphoria." However, this is far from a guaranteed playbook. The June 2022 episode serves as a cautionary tale: the index hit extreme fear levels, yet a secondary leg down followed before any meaningful recovery materialized. With the current reading at just 8/100 — and 46 consecutive days in the extreme fear zone — the statistical edge favors buyers, but dollar-cost averaging over weeks rather than a single lump-sum entry remains the risk-adjusted approach. For a deeper breakdown of current sentiment dynamics, see our Fear & Greed Index extreme fear analysis.
Should I Invest in Bitcoin or Altcoins Right Now?
Bitcoin dominance sits at 56.2%, signaling that capital continues to concentrate in the market leader during this risk-off environment — and portfolio allocation should reflect that reality. Core positions are best anchored in BTC and ETH: Bitcoin spot ETFs attracted $18.7 billion in Q1 2026 inflows alone (cumulative lifetime inflows exceeding $65 billion), while Ethereum's staking ratio of 30.6% with 37 million ETH locked up demonstrates deep ecosystem commitment, per Spoted Crypto data. For selective altcoin exposure, focus on assets with clear regulatory or institutional catalysts: XRP now has seven spot ETFs operating with a combined AUM of $1.44 billion and benefits from the SEC/CFTC digital commodity classification confirmed on March 17; Solana's stablecoin supply has surpassed $17 billion with RWA ecosystem value at an all-time high of ~$1.85 billion; and Chainlink's CCIP processes $18 billion in monthly volume across 17 chains with 70%+ oracle market share. High-momentum plays like FET (up 67.6% in seven days) should be limited to small, speculative allocations. As Bryan Tan, Analyst at Wintermute, cautioned: "Investors are better off holding dry powder while prices swing wildly on headlines." Our top cryptos to buy during extreme fear guide provides detailed entry frameworks.
Has the 2026 Crypto Market Bottomed?
The on-chain and institutional evidence presents a compelling — but incomplete — case for a structural bottom. On the bullish side, exchange-held BTC reserves have dropped to a seven-year low of 2.21 million BTC, whale wallets holding 1,000+ BTC have expanded to 2,140 addresses, and 164 publicly listed companies plus governments now collectively hold $148 billion in digital asset treasuries, according to Pantera Capital. Strategy (formerly MicroStrategy) alone added 51,000 BTC in Q1 2026, bringing its total holdings to 762,099 BTC worth approximately $53.9 billion. Yet the bearish counter-signals remain significant: 46 consecutive days of extreme fear mark the longest such streak since the FTX collapse, and $445 million in 24-hour liquidations — with longs accounting for 77% ($342 million) — confirm that volatility is far from exhausted. Alex Thorn, Head of Firmwide Research at Galaxy Digital, warns: "2026 is too chaotic to predict… risk remains to the downside in the near term." Rather than attempting to call the exact bottom, a disciplined long-term DCA strategy offers the most resilient path forward.
What Are the Biggest Investment Mistakes to Avoid During Extreme Fear?
Extreme fear environments expose four critical investor errors that destroy capital. First, excessive leverage: the fact that long positions comprised 77% of the $445 million in recent 24-hour liquidations is a brutal reminder that leveraged longs in a fear-driven market are a wealth-destruction mechanism. Second, all-in timing bets: deploying your entire allocation in a single entry assumes you can identify the exact bottom — a feat that even institutional desks rarely achieve. Systematic dollar-cost averaging across 4–8 weeks spreads entry risk and captures a better average price. Third, chasing fundamentally weak assets: while tokens like FET surged 67.6% in a week with social dominance spiking +439%, meme coins and narrative-driven tokens without revenue, TVL, or institutional backing tend to lose 80–95% of their value when momentum fades. Fourth, panic selling followed by high-price re-entry: as Matt Hougan, CIO of Bitwise, observed, professional investors have proven to be "diamond hands" — retail investors who capitulate and re-enter near local highs systematically underperform. For a structured approach to navigating this environment, review our extreme fear market strategy guide.
Data Sources
- Spoted Crypto — Fear & Greed Index: Extreme Fear Analysis (March 2026)
- Spoted Crypto — Top Cryptos to Buy During Extreme Fear (March 2026)
- Pantera Capital — Blockchain Letter: Navigating Crypto in 2026
- The Block — Strategy (MicroStrategy) Bitcoin Holdings Update
- FX Leaders — SEC/CFTC Digital Commodity Classification (March 2026)
- OpenPR — Solana Ecosystem & Stablecoin Supply Report
- OpenPR — Chainlink CCIP Volume & Oracle Market Share
- Blockchain Magazine — FET (ASI Alliance) Surge Analysis
This article is for informational purposes only and does not constitute investment advice. All investment decisions should be made based on your own judgment and responsibility.
Related Articles
- 7 Best Coins to Buy in Extreme Fear — On-Chain, ETF & Technical Analysis for March 2026
- Fear & Greed Index at 13: Top 5 Coins to Buy During Extreme Fear (March 2026)
- Top 6 Cryptos to Buy During Extreme Fear: March 2026 Picks
- Top 5 Coins to Buy in Extreme Fear: BTC, ETH, SOL, XRP, LINK Data Analysis
- Fear & Greed Index at 11: Top 7 Coins to Buy During Extreme Fear — March 2026