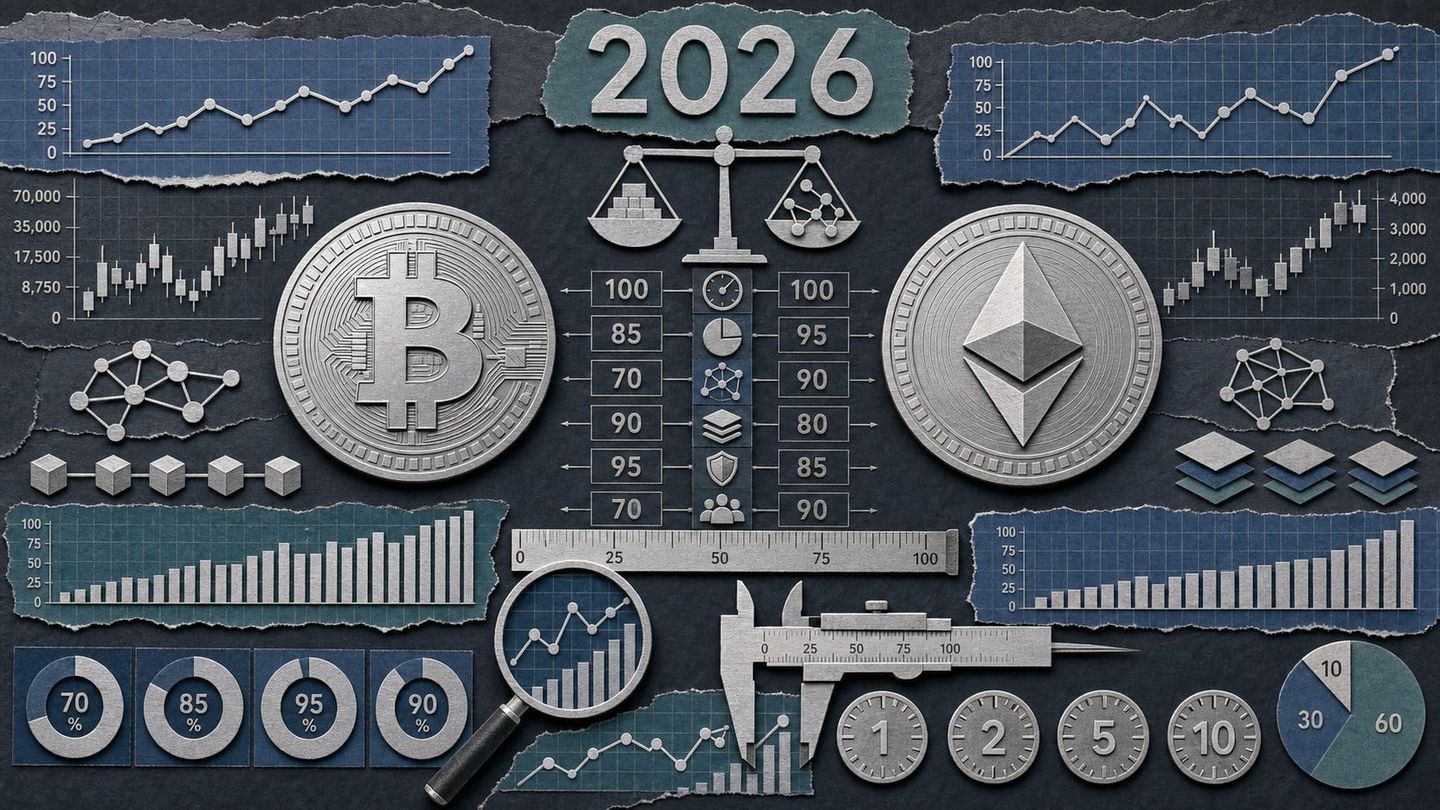
Two Different Bets: What Bitcoin and Ethereum Actually Are
Bitcoin and Ethereum are the two largest digital assets by market capitalization, but they represent fundamentally distinct investment theses — not variations on the same theme. Bitcoin is engineered as non-sovereign monetary scarcity: a mathematically enforced hard cap of exactly 21 million coins, approximately 19.9 million of which are already mined, with a mechanically predetermined issuance schedule that halves every four years and produces zero native yield of any kind. Ethereum, launched in 2015, is programmable global infrastructure — a decentralized computing platform whose native token, ETH, functions simultaneously as gas for transaction execution, collateral across decentralized finance protocols, and staking capital generating 3.5–5% annual yield. According to Motley Fool's April 2026 analysis, Bitcoin's market capitalization stands near $1.6 trillion while Ethereum's ranges between $278 and $353 billion — a scale gap that shapes liquidity profiles, volatility characteristics, and institutional access in meaningfully different ways for long-term portfolio construction.
Quick Answer: Bitcoin and Ethereum serve different long-term roles. Bitcoin offers mathematically enforced scarcity (21M hard cap, ~0.85% current inflation rate) and unmatched institutional ETF liquidity at a $1.6T market cap. Ethereum offers programmable infrastructure with 3.5–5% native staking yield across a $278–$353B ecosystem tied to DeFi, stablecoins, and real-world asset growth.
The scale gap between the two assets extends well beyond market capitalization numbers. Bitcoin's price action is increasingly driven by institutional flows — spot ETPs now hold approximately 12% of its entire circulating supply — while Ethereum's price is more tightly coupled to the health of its on-chain ecosystem: DeFi total value locked, stablecoin issuance volume, and the competitive demand for base-layer block space. This structural difference means the two assets can diverge significantly in behavior even when macro conditions are identical, and tracking their individual drivers is essential for active investors.
Both assets fell sharply from late-2025 peaks. Bitcoin traded at roughly $81,206 in April 2026, down from highs above $100,000, while Ethereum tracked a comparable percentage decline driven by the same catalyst: elevated U.S. Treasury yields compressing risk appetite across global markets. Importantly, correlation between the two assets rises sharply during risk-off regimes — when institutional investors deleverage broadly, both BTC and ETH are sold together regardless of their individual fundamentals. This correlation behavior is a critical input for any portfolio construction framework that treats the two assets as diversifiers relative to each other. According to Coin Bureau, the starting point for any rational long-term allocation decision is a clear-eyed understanding of the underlying differences in supply mechanics, yield characteristics, and ecosystem exposure — not headline price performance alone.
Supply Mechanics: Hard Cap vs. Dynamic Issuance
Bitcoin's supply mechanics are the simplest in all of digital assets: a fixed maximum of 21 million coins, enforced by protocol rules that no single actor — miner, developer, or government — can unilaterally override. The April 2024 halving reduced the block reward to 3.125 BTC per block, resulting in an annual issuance rate of approximately 0.85%. That rate will continue declining mechanically at each subsequent halving, with the next reduction to 1.5625 BTC per block scheduled for approximately April 2028, trending toward zero by roughly 2140. This predictability is a deliberate feature: investors can model Bitcoin's future supply with mathematical precision that no fiat currency, commodity, or other digital asset can match. Ethereum's monetary policy operates on a fundamentally different logic. Since the September 2022 Merge, Ethereum has run on proof-of-stake, and EIP-1559 permanently burns base transaction fees, creating a demand-driven deflationary offset against new validator issuance. According to Everstake's 2025 Annual Protocol Report, subdued on-chain activity in 2025 caused ETH to tip into net inflation, adding approximately 563,000 ETH to total supply — representing roughly +0.46% annual dilution. During peak network activity, that dynamic reverses entirely as burns exceed new issuance.
The contrast is stark in principle but more nuanced in practice. Bitcoin's absolute scarcity narrative is straightforward and easily communicated to any audience: there will never be more than 21 million coins in existence. Ethereum's monetary policy is context-dependent — when network utilization is high, ETH becomes deflationary; when underutilized, it experiences mild inflation. Critics argue this introduces uncertainty into the value proposition; proponents argue it is a superior mechanism because supply contraction is tied directly to actual demand for the network's services, rather than an arbitrary predetermined schedule.
| Metric | Bitcoin (BTC) | Ethereum (ETH) |
|---|---|---|
| Supply Cap | 21,000,000 BTC (hard cap, protocol-enforced) | None — dynamic issuance with EIP-1559 base-fee burn |
| Circulating Supply (Q1–Q2 2026) | ~19.9 million BTC | ~120.7–121.6 million ETH |
| Current Annual Inflation Rate | ~0.85% (post-April 2024 halving) | +0.46% net (2025, activity-dependent) |
| Issuance Reward | 3.125 BTC per block | ~2,500 ETH/day validator rewards (variable) |
| Next Major Supply Event | Halving ~April 2028 → reward drops to 1.5625 BTC | Glamsterdam upgrade H1 2026; Hegotá upgrade H2 2026 |
| Deflationary Mechanism | None (issuance only declines, never goes negative) | EIP-1559 base-fee burn — net deflationary at peak activity |
An important nuance for long-term investors: Ethereum's +0.46% net inflation in 2025 was not alarming in absolute terms — it remains well below Bitcoin's current 0.85% issuance rate and orders of magnitude below historical fiat inflation rates. The more significant concern is what subdued fee revenue signals about base-layer demand. Layer-2 networks such as Arbitrum, Base, and Optimism now absorb the vast majority of Ethereum transactions at a fraction of the cost, reducing the amount of ETH burned per unit of economic activity. The Fusaka upgrade in December 2025, which enabled PeerDAS and increased blob throughput by 8x, further accelerated this dynamic — excellent for Layer-2 users, but a structural headwind for base-layer burn rates. Upcoming 2026 upgrades (Glamsterdam, Hegotá) targeting higher gas limits and enshrined proposer-builder separation may recover base-layer fee capture over time, though the timeline to a sustained deflationary tilt remains an open question.
Historical Returns: A Decade of BTC vs. ETH Performance Data
Over the full decade ending April 2026, Ethereum narrowly edged Bitcoin on raw cumulative total return: approximately +18,030% versus Bitcoin's +16,200%, according to Motley Fool's April 2026 analysis. That headline figure can be misleading, however. On an annualized basis since 2017, Bitcoin has compounded at approximately 50% per year compared to Ethereum's approximately 33% — reflecting Bitcoin's superior consistency across full market cycles, including deep bear markets where Ethereum's higher volatility erased gains faster and deeper. The practical implication for long-term investors is significant: a holder who accumulated Bitcoin steadily through multiple cycles captured a higher compound annual return despite ETH's marginally larger raw cumulative figure, largely because BTC's smaller peak-to-trough drawdowns and faster recoveries preserved more compounding base. Both assets remain extraordinary performers over any multi-year horizon by any traditional asset class standard; the distinction between them is a question of volatility tolerance, drawdown depth, and cycle timing discipline.
| Time Period | BTC Cumulative Return | BTC Annualized | ETH Cumulative Return | ETH Annualized |
|---|---|---|---|---|
| 1-Year (Apr 2025–Apr 2026, est.) | ~−5% | ~−5% | ~+35% | ~+35% |
| 3-Year (Apr 2023–Apr 2026, est.) | ~+190% | ~+42% | ~+37% | ~+11% |
| 5-Year (Apr 2021–Apr 2026, est.) | ~+40% | ~+7% | ~+18% | ~+3% |
| 10-Year (Apr 2016–Apr 2026) | +16,200% | ~50% | +18,030% | ~33% |
Note: 1-, 3-, and 5-year figures are estimates based on available price data points. 10-year figures sourced from Motley Fool and annualized since-2017 figures from Investing.com.
The 3-year and 5-year windows illustrate just how dramatically cycle timing affects return attribution. Bitcoin's approximate 3-year return of +190% (April 2023–April 2026) captures the full 2023–2024 bull market followed by the post-peak drawdown from above $100,000. Ethereum's roughly +37% over the same period reflects a more difficult environment for ETH: Layer-2 fee compression, subdued base-layer activity, and the broader macro correction from late-2025 highs all weighed on ETH's price relative to its on-chain activity volumes.
According to Investing.com's performance divergence analysis, Ethereum exhibits meaningfully higher beta relative to Bitcoin — amplifying gains during risk-on periods and deepening drawdowns in risk-off episodes. In practice, ETH tends to outperform BTC in the early-to-middle phases of a bull cycle and significantly underperform in the late and bear phases. For an active trader comfortable managing volatility, that beta profile is a tool. For a more conservative long-horizon holder, Bitcoin's smoother compounding profile is structurally easier to maintain through extended periods of market stress without capitulating at precisely the wrong moment.
Ethereum Staking: The Yield Advantage Bitcoin Cannot Match
Ethereum staking represents the single largest structural difference between the two assets from an income perspective: Bitcoin offers zero native yield by design, while Ethereum validators currently earn 3.5–5% APY on staked ETH — making it the only top-5 digital asset by market capitalization that delivers native yield at meaningful scale. According to Everstake's Ethereum Staking Annual Report 2025, approximately 36.08 million ETH were locked in staking contracts at year-end 2025, representing 29.3% of total circulating supply — with more than 1.8 million ETH added through 2025 alone. The scale of participation positions Ethereum's staking layer as one of the largest yield-generating mechanisms in digital assets. For investors with a multi-year time horizon, reinvested staking rewards compound into a meaningfully different total return profile compared to holding unstaked ETH, and the yield differential relative to Bitcoin widens with each passing year of compounding.
"The Pectra upgrade fundamentally changes the economics of running validators at scale. With EIP-7251 allowing consolidated validator balances up to 2,048 ETH, institutional operators can manage positions more efficiently — and the dramatic reduction in slashing penalties removes one of the key operational deterrents to larger-scale deployments." — Everstake Research Team, Ethereum Staking Insights: Protocol Analysis Annual 2025
The Pectra upgrade, activated in Spring 2025, introduced two changes with direct relevance for stakers at scale. EIP-7251 raised the maximum validator balance from the original 32 ETH to 2,048 ETH, enabling operators to consolidate many individual validators into fewer, larger positions — substantially reducing the operational overhead for institutional staking programs. Simultaneously, the validator slashing penalty was reduced from 1/32 to 1/4096 of effective balance, dramatically lowering the cost of operational errors and software failures. Together, these changes make Ethereum staking materially more accessible and less operationally punishing for the institutional operators who now dominate the staking landscape.
Structural risks, however, remain material and require honest assessment. Software client concentration is the most immediate: the December 2025 outage affecting the Prysm consensus client — which is used by a disproportionately large share of validators — exposed the single-point-of-failure risk embedded in the network's current client diversity profile. If a dominant client suffers a critical bug, a significant portion of the validator set can be simultaneously disrupted. Institutional staker centralization is a related concern: a small number of liquid staking protocols (Lido, Coinbase Staking, and Rocket Pool among them) collectively control a majority of staked ETH, introducing governance concentration and potential censorship risks that core developers continue to address through ongoing protocol design. For investors evaluating ETH, staking yield is a real and durable structural advantage over Bitcoin — but the operational and governance risks of the staking infrastructure layer deserve serious, ongoing diligence rather than a one-time assessment.
Institutional Adoption: Spot ETF Access and Capital Flows
The January 2024 launch of U.S. Bitcoin spot ETFs and the July 2024 launch of Ethereum spot ETFs established a level playing field for institutional access to both assets through regulated, familiar wrapper structures for the first time in their histories. According to Coin Bureau's comparative analysis, Bitcoin ETPs collectively hold approximately 12% of Bitcoin's entire circulating supply, with cumulative net inflows reaching $56 billion since the January 2024 launch — a pace of institutional accumulation without precedent in digital assets. Ethereum's spot ETFs crossed $20 billion in aggregate AUM within roughly eight months of launch; BlackRock's ETHA fund alone reached $16.1 billion in that timeframe. The structural implication is durable: ETF wrappers reduce custody friction for pensions, endowments, and registered investment advisors who face regulatory or policy barriers to direct digital asset custody, creating a demand base that persists independently of retail sentiment cycles.
"Spot ETF approval for both Bitcoin and Ethereum marks a structural inflection point — not a cyclical one. Pension funds and endowments previously restricted from direct crypto custody can now gain exposure through familiar regulated wrappers, creating a durable institutional demand base that simply did not exist in prior market cycles." — Grayscale Research, 2026 Digital Asset Outlook: Dawn of the Institutional Era
A meaningful asymmetry persists between the two products in the U.S. market: Ethereum ETF wrappers do not yet pass through staking yield to shareholders. An investor holding 100 ETH directly and staking it earns 3.5–5% APY annually in additional ETH; the same exposure via a U.S. spot ETF currently earns zero yield on the position. Staking-enabled ETH ETF structures have been approved in certain jurisdictions, and U.S. regulatory decisions on staking passthrough are anticipated through 2026 — a potential catalyst that could substantially narrow the gap between ETF-held and directly-held ETH economics. Until passthrough is approved domestically, direct ETH stakers retain a structural yield advantage that compounds over time and represents real opportunity cost for ETF holders.
Bitcoin ETF inflows have not been uniformly positive: inflows peaked at $5.2 billion in a single month but were followed by net outflows in late 2025 as macro conditions deteriorated. This flow volatility reinforces that institutional adoption, while structurally durable over multi-year periods, is not immune to macro-driven redemption pressure in the near term. The net long-term trajectory — driven by expanding allocations from wealth management platforms, family offices, and eventually pension mandates — represents a demand shift with multi-cycle implications for both assets' liquidity and price discovery dynamics.
Risk Profile: Volatility, Beta, and Asset-Specific Vulnerabilities
Both Bitcoin and Ethereum carry distinct risk profiles that differ meaningfully from each other and from traditional asset classes — and understanding those differences is as important as understanding their return potential. ETH's higher beta is the most frequently cited structural difference: Ethereum amplifies Bitcoin's directional moves, delivering larger percentage gains in bull markets and deeper percentage losses in bear markets relative to BTC. According to Investing.com's performance analysis, both assets have historically recovered from 70–80% peak-to-trough drawdowns across multiple market cycles — but recovery timelines and the severity of interim losses differ significantly. Ethereum's deeper drawdowns require a larger subsequent percentage gain to return to breakeven, making cycle timing substantially more consequential for ETH holders than for Bitcoin holders. Investors who cannot sustain a multi-year drawdown horizon, or who are likely to capitulate near cycle lows, face a higher practical risk from Ethereum's volatility profile than raw return data might suggest.
Bitcoin-specific risks cluster around three areas. First, miner revenue sustainability post-halving: as block rewards decline toward zero over the coming decades, the network's security budget must eventually be sustained by transaction fees alone. At current fee levels, this long-run transition remains an unresolved structural question the market has not fully priced. Second, ETF custody concentration: the rapid accumulation of BTC within a small number of custodians — primarily Coinbase Custody acting on behalf of multiple competing ETF issuers — has introduced a concentration risk that did not exist when Bitcoin's supply was more broadly distributed. Third, regulatory reclassification: while Bitcoin has maintained commodity status under consistent U.S. regulatory treatment, shifts in administration policy or evolving international frameworks could alter its legal classification and affect institutional access pathways.
Ethereum-specific risks are operationally more layered. Smart contract exploits remain an ongoing concern — DeFi protocols on Ethereum have lost billions in exploits across the network's history, and each new protocol expansion increases the attack surface. Staking centralization, as detailed in the previous section, creates governance and censorship risks at the consensus layer itself. The ongoing series of protocol upgrades (Pectra, Fusaka, Glamsterdam, Hegotá) introduces implementation risk and the possibility of unintended state transitions, even with extensive testing. Finally, and perhaps most consequentially for the long-term price thesis, Ethereum's deflationary mechanics depend on base-layer fee revenue that Layer-2 competition has structurally compressed. If fees remain subdued as Layer-2 scaling succeeds, ETH's supply dynamics stay net inflationary rather than deflationary — materially undercutting one of the core long-term bullish narratives for the asset.
Long-Term Allocation Framework: When to Favor BTC, ETH, or Both
Choosing between Bitcoin and Ethereum for a long-term position is not a binary question of which asset will outperform — it is a question of which risk/return profile best fits an investor's specific objectives, constraints, and time horizon. Bitcoin is the appropriate anchor when the investment priority is monetary store of value, regulatory and custody simplicity, maximum institutional ETF liquidity, and minimal exposure to protocol execution risk. Bitcoin's thesis requires no ongoing ecosystem development to hold or validate: scarcity is enforced by mathematics, and the value proposition is essentially fully formed at the protocol level. Ethereum suits the investor who wants native staking yield in the 3.5–5% APY range, direct economic exposure to decentralized finance and real-world asset tokenization ecosystem growth, and who is prepared to actively manage or research the operational dimensions of validator participation, client diversity, and protocol upgrade cycles. According to VanEck's digital asset research team, each asset occupies a structurally distinct role in a well-constructed digital asset allocation, and the decision between them is best framed as a role question, not a performance-prediction question.
"Bitcoin and Ethereum are not substitutes in a portfolio — they serve fundamentally different functions. Bitcoin offers the clearest digital scarcity thesis with minimal protocol complexity; Ethereum offers exposure to a platform whose fee capture and staking mechanics create an entirely different risk and return profile. Historically, holding both has produced better risk-adjusted outcomes than concentrating in either asset alone." — VanEck Digital Assets Research, Bitcoin vs. Ethereum: A Portfolio Perspective
A practical portfolio construction heuristic with historical backing: treat Bitcoin as the base-layer position — larger, lower-beta, structurally anchored to institutional ETF flows and the mechanically predictable halving cycle — and Ethereum as a satellite position with higher upside potential, native yield, and greater sensitivity to the on-chain ecosystem cycle. Historical data from multiple full market cycles supports this framework: portfolios that held both assets on a risk-adjusted basis outperformed single-asset concentrations, with BTC providing relative stability in drawdown phases and ETH contributing to accelerated recovery velocity in bull phases. The specific allocation split between the two is a function of individual risk tolerance, yield requirements, and operational capacity to manage staking mechanics.
Three variables deserve particular attention heading into the remainder of 2026. First, ETH fee revenue recovery: the critical question for Ethereum's long-term value accrual is whether the Glamsterdam and Hegotá upgrades — targeting higher gas limits, enshrined proposer-builder separation, and deeper zkEVM integration — will recapture meaningful base-layer revenue as Layer-2 activity scales further. A sustained return to net-deflationary ETH issuance would represent a material positive catalyst for the asset's long-term price thesis. Second, the Bitcoin halving cycle price lag: historically, Bitcoin's most significant price appreciation has occurred approximately 12–18 months after the halving event. The April 2024 halving places the primary price impact window extending through 2025 and into 2026, suggesting the current drawdown may represent a mid-cycle consolidation rather than a definitive cycle peak — though historical patterns carry no predictive weight in isolation. Third, U.S. regulatory decisions on ETF staking yield passthrough: approval would narrow the direct-hold yield advantage, increase institutional demand for ETH, and potentially re-rate ETH's institutional valuation relative to BTC in ways that are difficult to model in advance.
Frequently Asked Questions
Is Bitcoin or Ethereum a better long-term investment in 2026?
There is no universal answer — the better choice depends entirely on individual investment goals, risk tolerance, and time horizon. Bitcoin suits investors who prioritize monetary scarcity, regulatory simplicity, and access to the deepest institutional ETF liquidity in digital assets (approximately $56 billion in cumulative net inflows since January 2024). Ethereum suits investors who want native staking yield of 3.5–5% APY, direct exposure to decentralized finance and real-world asset tokenization growth, and are prepared to manage the additional operational complexity of the staking and upgrade cycle. According to Motley Fool's 2026 analysis, holding both assets together on a risk-adjusted basis has historically outperformed concentration in either one alone — combining Bitcoin's relative stability in drawdowns with Ethereum's higher recovery velocity in bull phases. For most active retail investors, a split allocation sized to personal risk tolerance represents the most defensible starting framework.
Does Ethereum have a supply cap like Bitcoin's 21 million?
No — Ethereum has no hard supply cap. Unlike Bitcoin's mathematically fixed limit of 21 million coins, Ethereum's supply is governed dynamically by the EIP-1559 base-fee burn mechanism introduced in August 2021. During periods of intense network activity, fee burns exceed new validator issuance, making ETH net deflationary. However, in 2025, subdued on-chain activity tipped the balance into slight net inflation: approximately 563,000 ETH were added to circulating supply, representing roughly +0.46% annual dilution, according to Everstake's 2025 Annual Report. In contrast, Bitcoin's issuance follows a mechanically predetermined declining schedule — post-April 2024 halving, the block reward is 3.125 BTC with an annual inflation rate of approximately 0.85%, declining further at each subsequent halving toward effectively zero by approximately 2140. Bitcoin's supply model is fixed and verifiable; Ethereum's is flexible and activity-dependent.
What annual yield can you earn staking Ethereum?
Staking Ethereum currently delivers approximately 3.5–5% APY in base rewards, paid in ETH — making it the only major digital asset offering native yield at this scale. As of year-end 2025, approximately 36.08 million ETH were staked (roughly 29.3% of total circulating supply), with more than 1.8 million ETH added through 2025 alone, according to Everstake. The Spring 2025 Pectra upgrade improved staking economics through EIP-7251, which raised the maximum validator balance to 2,048 ETH and reduced slashing penalties from 1/32 to 1/4096 of effective balance. Key risks to understand before staking: software client concentration (the December 2025 Prysm outage highlighted this vulnerability), centralization pressure from large liquid staking protocols, and the fact that U.S. spot Ethereum ETF products currently do not pass through staking yield to shareholders — meaning direct stakers retain a structural yield advantage over ETF investors.
How much Bitcoin is currently held in spot ETFs?
Bitcoin exchange-traded products collectively hold approximately 12% of Bitcoin's entire circulating supply, with cumulative net inflows reaching $56 billion since the U.S. spot ETF launch in January 2024, according to Coin Bureau. Bitcoin ETF inflows peaked at $5.2 billion in a single month before experiencing net outflows in late 2025 as macro conditions tightened. Ethereum's spot ETF, which began trading in July 2024, has attracted significantly lower inflows in absolute dollar terms — crossing $20 billion in aggregate AUM, with BlackRock's ETHA fund reaching $16.1 billion approximately eight months after launch. A critical asymmetry to note: U.S. Ethereum ETF products do not currently pass through staking yield to shareholders, representing a meaningful ongoing disadvantage relative to direct ETH holding for any income-oriented investor, and a potential catalyst for increased ETF demand if U.S. regulators approve staking passthrough structures in 2026.
Which asset has the higher 10-year return — Bitcoin or Ethereum?
Ethereum narrowly leads on raw 10-year cumulative return to April 2026: approximately +18,030% versus Bitcoin's +16,200%, according to Motley Fool. However, this headline number requires important context. On an annualized basis since 2017, Bitcoin has delivered approximately 50% per year compared to Ethereum's approximately 33% per year — reflecting Bitcoin's stronger consistency across full market cycles, including extended bear markets where Ethereum's higher volatility eroded gains faster and more deeply. The practical distinction matters for real investors: Ethereum's higher raw cumulative return came with significantly greater volatility and deeper peak-to-trough drawdowns. Bitcoin's lower annualized figure reflects steadier, more consistent compounding with fewer catastrophic drawdown events — a difference that compounds meaningfully for investors who hold through multiple full cycles rather than timing entries and exits with precision.
What the Data Points to Next: Synthesis for Active Investors
Bitcoin and Ethereum have each demonstrated the capacity to survive multiple complete market cycles — including drawdowns of 70–80% from all-time highs — and to subsequently establish new price levels as adoption expanded. The 2026 environment, characterized by elevated Treasury yields, post-halving Bitcoin consolidation, and fee-revenue headwinds for Ethereum at the base layer, presents a more structurally complex backdrop than the straightforward directional trades of prior cycles. Neither asset is best understood through a single narrative: Bitcoin's scarcity thesis is clean and durable, but miner revenue sustainability and ETF custody concentration are legitimate long-run concerns. Ethereum's programmable infrastructure and staking yield are genuine structural advantages, but base-layer fee compression and protocol complexity introduce risks that require ongoing monitoring rather than a one-time diligence check.
For active retail investors evaluating a long-term position in either or both assets, the most actionable framework is grounded in role clarity: Bitcoin as a monetary reserve asset with institutional-grade ETF access, Ethereum as a yield-bearing infrastructure stake with higher ecosystem upside. Holding both — sized proportionally to individual risk tolerance — has historically been more resilient across cycles than concentrated single-asset exposure. The three variables most likely to shift the relative value proposition in the next 12–24 months are Ethereum's base-layer fee recovery trajectory, the U.S. regulatory decision on ETF staking yield passthrough, and the progression of Bitcoin's historically lagged post-halving price cycle. Each warrants active monitoring rather than a passive, set-and-forget posture.
Position sizing, time horizon clarity, and custody security remain as consequential as asset selection. Both Bitcoin and Ethereum have rewarded disciplined, long-horizon holders across every completed market cycle — but that track record does not establish any form of recurrence or eliminate the real possibility of extended drawdown periods that test the resolve of even experienced investors.
Last updated: 2026-05-13. This article was reviewed against the latest available market data, ETF flow figures, and Ethereum protocol documentation as of May 2026. Supply figures, staking statistics, and ETF flow data are updated as primary sources publish; verify linked sources for the most current figures before making allocation decisions.
Related Articles
- Best Liquid Staking Protocols 2026: ETH, SOL & BTC Yields
- Crypto Market May 2026: TON Surge, BTC ETF Flows Explained
- Bitcoin vs Ethereum 2026: Store of Value or Programmable Money?
- Bitcoin vs Ethereum 2026: Which Is the Better Long-Term Hold?
- Crypto Market Analysis: Bitcoin Outlook, Altcoins & Regulation