Crypto markets are flashing cautious recovery signals on April 22, 2026 — the same day Iran's ceasefire negotiation deadline falls. Total market cap stands at $2.63T, BTC dominance holds at 57.5%, and the Fear & Greed Index has bounced to 33, snapping a record-breaking 59-day streak of extreme fear. Whale accumulation reached a 13-year high over the past 30 days, and institutional ETF inflows continue to build momentum.
Global Market Snapshot — April 22, 08:00 KST
Quick Answer: As of April 22, 08:00 KST, total crypto market cap is $2.63T with BTC dominance at 57.5%. Fear & Greed Index: 33 (Fear, +4 vs. yesterday). BTC trades at $75,640 on Binance (-0.34%). Crypto whales accumulated 270,000 BTC over 30 days — the largest monthly buy since 2013.
| # | Coin | Price | 24h Change | Volume (24h) | High | Low |
|---|---|---|---|---|---|---|
| 1 | USDC | $1.00 | +0.01% | $2.8B | $1.00 | $1.00 |
| 2 | BTC | $75,640 | -0.34% | $1.1B | $76,927.57 | $74,821.57 |
| 3 | ETH | $2,311 | -0.23% | $522.4M | $2,338.75 | $2,284.19 |
| 4 | SOL | $85 | -0.26% | $180.2M | $86.89 | $84.31 |
| 5 | XRP | $1.42 | -0.16% | $121.6M | $1.45 | $1.41 |
| 6 | RLUSD | $1.00 | +0.00% | $88.2M | $1.00 | $1.00 |
| 7 | USD1 | $1.00 | +0.02% | $86.7M | $1.00 | $1.00 |
| 8 | ZEC | $310 | -0.80% | $73.3M | $335.82 | $306.46 |
| 9 | BNB | $629 | +0.05% | $66.0M | $640.70 | $625.00 |
On OKX, two tokens stood out sharply: CORE surged +24.66% and BASED gained +13.74%, signaling elevated speculative appetite in lower-cap tokens even as major assets consolidate. Total 24-hour global crypto volume reached $99.3B across 17,549 active assets.
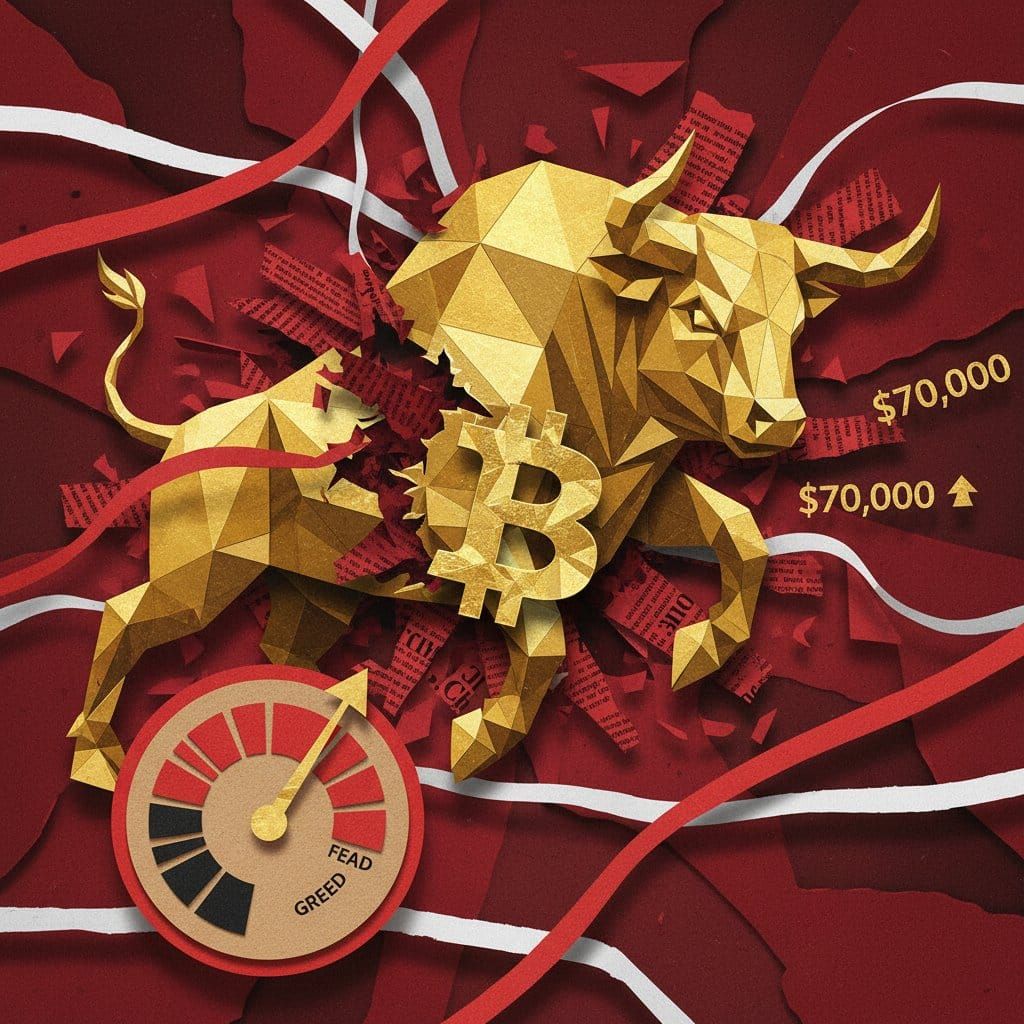
Fear & Greed at 33 — Is the Worst Behind Us?
The Fear & Greed Index climbed to 33 today — up 4 points — but the bigger story is the context. Earlier in 2026, the index spent 59 consecutive days below 15 (extreme fear), the longest such streak in crypto history — more than double the ~30-day extreme fear window that followed Terra/Luna's collapse in June 2022 (source: feargreedmeter.com). A reading of 33 does not signal euphoria, but it marks a genuine regime shift off an historic trough.
Historically, buying when the index falls below 30 has produced median 90-day returns of +38.4%. At 33, we are just above that threshold — a nuance worth watching for investors evaluating entry timing. Adding to the complexity, the weekly MACD bear phase will reach 245 days by month-end, matching the exact duration of the 2018 and 2022 bear markets — historically a cycle-bottom signal.
Today is also the Iran ceasefire negotiation deadline, injecting a live geopolitical variable. Matt Hougan, CIO of Bitwise Asset Management, frames the dynamic: "When nations feud, the incentive to deal with apolitical money like bitcoin goes up. We should increasingly expect it to act as a hedge against geopolitical chaos."
Technically, a weekly MACD bull cross is forming on BTC charts. The last confirmed signal in May 2025 drove BTC from $94,000 to $119,000 — a +$25,000 gain (~26.6%, source: CoinTelegraph). Applying the same magnitude from the current $75,640 level targets $95,000–$100,000. The primary cap, however, is $84,000 — the average cost basis of US spot BTC ETF holders, representing the most concentrated near-term resistance in the market.
$396M Liquidated in 24 Hours — Derivatives Deep Dive
| Coin | Funding Rate | Open Interest | Long / Short |
|---|---|---|---|
| BTC | -0.0042% | $7.2B | 46.3% / 53.7% |
| ETH | -0.0037% | $4.9B | 65.2% / 34.8% |
| SOL | -0.0001% | $796.3M | 69.5% / 30.5% |
| XRP | +0.0061% | $390.4M | 70.6% / 29.4% |
| DOGE | 0.0000% | $205.0M | 73.7% / 26.3% |
| BNB | 0.0000% | $337.7M | — |
| AVAX | +0.0100% | $81.7M | — |
| LINK | +0.0071% | $81.2M | — |
Total 24-hour liquidations reached $396M on April 21 (source: WEEX): $202M in longs and $194M in shorts, affecting 132,038 traders. The single largest position wiped was a $6.43M BTC-USD trade on Hyperliquid.
The BTC breakdown is telling: $80.45M in shorts were liquidated vs. $55.98M in longs — shorts absorbed the bigger hit, a dynamic that historically precedes short-squeeze acceleration. ETH was more balanced: $67.54M longs vs. $64.42M shorts.
On Binance futures, both BTC and ETH carry negative funding rates (-0.0042% and -0.0037%) — shorts are actively paying longs to hold positions. With BTC sitting at 53.7% short / 46.3% long, a bullish catalyst could rapidly force short covering and amplify any upside move. XRP presents the opposite risk: 70.6% long with positive +0.0061% funding — one of the most crowded long setups in the market and vulnerable to a flush if momentum fades.
Whale Accumulation at a 13-Year High
Crypto whales accumulated 270,000 BTC over the past 30 days — the largest monthly whale buy since 2013 — while exchange BTC reserves simultaneously fell to a 7-year low, reducing available sell-side supply (source: SpotedCrypto's on-chain analysis). The structural supply squeeze this creates is significant.
Strategy (formerly MicroStrategy) leads the institutional cohort with 766,970 BTC at an average cost of $66,384 ($33.14B total), adding 22,337 BTC worth $1.57B in March 2026 alone. When a Satoshi-era whale moved 1,000 BTC ($74M) to exchanges last week, Strategy reportedly absorbed 17,204 BTC within 48 hours to stabilize price near $74,100.
The institutional breadth is widening. Bitmine made the largest institutional ETH purchase of 2026, buying 101,627 ETH ($230M+) in a single week. A Nomura survey from April 19 found that 65% of institutional investors now view crypto as a "vital portfolio diversifier" — a major sentiment shift. Deutsche Börse's $200M investment in Kraken further underscores TradFi's deepening commitment to crypto infrastructure.
Morgan Stanley ETF Tops $100M — US Bitcoin ETF AUM Crosses $150B
Morgan Stanley's Bitcoin ETF surpassed $100M in first-week inflows (source: The Market Periodical, April 21, 2026). It joins an already historic ETF landscape: cumulative US spot Bitcoin ETF net inflows have reached $57.08B, with total AUM now exceeding $150B (source: farside.co.uk). In the most recent weekly period, BTC ETF inflows hit $996M; XRP ETFs attracted $55M and Solana ETFs $35M.
Regulatory Headwinds: NY AG Lawsuit and Senate Clarity Act Stall
New York's Attorney General filed suit against Coinbase and Gemini, alleging their prediction market services violate state gambling laws (source: CoinDesk). The case adds regulatory uncertainty for platforms straddling the line between financial derivatives and wagering products.
The Senate's Clarity Act — designed to clarify digital asset market structure — remains stalled by disputes over stablecoin yield provisions as 2026 floor time runs short. James Butterfill, Head of Research at CoinShares, sees resolution as the market's missing catalyst: "Regulation has been a persistent overhang; resolution here would be a meaningful catalyst." His 2026 BTC price target range is $120,000–$170,000 (source: CoinShares Research Blog).
BTC dominance at 57.5% carries a notable historical parallel. As SpotedCrypto's BTC dominance tracker highlights, the same 57% level in March 2021 preceded the most explosive altcoin rally in crypto history. The Altcoin Season Index currently sits at 47 — rotation has not yet materialized, but structural conditions are forming.
Key Levels and Watchlist for Today
- Iran ceasefire deadline (today): A deal could reduce BTC's geopolitical premium; a breakdown could spike short-term volatility in either direction.
- BTC $84,000 resistance: The average spot ETF cost basis — clearing this level is the key signal for a confirmed trend reversal.
- Weekly MACD bull cross: May 2025 precedent drove +26.6%; from $75,640 that same gain targets $95K–$100K.
- Short squeeze watch: BTC at 53.7% short with -0.0042% funding — any bullish catalyst could trigger rapid covering and amplify gains.
- XRP long flush risk: 70.6% long at +0.0061% funding — most crowded long in the market, vulnerable if momentum stalls.
- Small-cap volatility: OKX's CORE (+24.66%) and BASED (+13.74%) signal active speculative rotation in lower-cap tokens.
Frequently Asked Questions
Is a Fear & Greed reading of 33 a buying opportunity?
Historically, entries below 30 on the Fear & Greed Index have produced median 90-day returns of +38.4%. At 33, we are marginally above that threshold. The setup is constructive, but near-term wildcards — the Iran ceasefire outcome, BTC's $84K resistance ceiling, and the stalled Clarity Act — argue for a gradual accumulation approach over concentrated entry. Historical patterns suggest patience at this stage tends to outperform urgency.
What does a negative BTC funding rate signal for traders?
A negative funding rate (-0.0042% on Binance) means short sellers are paying long holders to keep positions open — indicating bearish skew in derivatives markets. Counterintuitively, this creates a contrarian bullish setup: if a catalyst triggers upside, forced short covering can rapidly amplify the move. The April 21 data already illustrated this dynamic in miniature: $80.45M in BTC shorts were liquidated vs. only $55.98M in longs.
For daily crypto market briefings and on-chain data analysis, visit SpotedCrypto.
This article is for informational purposes only and does not constitute financial or investment advice. Cryptocurrency investments are highly volatile and carry significant risk. Always conduct your own research and consult a qualified financial professional before making investment decisions.
Related Articles
- Fear Index Holds at 29 as Bitcoin ETFs Cross $56B — Strategy Overtakes BlackRock
- Crypto Market Briefing April 20: Kelp DAO $292M Hack, BTC Battles $75K Support, Fear Index at 27
- API3 +24%, AXL +13% as Fear & Greed Hits 26 — April 19 Crypto Market Briefing
- Extreme Fear at 21: ETH Surges +3.88%, PENDLE +14% While ORDI and BIO Crash — April 18 Crypto Briefing
- Fear & Greed 23: AXL +47%, ORDI Explodes +136%, Whales Stack 270K BTC [April 17 Briefing]