Fear Index at 26: Top 4 Cryptos to Buy the Dip in 2026, Backed by Data
Fear & Greed at 26, whales buying 56,227 BTC. Four data-verified rebound picks: BTC, ETH, SOL, XRP.

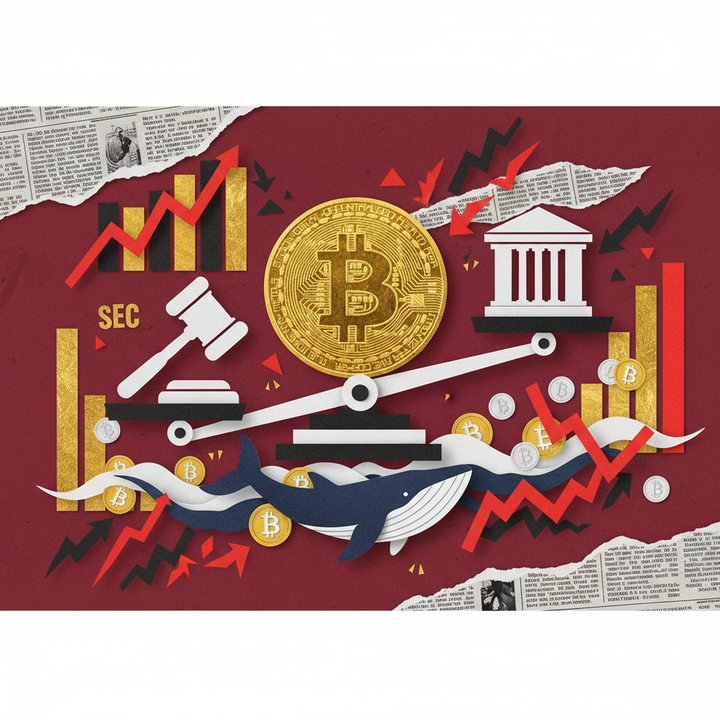
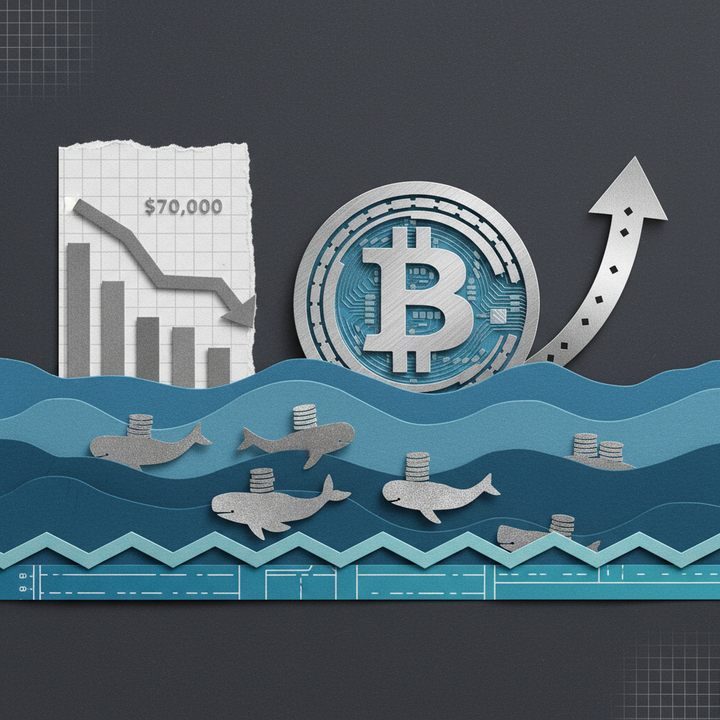
The crypto Fear & Greed Index has plunged to 26—a level historically associated with market bottoms and powerful multi-month reversals. With Bitcoin trading at $74,174 after a 41% drawdown from its 52-week high, whale wallets are accumulating at the fastest pace since late 2022. Here are four data-backed cryptocurrencies positioned to lead the 2026 recovery.
Why Buy at a Fear Index of 26? Core Summary
Quick Answer: The Crypto Fear & Greed Index at 26 marks a historically proven accumulation zone—after the index hit 10–15 during the 2022 FTX collapse, Bitcoin surged over 100% within 12 months. Whale addresses have added 56,227 BTC since December 2025, a 3.7% holdings increase signaling institutional conviction at current prices.
The Crypto Fear & Greed Index is a composite sentiment metric ranging from 0 (extreme fear) to 100 (extreme greed), aggregating volatility, volume, social media activity, and market momentum into a single reading. As of March 18, 2026, the index sits at 26, firmly in "Fear" territory, according to data from CoinDesk. This level echoes the extreme fear zone of 10–15 recorded during the FTX collapse in November 2022—a period that preceded a 100%+ Bitcoin rally over the following 12 months, per Bitcoinist. Critically, the current 41% drawdown from Bitcoin's 52-week high of $126,079 is structurally shallower than the 77% decline in 2022 or the 84% crash in 2018, suggesting institutional participation through spot ETFs and corporate treasuries is compressing downside volatility. For investors with a 3–6 month horizon, history suggests fear-driven sell-offs at this magnitude represent asymmetric buying opportunities.
Top 4 Cryptocurrencies to Buy: Overview
| Asset | Current Price | Target Price | Upside Potential | Risk Grade |
|---|---|---|---|---|
| BTC | $74,174 | $112,000 (Citi Base) | +51% | Moderate |
| ETH | $2,327 | $3,175 (Citi Base) | +36% | Moderate-High |
| SOL | $94.19 | $252 (ATH Retest) | +168% | High |
| XRP | $1.53 | $2.50 (Consensus) | +63% | Moderate-High |
Historical Fear Index Reversals: A Proven Pattern
History doesn't repeat, but it rhymes—especially in crypto sentiment cycles. During the FTX-driven panic of November 2022, the Fear & Greed Index collapsed to 10–15 while Bitcoin bottomed near $15,500. Within 12 months, BTC had rallied past $35,000—a gain exceeding 100%. The 2018 bear market offers an even starker comparison: Bitcoin plunged 84% from its $20,000 peak to $3,200 before staging a multi-year recovery, according to The Motley Fool. Today's 41% drawdown is roughly half the severity of those prior cycles, largely because institutional Bitcoin adoption through ETFs and corporate treasuries has created structural demand floors that didn't exist in earlier markets.
On-chain data reinforces the bullish accumulation thesis. According to Glassnode, whale addresses holding 1,000+ BTC have added 56,227 BTC since December 2025—a 3.7% increase in aggregate holdings worth over $4.1 billion at current prices. This "smart money" behavior stands in sharp contrast to retail-driven selling, a divergence that has historically preceded major trend reversals.
"Historically, buying during periods of fear has been more effective than buying during euphoria." — Rony Szuster, Head of Research, Mercado Bitcoin (CoinDesk)
Bitcoin's negative funding rate of -0.0066% on Binance perpetuals further confirms that the derivatives market is skewed bearish—a contrarian signal that often precedes short squeezes. Combined with the total crypto market cap of $2.62 trillion and BTC dominance at 56.7%, the current setup mirrors the late-stage fear environments that have historically rewarded patient buyers within 3–6 months.
#1 Pick: Bitcoin (BTC) — Institutional Buy Walls Creating Downside Support
Bitcoin is the world's largest cryptocurrency by market capitalization, currently trading at $74,174 on Binance with a 24-hour range of $73,399 to $74,894. Citigroup revised its 12-month base-case target to $112,000 on March 17, 2026, representing 51% upside from current levels, with a bull-case scenario of $165,000 (+122%). The investment bank's bear case of $58,000 reflects risks from delayed U.S. crypto legislation—specifically the Clarity Act—and persistent interest rate uncertainty. Despite $7.8 billion in net outflows from spot BTC ETFs since November, this figure represents only 12% of the $61.6 billion in cumulative inflows since January 2024, maintaining a structurally net-positive positioning. Meanwhile, MicroStrategy continues its accumulation strategy, purchasing 17,994 BTC in a single week, while Bitwise projects that ETFs will absorb more than 100% of newly mined Bitcoin supply in 2026—approximately 166,000 BTC worth $15.3 billion.
BTC Data Card
| Metric | Value |
|---|---|
| Current Price | $74,174 |
| Citi Base Target (12M) | $112,000 (+51%) |
| Citi Bull Target | $165,000 (+122%) |
| Citi Bear Target | $58,000 (-22%) |
| 52-Week Range | $60,255 – $126,079 |
| Funding Rate (Binance) | -0.0066% |
| BTC Dominance | 56.7% |
ETF Flows: Net Positive Despite Recent Outflows
The narrative around BTC ETF outflows has dominated headlines, but the full picture tells a fundamentally different story. The $7.8 billion in outflows since November represents a modest 12% retracement against $61.6 billion in total inflows—leaving the spot Bitcoin ETF ecosystem firmly in net accumulation territory, according to CoinDesk. This institutional demand floor is fundamentally different from previous bear markets, where no regulated spot vehicle existed to absorb selling pressure.
MicroStrategy's relentless buying—17,994 BTC in a single week—illustrates how corporate treasuries now act as structural demand anchors. Bitwise's 2026 outlook predicts ETFs will purchase approximately 166,000 BTC worth $15.3 billion, effectively absorbing more than 100% of the roughly 164,250 BTC expected to be mined this year. This supply-demand imbalance creates what Matt Hougan, CIO at Bitwise, calls a "breakout year for crypto," where the traditional four-year halving cycle may be overridden by persistent institutional inflows.
Gold-Denominated Bottom Signal
One of the most compelling technical arguments for a near-term BTC bottom comes from its pricing against gold. With gold reaching $5,280—an 80%+ gain over the past year—Bitcoin's gold-denominated value peaked in January 2025 and has been declining ever since. Applying the historical bear market duration of 12–13 months, the gold-denominated bottom aligns with Q1 2026 (February–March), while the USD-denominated bottom is projected for late 2026, according to analysis published by CoinDesk. This dual-bottom framework suggests that even if Bitcoin experiences further USD-price weakness, the current window already represents peak value destruction relative to hard assets—making it a strategic entry point for long-term holders.
"ETF demand where we reduce the assumption to $10 billion [BTC] and $2.5 billion (ETH) is still the most important positive factor." — Alex Saunders, Analyst, Citigroup (CoinDesk)
Key Risks to Monitor
Investors should weigh two primary downside catalysts. First, the U.S. Clarity Act—a comprehensive crypto regulatory framework designed to classify digital assets—has stalled in committee, removing what had been a key bullish catalyst for institutional adoption. Second, if the Federal Reserve delays interest rate cuts beyond Q3 2026, risk assets including Bitcoin could face additional selling pressure, with Citigroup's bear case projecting a decline to $58,000—a further 22% downside from current levels. However, the convergence of whale accumulation (56,227 BTC added since December per Glassnode), negative funding rates (-0.0066%), and ETF demand floors suggests the risk-reward profile strongly favors long positions at current prices for investors with a 6–12 month time horizon.
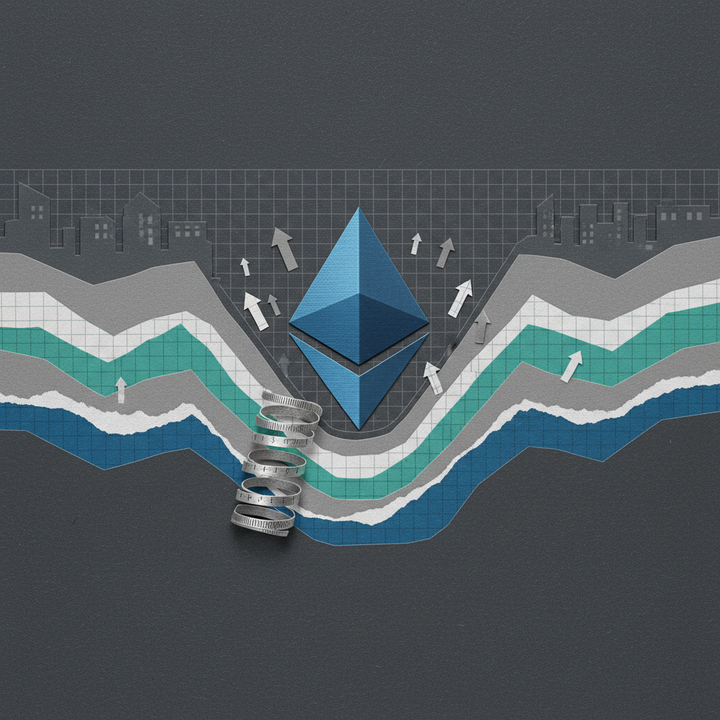
#2 Pick: Ethereum (ETH) — $136B DeFi TVL and the Strongest Developer Ecosystem in Crypto
Ethereum is trading at $2,328 as of March 18, 2026 — a 53% decline from its 52-week high of $4,946 — yet it continues to anchor the entire decentralized finance landscape with over $136 billion in total value locked, the largest of any blockchain, according to OSL Research. With 31,869 monthly active developers recorded through late 2025, Ethereum commands the most expansive builder community in the entire crypto industry by a considerable margin, per analysis from The Motley Fool. The network's Binance perpetual funding rate sits at a neutral 0.0015%, indicating balanced derivatives positioning with neither excessive leveraged longs nor panic-driven shorts in the current market. For investors evaluating which digital assets offer the strongest fundamental recovery thesis during a Fear & Greed reading of 26, Ethereum's unmatched combination of institutional-grade infrastructure, developer depth, and DeFi dominance positions it as a high-conviction candidate at current deeply discounted price levels.
Ethereum Price Targets and Key Metrics
| Metric | Value | Source |
|---|---|---|
| Current Price | $2,328 | Binance (Mar 18, 2026) |
| 52-Week Range | $1,398 – $4,946 | The Motley Fool |
| Citi Base Target (12-mo) | $3,175 (+36%) | CoinDesk / Citigroup |
| Citi Bull Target | $4,488 (+93%) | CoinDesk / Citigroup |
| Citi Bear Target | $1,198 (−49%) | CoinDesk / Citigroup |
| DeFi TVL | $136B+ | OSL Research |
| Active Developers | 31,869 | The Motley Fool |
| Binance Funding Rate | 0.0015% | Binance |
| Projected ETF Buying (2026) | ~960,000 ETH ($3.0B) | Bitwise Investments |
The Developer Moat: Why 31,869 Builders Change Everything
Ethereum's developer count of 31,869 is not just a vanity metric — it represents a self-reinforcing flywheel of innovation, security auditing, and protocol upgrades that no competing chain has replicated at this scale. This developer density directly sustains Ethereum's $136 billion DeFi TVL, which dwarfs the next-largest competitor at nearly 14 times Solana's approaching $10 billion. As The Motley Fool highlighted, Ethereum remains "the largest blockchain-based developer ecosystem," and that structural advantage compounds over time through more dApps, better tooling, and the deeper liquidity pools that institutional allocators demand before deploying capital at scale. For a broader look at how developer metrics correlate with crypto recovery signals in 2026, ecosystem depth remains the single most reliable leading indicator of sustainable price recovery.
ETF Demand: A Structural Supply Squeeze on the Horizon
Bitwise Investments projects that spot ETH ETFs could purchase approximately 960,000 ETH — roughly $3.0 billion — throughout 2026, absorbing a significant portion of new ETH issuance and creating supply-side pressure reminiscent of what drove Bitcoin's post-ETF rally in 2024. Cross-exchange pricing data currently shows Ethereum trading at a slight discount on major Asian exchanges relative to Western platforms, a pattern historically associated with undervaluation during fear-driven selloffs. When regional premiums normalize during recovery phases — as they reliably have following the 2022 and 2024 corrections — this dynamic provides an additional price tailwind. Combined with the network's post-merge deflationary issuance mechanics, ETF accumulation could fundamentally tighten the available float for retail and institutional buyers alike.
Key Risks: Citi Bear Case and Intensifying DeFi Competition
Citigroup's bear scenario places ETH at $1,198 — a further 49% decline from today's price — according to CoinDesk. This downside target reflects a scenario where U.S. crypto legislation continues to stall, particularly the Clarity Act, and ETF inflows significantly disappoint expectations. Simultaneously, Solana's DeFi TVL surged 340% over the past year, steadily eroding Ethereum's once-unchallenged market share in decentralized exchanges and lending protocols. While Ethereum's absolute dominance remains intact at $136B versus Solana's $10B, the competitive trajectory is narrowing rapidly. Investors analyzing Ethereum's long-term DeFi positioning should monitor the ETH-to-SOL TVL ratio as a leading indicator of shifting institutional capital allocation within the decentralized finance sector.
#3 Pick: Solana (SOL) — Fastest Developer Growth Rate and 340% TVL Surge Signal Breakout Potential
Solana is priced at $94.19 with a market capitalization of $54 billion — down a staggering 63% from its 52-week high of $252.78 — making it the most deeply discounted major Layer 1 blockchain relative to its recent peak, according to data from The Motley Fool. Despite this sharp correction, Solana's on-chain fundamentals tell a strikingly different story: its DeFi total value locked surged an extraordinary 340% between 2024 and 2025, approaching the $10 billion milestone, per OSL Research. The network now hosts 17,708 active developers and is attracting new builders at a pace that outstrips every other blockchain ecosystem in the industry. With a Binance funding rate of −0.0009%, derivatives markets reflect a slightly bearish lean — a contrarian signal that has historically preceded sharp recoveries when underlying adoption metrics remain as robust as Solana's current trajectory demonstrates.
Solana Price Data and Key Metrics
| Metric | Value | Source |
|---|---|---|
| Current Price | $94.19 | Binance (Mar 18, 2026) |
| Market Cap | $54B | The Motley Fool |
| 52-Week Range | $70.61 – $252.78 | The Motley Fool |
| Distance from 52-Week High | −63% | Calculated |
| DeFi TVL | ~$10B (340% YoY growth) | OSL Research |
| Active Developers | 17,708 | The Motley Fool |
| Binance Funding Rate | −0.0009% | Binance |
| Projected ETF Buying (2026) | ~23M SOL ($3.2B) | Bitwise Investments |
Developer Velocity: Outpacing Every Competitor in the Industry
While Ethereum still leads in absolute developer count with 31,869 builders, Solana's 17,708 active developers represent the fastest-growing builder community in the entire blockchain industry. Leo Sun, contributing analyst at The Motley Fool, emphasized that Solana is "gaining new developers at a much faster rate" than its competitors — a trend that typically precedes ecosystem expansion, new application launches, and sustained capital inflows. This accelerating developer velocity directly fueled Solana's 340% DeFi TVL explosion, as emerging protocols across DEXs, lending markets, and liquid staking attracted billions in capital from both retail and institutional participants. For investors tracking the best crypto to buy during market corrections, developer growth velocity is among the most reliable leading indicators of future price appreciation in blockchain assets.
The SOL ETF Catalyst: $3.2 Billion in Projected Institutional Demand
Bitwise Investments forecasts that a potential spot SOL ETF could drive purchases of approximately 23 million SOL — worth an estimated $3.2 billion — throughout 2026. Remarkably, this projected figure exceeds Bitwise's own $3.0 billion ETH ETF estimate, underscoring the outsized institutional appetite for Solana exposure at current price levels. Multiple asset managers have already filed SOL ETF applications with the U.S. SEC, and approval expectations continue to build as the regulatory framework for crypto exchange-traded products matures. If approved, the supply dynamics would be extraordinary: $3.2 billion in buying against a $54 billion market cap means ETF vehicles alone could absorb nearly 6% of Solana's entire circulating value, creating a demand shock that would dwarf typical spot market trading flows.
Key Risks: Ecosystem Maturity and Elevated Volatility Profile
Solana's 63% decline from its 52-week high of $252.78 exposes the double-edged nature of its volatility profile — the same momentum that delivered outsized gains during the 2024–2025 rally amplified losses during the Q1 2026 correction. Compared to Ethereum's battle-tested infrastructure, Solana's ecosystem remains relatively young, with fewer audited protocols and a shorter track record of sustained institutional-grade participation. Network reliability concerns, while significantly improved from the outage-prone era of 2022–2023, still weigh on conservative allocators who prioritize uptime guarantees above all else. Investors should also note that SOL's current price sits just 33% above its 52-week low of $70.61, suggesting limited downside cushion if broader market sentiment deteriorates further. For those evaluating high-growth altcoin opportunities in 2026, disciplined position sizing and systematic dollar-cost averaging remain essential risk management strategies for this higher-beta allocation within a diversified crypto portfolio.
#4 Pick: XRP — Flips BNB in Market Cap as Futures Open Interest Surges 59%
XRP has emerged as the standout mover among large-cap cryptocurrencies this week, surging 11% to $1.53 and reclaiming the fourth-largest market capitalization at $93.4 billion. This rally pushed XRP decisively past BNB's $90.8 billion valuation, marking a significant shift in the competitive hierarchy among top-five digital assets. According to CoinDesk, XRP's momentum is underpinned by a dramatic 59% increase in Binance futures open interest—climbing from 222.79 million to 353.49 million XRP tokens—while trading volume exploded 125% to $3.22 billion in a single session. The derivatives market surge signals aggressive positioning by both institutional and retail traders, a pattern historically associated with sustained directional moves. With the broader market locked in fear territory at a sentiment score of 26, XRP's relative strength represents a compelling contrarian signal for risk-tolerant investors.
Derivatives Snapshot: Open Interest and Volume Breakdown
| Metric | Previous | Current | Change |
|---|---|---|---|
| Futures OI (XRP tokens) | 222.79M | 353.49M | +58.7% |
| 24h Futures Volume | $1.43B | $3.22B | +125.2% |
| Funding Rate (Binance) | — | +0.0015% | Neutral |
| Spot Price | $1.38 | $1.53 | +10.9% (7d) |
| Market Cap Rank | #5 ($84.2B) | #4 ($93.4B) | BNB flipped |
Sources: Coinglass, CoinDesk — Data as of March 18, 2026
Exchange Volume Trends and Global Momentum
XRP's rally is not confined to a single exchange or region. On Binance—the world's largest derivatives venue—XRP has climbed into the top four by 24-hour spot volume, registering alongside BTC, ETH, and USDC at the time of writing. The open interest rebuild toward pre-crash levels suggests traders are positioning for a continuation move rather than a short-term scalp. Critically, the current Binance funding rate of +0.0015% remains effectively neutral, indicating balanced positioning between longs and shorts. This lack of extreme funding rate skew contrasts favorably with overheated rallies, where rates above +0.03% often precede sharp corrections. For a deeper look at XRP's technical outlook and key price levels, our dedicated analysis tracks real-time support and resistance zones alongside on-chain flow data.
Key Risks: Overheated Leverage and Liquidation Cascades
The 59% open interest surge demands caution. Rapid OI expansion without proportional spot accumulation often creates fragile market structures where cascading liquidations amplify downside moves. In XRP's case, the 125% volume increase partially mitigates this concern, but a sudden reversal below $1.40 could trigger forced liquidations among leveraged longs accumulated during the past week. Historically, XRP's beta to broad market sentiment ranks among the highest in the top ten—it falls faster in risk-off environments and rallies harder during reversals. Traders should monitor the Coinglass liquidation heatmap for concentrations near the $1.38–$1.42 zone, which represents the prior breakout level and the most likely stop-loss cluster. A decisive daily close below this range on elevated volume would invalidate the bullish thesis and suggest profit-taking has overwhelmed fresh demand.
Comparative Analysis: Upside Potential, Risk Matrix, and Investor Fit Across All 4 Picks
Selecting the right asset during a fear-driven market requires more than conviction—it demands a structured framework that balances upside potential against downside exposure. With the Fear and Greed Index at 26 and BTC trading 41% below its 52-week high of $126,079 according to The Motley Fool, each of the four recommended assets occupies a distinct position on the risk-reward spectrum. Citigroup's revised targets—$112,000 for BTC and $3,175 for ETH as reported by CoinDesk—provide institutional-grade benchmarks, while Bitwise's prediction that BTC, ETH, and SOL will each reach new all-time highs in 2026 reflects a more aggressive outlook. The matrix below synthesizes these perspectives into an actionable comparison, enabling investors to align portfolio allocation with individual risk tolerance and time horizon.
Full Comparison Matrix
| Metric | BTC | ETH | SOL | XRP |
|---|---|---|---|---|
| Current Price | $74,174 | $2,327 | $94.19 | $1.53 |
| Analyst Target | $112,000 (Citi) | $3,175 (Citi) | $252+ (Bitwise ATH) | $2.50+ (Consensus) |
| Upside Potential | +51% | +36% | +168% | +63% |
| Bear Scenario | $55,000 (−26%) | $1,400 (−40%) | $55 (−42%) | $0.80 (−48%) |
| 52-Week Range | $60,255–$126,079 | $1,398–$4,946 | $70.61–$252.78 | $0.95–$3.40 |
| Funding Rate | −0.0066% | +0.0015% | −0.0009% | +0.0015% |
| Risk Grade | Low–Medium | Medium | High | High |
| Best Fit | Conservative | Balanced | Aggressive | Aggressive |
| Key Catalyst | ETF flows, whale accumulation | DeFi TVL $136B, dev ecosystem | Dev growth 17,708 active, TVL $10B | OI surge +59%, market cap flip |
Sources: CoinDesk, Coinglass, Bitwise, The Motley Fool — Data as of March 18, 2026
Portfolio Strategy by Investor Profile
Conservative investors should anchor allocations in BTC and ETH, which together offer institutional validation through spot ETFs and structural demand from entities like MicroStrategy—which purchased 17,994 BTC in its most recent weekly disclosure according to Capital.com. A 60/40 BTC/ETH split limits maximum drawdown to approximately 26–40% in bear scenarios while maintaining exposure to both the store-of-value and DeFi ecosystem narratives. Aggressive investors seeking asymmetric returns can extend into SOL and XRP, where upside ranges from 63% to 168% but comes paired with 42–48% drawdown risk. A barbell approach—70% BTC/ETH core and 30% SOL/XRP satellite—balances institutional safety with altcoin momentum. Explore our complete guide to the best cryptocurrencies to buy in 2026 for additional allocation frameworks tailored to different capital sizes.
Regional Premium Dynamics as a Contrarian Indicator
Cross-exchange premium data reveals an often-overlooked signal: the spread between Asian exchange prices and global benchmarks has inverted to approximately −0.68% to −0.70%, indicating that regional retail sellers are currently more aggressive than buyers. This negative premium—historically tracked as the "Kimchi premium" when positive—has reliably preceded local market rebounds when inverted. Similar negative premium episodes in June 2022 and September 2024 both marked intermediate bottoms within 30 to 45 days. Additionally, the BTC-to-gold ratio provides macro context: with gold at $5,280—up over 80% year-over-year per CoinDesk—BTC's relative underperformance suggests significant mean-reversion potential as macro headwinds ease.
Structural Shift: Why Q1 2026 Is Not Q1 2022
The Q1 2026 correction shares surface-level similarities with Q1 2022—both followed euphoric policy-driven rallies and saw rapid sentiment deterioration. However, the structural backdrop has fundamentally transformed. In 2022, no spot BTC or ETH ETFs existed; today, ETF infrastructure has absorbed $61.6 billion in cumulative inflows, with only $7.8 billion (12%) flowing out since November. Bitwise projects ETFs will purchase over 100% of new BTC supply in 2026—roughly 166,000 BTC worth $15.3 billion. Meanwhile, whale addresses holding 1,000+ BTC added 56,227 BTC since December 2025—a 3.7% increase per Glassnode data cited by Capital.com. This institutional absorption layer simply did not exist four years ago, providing a structural demand floor that makes a 2022-style 77% drawdown far less probable in the current cycle.
2026 Second-Half Outlook: Historical Returns From Buying the Fear
History suggests that buying crypto during periods of extreme fear delivers outsized returns—and the current Fear & Greed Index reading of 26 places the market squarely in one of those windows. When the index plunged to extreme fear levels (10–15) during the FTX collapse in mid-2022, investors who accumulated Bitcoin during that period saw gains exceeding 100% within 12 months as BTC surged from below $16,000 to over $34,000 by late 2023, according to CoinDesk. The pattern is consistent across multiple cycles: the 2018 bear market bottom at $3,200 preceded a rally to $14,000 within eight months. Today's drawdown of approximately 41% from Bitcoin's 52-week high of $126,079 is notably shallower than the 77% decline in 2022 or the 84% crash in 2018, suggesting institutional infrastructure—including spot ETFs and corporate treasury buyers—is structurally limiting downside. For investors with a 6–12 month horizon, the data overwhelmingly favors accumulation during fear.
Rony Szuster, Head of Research at Mercado Bitcoin, reinforces this thesis: "Historically, buying during periods of fear has been more effective than buying during euphoria," he told CoinDesk. The current setup mirrors previous accumulation phases: BTC funding rates on Binance sit at -0.0066%, indicating short-heavy positioning that historically precedes short squeezes and trend reversals. Meanwhile, whale wallets holding 1,000+ BTC have added 56,227 BTC since December 2025—a 3.7% increase in holdings, per Glassnode data. This combination of negative sentiment, bearish derivatives positioning, and large-scale accumulation has historically marked the transition from distribution to markup phases.
Bitwise's Bullish Case: New All-Time Highs Across the Board
Bitwise Investments projects BTC, ETH, and SOL will all reach new all-time highs in 2026. The firm estimates that ETFs alone will absorb more than 100% of new annual supply—approximately 166,000 BTC ($15.3 billion), 960,000 ETH ($3.0 billion), and 23 million SOL ($3.2 billion). Matt Hougan, CIO at Bitwise, and Ryan Rasmussen, Head of Research, have characterized 2026 as a potential "breakout year for crypto," arguing that the traditional four-year halving cycle is becoming irrelevant as institutional capital flows reshape market structure. If you are building a long-term crypto investment thesis, this structural shift from retail-driven cycles to institution-led accumulation represents a fundamental change in how price discovery works.
Key Catalysts and Risk Scenarios for H2 2026
Several catalysts could ignite the next leg higher in the second half of 2026. The U.S. Clarity Act—comprehensive crypto market structure legislation—continues to advance through Congress, and any breakthrough would provide regulatory certainty that unlocks additional institutional capital. Federal Reserve rate cuts, widely expected to resume later this year, would reduce the opportunity cost of holding non-yielding assets like Bitcoin. A spot SOL ETF approval, for which Bitwise and other asset managers have filed applications, could replicate the demand shock that BTC and ETH ETFs delivered in 2024–2025. Citigroup, despite recently cutting its BTC 12-month target from $143,000 to $112,000, still considers ETF demand "the most important positive factor," according to analyst Alex Saunders in a March 17 report.
However, prudent investors must weigh the downside scenarios. Prolonged rate holds by the Federal Reserve would maintain pressure on risk assets across the board. Escalating geopolitical tensions—already driving gold to $5,280, an 80%+ annual gain per CoinDesk—could accelerate capital rotation from crypto into traditional safe havens. Citi's bear case, which envisions legislative stagnation and annual BTC ETF inflows dropping below $10 billion, would keep prices range-bound or push them lower through year-end. For those tracking real-time market signals, the BTC-to-gold ratio suggests a potential bottom window between now and mid-2026, with historical bear market durations of 12–13 months pointing to a USD-denominated floor by late 2026. The balance of evidence tilts bullish on a 12-month horizon—but position sizing and risk management remain essential when buying into fear.
Frequently Asked Questions
Is It Safe to Buy Crypto When the Fear & Greed Index Reads 26?
A Fear & Greed Index reading of 26 places the market firmly in "extreme fear" territory — historically one of the most profitable entry zones for patient investors. During the extreme fear phase of mid-2022, Bitcoin traded below $20,000 before rallying over 100% through 2023, eventually reclaiming $44,000 by year-end. Statistical analysis of past cycles shows that assets purchased during fear-dominated periods (index below 30) have delivered significantly higher average returns over 12-month horizons compared to those bought during greed phases above 70. Current on-chain data supports a contrarian case: Glassnode data shows wallets holding 1,000+ BTC have accumulated 56,227 additional BTC since December 2025, increasing their holdings by 3.7% — a classic whale accumulation pattern during depressed sentiment. That said, lump-sum buying at any single fear reading carries timing risk. A disciplined dollar-cost averaging (DCA) strategy — splitting your intended allocation across 4–8 weekly purchases — historically smooths volatility and captures more of the subsequent recovery. For a deeper breakdown of accumulation strategies, see our Bitcoin investment strategy guide.
What Is the Bitcoin Price Target for 2026?
Wall Street's most-cited forecast comes from Citigroup, which on March 17, 2026 revised its 12-month BTC target downward from $143,000 to $112,000, citing stalled U.S. crypto legislation (the Clarity Act) and cooling ETF inflows. Citi's bear-case scenario models a drop to roughly $58,000, while the bull case still envisions $165,000 if regulatory tailwinds resume. On the more optimistic end, Bitwise projects Bitcoin will reach a new all-time high in 2026, forecasting that spot ETFs alone could absorb approximately 166,000 BTC — worth roughly $15.3 billion — exceeding 100% of new annual supply from mining. With BTC currently trading near $74,178, roughly 41% below its 52-week high of $126,079 according to Motley Fool, the key variables remain ETF net flow direction and Federal Reserve interest rate policy. However, spot BTC ETFs have seen approximately $7.8 billion in outflows since November — about 12% of total cumulative inflows of $61.6 billion — signaling that institutional conviction has weakened but not collapsed. Explore our full Bitcoin price prediction analysis for scenario modeling.
Solana vs. Ethereum: Which Is the Better Investment in 2026?
The Solana-versus-Ethereum debate in 2026 ultimately comes down to risk tolerance and investment horizon. Ethereum commands a dominant DeFi total value locked (TVL) of over $136 billion and boasts 31,869 active developers as of late 2025, making it the most battle-tested smart contract platform by virtually every infrastructure metric, according to data compiled by OSL. Solana, meanwhile, has demonstrated explosive growth: its DeFi TVL surged 340% to approach $10 billion, its developer count reached 17,708, and its market capitalization stands at $54 billion — roughly one-sixth of Ethereum's valuation, which creates asymmetric upside potential. Bitwise forecasts both assets will hit new all-time highs, projecting ETF-driven demand of approximately 960,000 ETH ($3.0 billion) and 23 million SOL ($3.2 billion). For conservative portfolios seeking stability and deep liquidity, ETH's institutional moat is difficult to match; for aggressive allocators willing to accept higher volatility, SOL's growth trajectory and lower absolute price offer greater percentage-gain potential. Read our Solana vs Ethereum comparison for a full side-by-side analysis.
What Does a Negative Kimchi Premium Mean for Global Crypto Markets?
The "Kimchi premium" — the price spread between South Korean crypto exchanges and global platforms — has turned negative, hovering around -0.68% to -0.70%, meaning Korean traders are pricing Bitcoin below the international benchmark. This reverse premium, often called the "reverse Kimchi," historically serves as a regional oversold indicator: it signals that local selling pressure has temporarily exceeded global demand, creating a pricing dislocation. Past instances of sustained negative premiums — notably in mid-2022 and late 2024 — preceded periods where Korean exchange prices mean-reverted upward toward global rates, often delivering short-term outperformance relative to offshore markets. For global investors, the reverse Kimchi premium functions as a useful sentiment gauge for the broader Asia-Pacific region, alongside metrics like the Coinglass funding rate differential between Asian and Western trading sessions. While the premium alone is not a trading signal, its convergence back toward zero has historically coincided with renewed risk appetite across Asian retail markets. Track real-time Asian market sentiment in our daily market analysis.
Data Sources
- CoinDesk — Citigroup Cuts BTC and ETH Targets (March 17, 2026)
- CoinDesk — XRP Flips BNB Open Interest Data (March 17, 2026)
- Bitwise — 10 Crypto Predictions for 2026
- Motley Fool — Top Cryptocurrencies for Next Bull Market (March 15, 2026)
- OSL — Ethereum vs Solana DeFi 2026 Guide
- CoinDesk — Bitcoin Market Bottom Analysis (March 1, 2026)
- Capital.com — Bitcoin Price Prediction (March 17, 2026)
- Glassnode — On-Chain Analytics
- Coinglass — Derivatives & Funding Rate Data
This article is for informational purposes only and does not constitute investment advice. All investment decisions should be made based on your own judgment and responsibility.
Related Articles
- Top 7 Altcoins to Watch in Extreme Fear — Data-Driven Picks for March 2026
- Extreme Fear = Buying Opportunity? Top 6 Cryptos to Watch in March 2026 — BTC, DOT, UNI, XRP, SOL, ETH
- Top 5 Coins to Buy in Extreme Fear — Fear & Greed at 15, 80% Historical Rebound Rate
- 6 Coins to Buy When Fear & Greed Index Hits 18: Data-Backed Top Picks for March 2026
- Fear & Greed Index at 15: Top 6 Coins to Buy During Extreme Fear (March 2026)