Fear and Greed Index Hits 14: Are ETH and SOL Rallies Signaling a Historic Bottom?
Fear & Greed Index hits 14 (Extreme Fear) as ETH (+4.74%), SOL (+7.24%) rally. Is this a historic bottom signal?
On March 1, 2026, the Crypto Fear and Greed Index plunged to 14 out of 100 — deep into "Extreme Fear" territory — marking one of the most bearish sentiment readings of the year.
The total crypto market capitalization stands at $2.40 trillion with Bitcoin dominance at 56.1%, and the overwhelming mood across social media, trading desks, and sentiment surveys is one of acute anxiety. Yet in a striking paradox, several major altcoins are posting substantial gains on both Binance and OKX: Solana (SOL) surged +7.24% to $87.59, Ethereum (ETH) climbed +4.74% to $2,016.74, XRP rallied +4.43% to $1.41, and even Dogecoin (DOGE) gained +3.39% to $0.096 (source: Binance, 2026-03-01). This divergence between extreme bearish sentiment and strong spot market recoveries has drawn comparisons to historic bottom formations, raising a critical question: is the market setting up for a major reversal, or is this a dead cat bounce?
Key Takeaways
Quick Answer: The Crypto Fear and Greed Index measures market sentiment from 0 (Extreme Fear) to 100 (Extreme Greed). On March 1, 2026, it hit 14 — Extreme Fear — up 3 points from the prior day. Despite panic, SOL surged +7.24%, ETH gained +4.74%, and XRP rose +4.43% on Binance. Historically, readings below 15 have preceded significant multi-month recoveries.
- Fear and Greed Index at 14/100, firmly in the Extreme Fear zone, up +3 from the previous day
- Total market cap holds at $2.40T with BTC dominance at 56.1% and ETH dominance at 10.1%
- SOL leads the Binance rally at +7.24% ($87.59), followed by ETH +4.74% ($2,016.74) and XRP +4.43% ($1.41)
- BTC recovered +2.57% to $67,359 with a volatile 24h range of $63,030 to $68,200
- All major funding rates are negative on Binance futures — BTC -0.0007%, ETH -0.0034%, SOL -0.0046%, XRP -0.0131%
- Retail traders remain 60-70% long across all majors despite bearish derivatives positioning
- Historical precedent: Sub-15 readings in March 2020 (index: 8) and June 2022 (index: 6) preceded rallies of 1,500% and 45% respectively
What Does a Fear and Greed Index Reading of 14 Mean for Crypto?
The Crypto Fear and Greed Index is a composite sentiment indicator that quantifies market psychology on a scale from 0 (Extreme Fear) to 100 (Extreme Greed), aggregating six factors: market volatility, trading volume, social media activity, investor surveys, Bitcoin dominance, and Google Trends data (source: Alternative.me, 2026-03-01). The current reading of 14 sits deep within the Extreme Fear zone (0-25), indicating that the overwhelming majority of market participants are experiencing acute anxiety and persistent selling pressure. While the index recovered 3 points from the previous day's reading, it remains near this year's lowest levels. Critically, the total crypto market capitalization has held steady at $2.40 trillion — suggesting the sell-off is driven more by psychological capitulation than actual large-scale capital outflows. When sentiment collapses this dramatically while market cap remains relatively stable, it often signals that the worst of the selling may be nearing exhaustion, though confirmation requires sustained recovery above the 20-25 range over several consecutive days.
At 14, the current level suggests that fear has become self-reinforcing. Falling prices trigger more selling, which drives prices lower and amplifies anxiety — a negative feedback loop that historically has broken only when either buying volume overwhelms selling pressure or sellers simply run out of assets to liquidate. The fact that today's reading ticked up 3 points from the previous session may represent the earliest signs of that exhaustion. For continuously updated market analysis and sentiment tracking, visit SpotedCrypto's market dashboard.
| Metric | Value | Context |
|---|---|---|
| Fear & Greed Index | 14/100 | Extreme Fear (+3 vs yesterday) |
| Total Market Cap | $2.40T | Relatively stable despite fear |
| BTC Dominance | 56.1% | Elevated — capital flight to BTC |
| ETH Dominance | 10.1% | Below average |
| Active Cryptocurrencies | 18,712 | — |
| 24h Global Volume | $131.8B | Elevated — active trading |
Which Altcoins Are Defying Extreme Fear on Binance and OKX?
Not every cryptocurrency is capitulating alongside market sentiment. Binance's 24-hour volume leaders reveal a pattern of aggressive dip-buying across multiple major assets as of March 1, 14:00 KST. Solana (SOL) led the recovery with a +7.24% surge to $87.59, after touching an intraday low of $77.12 — a bounce of over 15% from the session's trough (source: Binance, 2026-03-01). Ethereum (ETH) followed with a +4.74% gain to $2,016.74, recovering sharply from a 24-hour low of $1,835.36 to reach a high of $2,054.80 — an intraday range exceeding 11%. XRP gained +4.43% to $1.41 on $367.9 million in volume, SUI rose +4.73% to $0.93, and Dogecoin (DOGE) advanced +3.39% to $0.096 with $141.6 million in 24-hour volume. Cross-exchange data from OKX confirms these moves: BTC at $67,365.50, ETH at $2,016.80, and SOL at $87.61 — prices within cents of Binance levels, ruling out exchange-specific anomalies or manipulation (source: OKX, 2026-03-01). The consistency across platforms indicates genuine, market-wide buying conviction rather than isolated exchange activity.
| # | Coin | Price | 24h Change | Volume(24h) | High | Low |
|---|---|---|---|---|---|---|
| 1 | BTC | $67,359 | +2.57% | $1.7B | $68,199.99 | $63,030.00 |
| 2 | ETH | $2,017 | +4.74% | $1.1B | $2,054.80 | $1,835.36 |
| 3 | USDC | $1.00 | -0.02% | $874.2M | $1.00 | $1.00 |
| 4 | SOL | $88 | +7.24% | $489.5M | $88.90 | $77.12 |
| 5 | XRP | $1.41 | +4.43% | $367.9M | $1.43 | $1.27 |
| 6 | PAXG | $5,343 | +0.57% | $310.4M | $5,600.00 | $5,286.25 |
| 7 | USD1 | $1.00 | -0.08% | $197.6M | $1.00 | $1.00 |
| 8 | DOGE | $0.10 | +3.39% | $141.6M | $0.10 | $0.09 |
| 9 | BNB | $630 | +2.83% | $124.8M | $632.16 | $588.64 |
| 10 | SUI | $0.93 | +4.73% | $83.4M | $0.95 | $0.83 |
Bitcoin itself recovered +2.57% to $67,359, with trading volume of $1.7 billion on Binance alone. The 24-hour low of $63,030 to a high of $68,200 represents an 8.2% range — significantly above normal daily volatility and indicative of intense two-way trading. Meanwhile, gold-backed tokens like PAXG held relatively flat at $5,343 (+0.57%), reflecting continued demand for safe-haven exposure within the crypto ecosystem. For real-time price tracking and deeper coin-by-coin analysis, check SpotedCrypto's trending market data.
The pattern across these rallies is notable: the sharpest bounces are occurring in the most heavily sold assets. SOL's 15% recovery from its intraday low, and ETH's 12% swing, suggest that leveraged short positions are getting squeezed as spot buyers step in at oversold levels. This is consistent with what derivatives traders call "short squeeze dynamics" — where forced liquidations of bearish bets mechanically accelerate upward price moves.
What Are Crypto Derivatives Markets Signaling Right Now?
The derivatives market presents a nuanced picture that spot prices alone cannot fully capture. As of March 1, 2026, Binance perpetual futures funding rates are negative across all major cryptocurrencies: Bitcoin at -0.0007%, Ethereum at -0.0034%, Solana at -0.0046%, XRP at -0.0131%, and Dogecoin at -0.0038% (source: Binance Futures, 2026-03-01). Negative funding rates indicate that short sellers are effectively paying long holders to maintain their positions — a clear signal that the futures market is dominated by bearish bets. However, long/short ratios tell a contrasting story: SOL traders are 70.1% long, DOGE 66.8% long, XRP 67.4% long, ETH 63.9% long, and BTC 62.2% long. This divergence — negative funding but long-dominated positioning — typically occurs when institutional or whale-level participants are driving the short side while retail traders maintain bullish conviction. Open interest stands at $5.3 billion for BTC and $3.7 billion for ETH, reflecting enormous capital deployed in the derivatives market with significant directional bets from both sides of the trade.
| Coin | Funding Rate | Open Interest | Long/Short |
|---|---|---|---|
| BTC | -0.0007% | $5.3B | 62.2% / 37.8% |
| ETH | -0.0034% | $3.7B | 63.9% / 36.1% |
| SOL | -0.0046% | $860.9M | 70.1% / 29.9% |
| XRP | -0.0131% | $378.0M | 67.4% / 32.6% |
| DOGE | -0.0038% | $163.4M | 66.8% / 33.2% |
| BNB | 0.0000% | $310.3M | N/A |
| ADA | 0.0100% | $90.5M | N/A |
| AVAX | 0.0100% | $74.8M | N/A |
| DOT | 0.0086% | $52.0M | N/A |
| LINK | 0.0095% | $76.7M | N/A |
The negative funding environment creates a powerful mechanical effect: short sellers must continuously pay fees to maintain their positions. If spot prices continue to climb — as the current altcoin rally suggests — this payment burden compounds, eventually forcing shorts to close by buying back the underlying asset, which further accelerates the upward move. This "funding rate squeeze" dynamic has historically triggered some of the most explosive short-term rallies in crypto markets. Visit SpotedCrypto's derivatives analysis for real-time funding rate tracking across all major exchanges.
Particularly noteworthy is XRP's funding rate of -0.0131% — the most negative among all major assets by a wide margin. This extreme bearish positioning in XRP futures, combined with its +4.43% spot rally and $378 million in open interest, suggests that XRP short sellers may be the most vulnerable to a squeeze scenario. Additionally, SOL's combination of 70.1% long positioning, $860.9 million in open interest, and a -0.0046% funding rate creates conditions for high volatility in either direction — a potential breakout or breakdown that traders should monitor closely.
What Happened During Previous Extreme Fear Episodes Below 15?
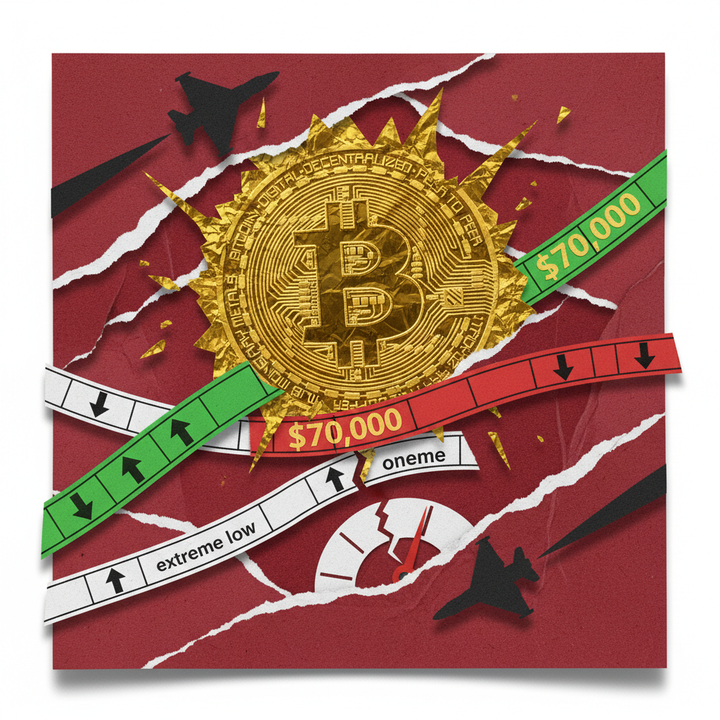
The Crypto Fear and Greed Index has dropped below 15 on only a handful of occasions in its history, and each episode has coincided with major market inflection points that reshaped portfolios for years to come. In June 2022, the index plummeted to 6 during the cascading collapse of the Terra/LUNA ecosystem and the bankruptcy of hedge fund Three Arrows Capital, which together erased hundreds of billions of dollars from the crypto market (source: Alternative.me). Bitcoin was trading near $20,000 at the time and went on to rally approximately 45% over the following 12 months. Even more dramatically, in March 2020, the COVID-19 pandemic triggered a global market crash that sent the crypto index to 8 while Bitcoin briefly traded below $5,000. From that bottom, BTC surged roughly 1,500% to reach its then-all-time high of approximately $69,000 in November 2021. While the current reading of 14 is less severe than those historic episodes, the pattern is consistent: extreme fear readings in the single digits and low teens have repeatedly marked zones where long-term buyers found exceptional value.
| Date | F&G Reading | Trigger Event | BTC Price at Bottom | 12-Month Return |
|---|---|---|---|---|
| March 2020 | 8 | COVID-19 Crash | ~$5,000 | +1,500% |
| June 2022 | 6 | LUNA/3AC Collapse | ~$20,000 | +45% |
| March 2026 | 14 | Current | $67,359 | TBD |
Brian Quinlivan, Marketing Director at on-chain analytics firm Santiment, has noted that "when the Fear and Greed Index enters the extreme fear zone, it historically coincides with retail capitulation and smart money accumulation happening simultaneously" (source: Santiment Blog). This observation aligns with contrarian investing theory — the principle that markets tend to bottom when fear reaches its peak and top when euphoria becomes universal. As Warren Buffett famously put it: "Be fearful when others are greedy, and greedy when others are fearful." While that maxim was coined for equities, crypto market data has consistently validated its applicability to digital assets.
However, a critical caveat applies: extreme fear does not guarantee an immediate rebound. In 2022, after the index hit 6, the market continued to consolidate near lows for several months before beginning its sustained recovery in early 2023. Investors who bought the initial extreme fear reading had to endure significant volatility and drawdowns before seeing profits. The current reading of 14 may represent a medium-to-long-term buying opportunity, but short-term downside risk remains very real. For more in-depth historical analysis and pattern tracking, explore SpotedCrypto's research library.
Market Outlook: Bullish and Bearish Scenarios
The crypto market's trajectory from here hinges on how quickly the Fear and Greed Index recovers, whether today's altcoin rally sustains momentum, and how the global macroeconomic environment evolves in the coming weeks. The current reading of 14, up 3 points from the prior day, represents a tentative stabilization but falls far short of confirming a trend reversal — that would require sustained readings above 20-25. Two distinct scenarios emerge from the current data, each supported by specific metrics and historical precedent. In the bullish case, dip-buying pressure — evidenced by today's broad-based rally across Binance and OKX with SOL +7.24%, ETH +4.74%, and XRP +4.43% — gradually pushes the index back toward the 30-40 range over the coming 2-4 weeks, creating conditions for a broader market recovery. In the bearish case, persistent macroeconomic headwinds could push sentiment into single digits, triggering a cascade of liquidations across the 60-70% long retail positions visible in Binance derivatives data.
Bullish Scenario: If dip-buying momentum continues and the Fear and Greed Index recovers above 20-25 within the next 2-3 weeks, it would confirm a local bottom formation. In this scenario, ETH could target the $2,400-$2,500 range (18-24% above the current $2,017), SOL could push toward $110-$120 as its momentum leads the altcoin recovery, and BTC could test the $75,000 resistance zone. The negative funding rates would mechanically accelerate any rally, as short sellers across all five major assets are forced to cover their positions. Supporting this case: the total market cap has held at $2.40 trillion despite extreme fear, and cross-exchange price consistency between Binance and OKX suggests genuine organic demand rather than artificial pump activity.
Bearish Scenario: If global macro risks intensify — including unexpected central bank hawkishness, new regulatory crackdowns, or a broader risk-off event in traditional markets — the Fear and Greed Index could drop into single digits, matching or exceeding the severity of June 2022. This would likely trigger cascading liquidations of the 60-70% long positions visible in Binance's long/short data, potentially driving altcoins 15-25% lower from current levels. BTC could retest the $63,030 24-hour low and potentially break below $60,000, while ETH could revisit the $1,835 support zone. Total market capitalization could contract below $2.0 trillion under this scenario. The near-term pivot point is the Fear and Greed Index's trajectory over the next 1-2 weeks — failure to hold above 10 would signal deepening capitulation.
Critical Levels and Indicators Traders Should Watch
Navigating extreme fear environments requires focus on specific, measurable indicators rather than emotional reactions. The following levels and metrics represent the most important data points for assessing whether the current reading of 14 marks a genuine bottom or a pause before further downside. Each indicator draws directly from the March 1 Binance and OKX market data and derivatives snapshots, providing actionable thresholds that traders can monitor in real time. The interplay between spot prices, funding rates, open interest, and long/short ratios will ultimately determine whether today's altcoin rally evolves into a sustained recovery or fades into another leg down. Importantly, these indicators should be evaluated together rather than in isolation — a single bullish signal amid otherwise bearish data carries less weight than convergence across multiple metrics signaling the same directional shift.
- Fear and Greed Index recovery above 20: Sustained readings above 20 for 3+ consecutive days would confirm a short-term bottom formation
- BTC $68,200 resistance (24h high): A clean break above this level on strong volume could target $72,000-$75,000
- ETH $2,054.80 breakout (24h high on Binance): Breaking and holding above this level would signal momentum continuation toward $2,400
- SOL $88.90 resistance (24h high): Already approaching this level; a break confirms the rally and targets $95-$100
- BTC funding rate normalization: A shift from -0.0007% to positive territory would signal a major reduction in bearish futures positioning
- XRP funding rate at -0.0131%: The most extreme negative rate among all majors — this creates the highest squeeze potential if prices continue rising
- BTC open interest at $5.3B: A sudden decline in OI while prices drop would indicate a liquidation cascade; stable or rising OI with rising prices is bullish
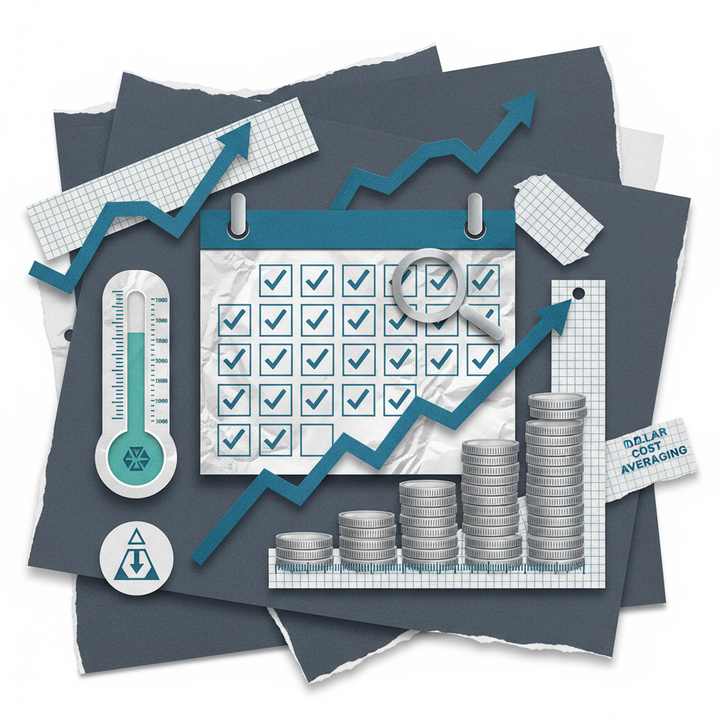
Deploying capital during extreme fear periods carries both exceptional upside potential and significant risk. Rather than committing a large position at once, dollar-cost averaging (DCA) over a 2-4 week window allows investors to capture potential upside while mitigating the risk of further drawdowns. Professional risk management frameworks suggest limiting fresh exposure to 20-30% of available capital during such volatile conditions, with clear stop-loss levels defined before entry.
For actionable daily market insights, derivatives breakdowns, and real-time sentiment tracking, visit SpotedCrypto's premium market analysis and stay ahead of the next major market move.
Frequently Asked Questions
Does a low Fear and Greed Index guarantee a crypto market bottom?
No. While readings below 15 have historically aligned with medium-to-long-term buying opportunities, they do not guarantee an immediate rebound. In June 2022, the index hit 6 during the Terra/LUNA and Three Arrows Capital collapse, yet the market continued to trade sideways for several months before beginning its sustained recovery in early 2023. Investors who entered at the initial extreme fear reading endured significant volatility before seeing returns. A dollar-cost averaging (DCA) approach over 2-4 weeks, combined with disciplined risk management, is essential when deploying capital during extreme fear periods.
Why are altcoins rallying while the Fear and Greed Index shows Extreme Fear?
Extreme fear environments create the conditions for sharp counter-trend rallies. When the majority of futures traders are positioned bearish — as evidenced by the negative funding rates across all five major assets on Binance — any sustained spot buying pressure can trigger forced short covering, where bearish traders must buy back assets at losses to close their positions. SOL's +7.24% rally on March 1 occurred against a -0.0046% funding rate, strongly suggesting that forced short liquidations contributed to the magnitude of the move. These rallies can be powerful in the short term but require fundamental catalysts to sustain beyond the initial squeeze.
What do negative funding rates mean for crypto traders?
Funding rates are periodic payments between long and short holders on perpetual futures contracts. Negative funding rates — as seen across BTC (-0.0007%), ETH (-0.0034%), SOL (-0.0046%), XRP (-0.0131%), and DOGE (-0.0038%) on Binance as of March 1, 2026 — mean that short sellers are paying fees to long holders. This indicates heavy bearish positioning in the futures market. When funding is deeply negative and spot prices begin to rise, it can trigger a "funding rate squeeze" where shorts face compounding costs and eventual forced liquidation, mechanically accelerating upward price movement.
How should investors approach an Extreme Fear crypto market?
Historical data suggests that extreme fear periods — particularly when the index drops below 15 — have offered favorable entry points for investors with a 6-12 month time horizon. However, timing the exact bottom is virtually impossible, even for professional traders. A DCA strategy that spreads purchases over 2-4 weeks reduces the impact of further potential drawdowns while capturing the opportunity presented by depressed prices. Limiting new exposure to 20-30% of available portfolio capital and maintaining predefined stop-loss levels are prudent risk management practices. Monitor the Fear and Greed Index for sustained recovery above 20 as a confirmation signal before increasing allocation.
Sources
- Alternative.me, Crypto Fear and Greed Index real-time data, 2026-03-01
- Binance, real-time spot prices and futures data (funding rates, open interest, long/short ratios), 2026-03-01
- OKX, real-time spot market data, 2026-03-01
- CoinMarketCap, global market capitalization and dominance data, 2026-03-01
- Santiment, on-chain analytics and market sentiment research
This article is for informational purposes only and does not constitute investment advice. All investment decisions should be made based on your own judgment and risk tolerance. Cryptocurrency investments carry significant risk, including the potential loss of principal.