Ethereum RSI Hits Cycle Bottom After 6-Month Decline – What On-Chain Data Reveals
ETH's weekly RSI hits 30 for the 3rd time in 8 years amid record on-chain activity. A cycle bottom signal?

Ethereum has entered uncharted territory with six consecutive months of price decline — the longest losing streak in its 11-year history. Yet beneath the surface, a striking divergence between collapsing prices and surging on-chain activity is forcing analysts to reassess whether ETH is approaching a generational bottom or simply pausing before another leg down.
Ethereum Price and Key Metrics Today — March 17 Quick Summary
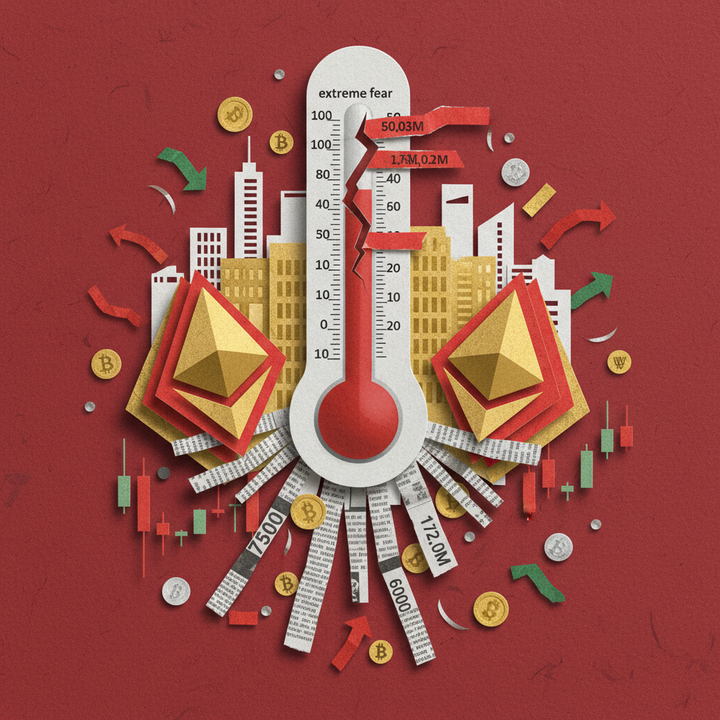
Quick Answer: Ethereum trades at $2,329.81 (+3.48%) on March 17, 2026, amid a historic six-month consecutive decline — the longest in ETH history — with a year-to-date loss of approximately 31%. The Fear & Greed Index sits at 28 (Fear), while exchange balances have dropped to 16 million ETH, a multi-year low signaling quiet accumulation beneath the sell-off.
Ethereum (ETH) is trading at $2,329.81 on Binance as of March 17, 2026, marking a +3.48% intraday recovery from a 24-hour low of $2,234.92. Despite this bounce, ETH remains mired in its longest consecutive monthly decline in history — six straight months of losses that have erased approximately 31% of its value year-to-date, according to AInvest. The broader crypto market cap stands at $2.62 trillion, with Ethereum's dominance compressed to just 10.7%, down sharply from its 2021 peak above 20%. The Crypto Fear & Greed Index reads 28 (Fear), up five points from the prior session, signaling that while extreme panic may be fading, sustained buyer conviction has yet to materialize. With 24-hour trading volume reaching $1.78 billion on Binance alone and exchange balances dropping to 16 million ETH — a multi-year low — the divergence between declining price and accelerating accumulation is creating one of the most compelling data conflicts in Ethereum's history.
ETH Market Snapshot — March 17, 2026
| Metric | Value | Source |
|---|---|---|
| Current Price | $2,329.81 | Binance |
| 24h Change | +3.48% | Binance |
| 24h High / Low | $2,386.02 / $2,234.92 | Binance |
| 24h Volume (Binance) | $1.78B | Binance |
| Market Cap (est.) | ~$280B | CoinGecko |
| ETH Dominance | 10.7% | CoinGecko |
| Fear & Greed Index | 28 (Fear, +5 vs prior day) | Alternative.me |
| YTD Performance | ~-31% | AInvest |
| Exchange Balance | 16M ETH (multi-year low) | Glassnode |
| ETH Funding Rate | +0.0020% | Binance |
The +3.48% daily rebound — pushing ETH from $2,234.92 to an intraday high of $2,386.02 — comes after what AInvest characterizes as a historically anomalous accumulation pattern. Exchange balances have plummeted to 16 million ETH, representing one of the steepest withdrawal rates in Ethereum's history. Investors are moving coins to cold storage and staking contracts at an accelerating pace, with approximately 30% of total ETH supply (~37 million ETH) now locked in staking, according to Phemex.
The funding rate on Binance perpetual futures sits at +0.0020%, a near-neutral reading that reflects balanced positioning between longs and shorts. This contrasts sharply with the deeply negative funding rates seen during the February capitulation, suggesting that leveraged traders are no longer aggressively betting on further downside. Meanwhile, the Fear & Greed Index at 28 represents a meaningful recovery from the extreme fear reading of 15 recorded on March 12, according to Capital.com.
Institutional flows are also shifting. After $2.76 billion in cumulative ETH ETF outflows over four months, March 11 saw $57 million in fresh inflows — a modest but symbolically important reversal, per Blockhead. The ETH ETF complex now holds $11.28 billion in net assets, representing 4.72% of Ethereum's market capitalization. Whether this single-day inflow marks the beginning of sustained institutional re-entry or merely a dead-cat bounce in capital flows remains the central question heading into late March.
ETH Technical Analysis: What RSI, SMA, and ADX Signal About Direction
Ethereum's technical indicators are painting a complex picture that pits short-term neutrality against long-term cycle-bottom signals rarely seen in the asset's history. The 14-day Relative Strength Index (RSI) stands at 50.7 as of March 16, according to Capital.com, reflecting a neutral reading that confirms a short-term bounce from oversold conditions but falls short of signaling a trend reversal. More critically, the weekly RSI has plunged to approximately 30 — a level touched only twice before in Ethereum's eight-year trading history: during the 2018 capitulation when ETH bottomed at $83, and during the 2022 bear market when it troughed near $881. The Average Directional Index (ADX) reads 23.4, sitting below the 25 threshold that typically confirms a defined trend, suggesting the current market is trapped in a consolidation phase rather than initiating a decisive directional move.
Key Technical Levels — ETH/USD
| Indicator | Value | Signal |
|---|---|---|
| 14-Day RSI | 50.7 | Neutral — bounce in progress |
| Weekly RSI | ~30 | Cycle bottom (3rd time in 8 years) |
| ADX | 23.4 | No defined trend (<25) |
| 20-Day SMA | $1,990–$2,022 | Price above = short-term support |
| 50-Day SMA | $2,188 | Reclaimed — now interim support |
| 100-Day SMA | $2,637 | Strong resistance |
| 200-Day SMA | $3,394 | Major resistance / trend line |
| Support S1 | $1,647 | Key downside target |
| Pivot | $2,060 | Central equilibrium |
| Resistance R1 | $2,378 | Near-term ceiling (tested today) |
| Resistance R2 | $2,792 | Breakout confirmation level |
The weekly RSI reading near 30 deserves special attention. As financial analyst Alejandro Arrieche of FX Empire notes: "The RSI is hovering above 30, and the price seems to have been making a strong floor at $1,800." The historical precedent is compelling: when the weekly RSI hit 28 in December 2018, ETH was trading at $83 and went on to rally 5,566% to $4,700 over three years. When it touched similar levels in June 2022 near $1,000, ETH rebounded 290% to $3,900 within two years. If history rhymes, the current cycle-bottom signal could precede a move toward Arrieche's $6,400 target — representing potential upside of 175% from current levels.
The moving average structure reveals the magnitude of damage inflicted over six months — but also a nascent recovery signal. ETH at $2,329 has now reclaimed both the 20-day SMA ($1,990–$2,022) and the 50-day SMA ($2,188), the latter of which had acted as formidable resistance throughout February. This reclamation is the first meaningful technical improvement since the sell-off began in October 2025. However, formidable resistance walls remain above: the 100-day SMA at $2,637 and the 200-day SMA at $3,394. For context, Ethereum's price would need to rally approximately 46% just to reclaim the 200-day SMA, a level it has traded below since late 2025, underscoring how extended the current bearish regime has become.
The ADX reading of 23.4 is perhaps the most underappreciated indicator in the current setup. An ADX below 25 signals the absence of a strong trend in either direction, meaning the market is more likely to consolidate sideways than stage a dramatic breakout or breakdown. This aligns with the pivot point analysis: with ETH oscillating around the $2,060 pivot, the immediate trading range appears bounded by S1 at $1,647 on the downside and R1 at $2,378 on the upside. Today's intraday high of $2,386 briefly pierced above R1 — a potentially significant test that bulls failed to hold. A sustained daily close above R1 would be the first technical confirmation that momentum is shifting from distribution to accumulation.
Derivatives data reinforces the picture of a market in transition. The Binance ETH funding rate at +0.0020% suggests a marginal long bias, a marked improvement from the deeply negative rates that dominated February. Combined with the neutral 14-day RSI and sub-25 ADX, the technical picture points to a market that is no longer in free-fall but not yet ready to confirm a reversal. Traders watching for a definitive signal should monitor the weekly RSI for a sustained move above 40 and the ADX for a push above 25, which together would confirm that derivatives positioning is finally aligning with spot market recovery. Until those thresholds are cleared, the base case remains range-bound price action between $2,060 and $2,378 — a narrowing coil that historically precedes a violent resolution in either direction.
Why Is On-Chain Data Moving Against the Price?
Quick Answer: Ethereum's on-chain fundamentals are diverging sharply from its price action — daily active addresses topped 2 million in February 2026 (exceeding 2021 bull market highs), while TVL surged 5.4% weekly to $56.64B. This price-activity decoupling mirrors the pattern seen before DeFi Summer 2020, which preceded a 3,000%+ rally.
Ethereum is exhibiting one of the most striking divergences in its history: a six-month price decline paired with record-breaking network utilization. Daily active addresses surpassed 2 million in February 2026, eclipsing the peak of the 2021 bull market, according to CoinDesk. Smart contract calls simultaneously broke through the 40-million-per-day barrier — a metric that reflects genuine developer and protocol engagement rather than speculative token transfers. Total Value Locked climbed from $53.75B on March 9 to $56.64B by March 15, a 5.4% weekly gain tracked by Cryip.co. Meanwhile, stablecoin supply anchored on Ethereum held steady at approximately $162B, representing 52% of all stablecoins globally. The network is processing more value, hosting more users, and securing more capital than ever — yet ETH trades roughly 60% below its all-time high.
On-Chain Fundamentals Dashboard: March 2026
| Metric | Current Value | Previous / Comparison | Change |
|---|---|---|---|
| Total Value Locked (TVL) | $56.64B (Mar 15) | $53.75B (Mar 9) | +5.4% |
| Daily Active Addresses | 560K–830K (weekly range) | 2M peak (Feb 2026) | Exceeds 2021 ATH |
| Smart Contract Calls | 40M+ / day | — | Record high |
| Stablecoin Supply on ETH | ~$162B | ~52% global share | Stable |
| ETH Price (Mar 17) | $2,330 | YTD: -31.1% | 6-month decline |
The Decoupling Phenomenon: What History Tells Us
The divergence between rising network activity and falling price is not unprecedented. In early 2020, before DeFi Summer ignited a multi-thousand-percent rally, Ethereum exhibited a nearly identical pattern. Network usage and TVL surged while ETH languished below $250. Within 18 months, the price exceeded $4,800. The mechanism is intuitive: on-chain adoption creates organic demand that eventually reprices the asset when speculative sentiment rotates. As CoinDesk noted, record network activity at depressed prices represents a "fundamental floor" — the blockchain's utility value sets a baseline that speculative selling struggles to breach permanently.
Stablecoin Dominance as Infrastructure Proof
Ethereum's $162B stablecoin supply is arguably its most underappreciated moat. With 52% of global stablecoin volume settled on Ethereum, the network functions as the de facto infrastructure layer for decentralized payments, cross-border settlements, and DeFi collateral. This is not speculative activity — it is functional, revenue-generating usage. Protocols like Aave, Lido, and MakerDAO continue attracting deposits despite ETH's price weakness, reinforcing the thesis that the network's economic gravity operates independently of short-term token price movements. For investors tracking Ethereum's fundamental indicators, this divergence presents a compelling question: how long can the gap between usage and valuation persist before mean reversion kicks in?
Institutional Fund Flows and Exchange Balances Signal Accumulation
After four months of relentless institutional selling, Ethereum ETFs recorded $57 million in net inflows on March 11, 2026 — a decisive shift that may mark the beginning of a new accumulation cycle. The reversal came after $2.76 billion in cumulative outflows since November 2025, according to AInvest. This single-day inflow, combined with Bitcoin ETF purchases totaling $172 million on the same date as reported by Blockhead, suggests institutional allocators are repositioning into digital assets at discounted levels. ETH ETF net assets currently stand at $11.28B, representing 4.72% of Ethereum's total market capitalization — a modest but growing institutional footprint that provides a regulated demand channel absent in previous cycles.
Supply Squeeze Indicators: March 2026
| Metric | Value | Significance |
|---|---|---|
| Exchange Balance | 16M ETH | Multi-year low — persistent withdrawals during price decline |
| Staked ETH | ~37M ETH (~30% of supply) | Locked from circulation, reducing sell-side pressure |
| Staking Yield | 2.84%–4.2% APY | Incentivizes long-term holding over exchange selling |
| ETH ETF Net Assets | $11.28B (4.72% of mkt cap) | Institutional custody removing supply from spot markets |
| ETF Flows (Mar 11) | +$57M (single day) | First significant inflow after 4-month outflow streak |
| ETF Outflows (Nov–Feb) | -$2.76B cumulative | Institutional de-risking now potentially exhausted |
Exchange Outflows: Abnormal Accumulation Pattern
Exchange balances have fallen to 16 million ETH — the lowest level in years — and the trajectory is counterintuitive. During typical bear phases, exchange balances rise as holders deposit tokens to sell. The current pattern shows the opposite: as ETH declined 31% year-to-date, investors accelerated withdrawals from exchanges to self-custody and staking protocols. This "sell the price, buy the asset" behavior is a hallmark of sophisticated accumulation. Data from AInvest confirms that the declining exchange balance trend intensified through Q1 2026, even as ETH recorded its longest consecutive monthly losing streak in history.
The Supply Squeeze Thesis
Approximately 37 million ETH — 30% of total supply — is now locked in staking contracts, earning yields between 2.84% and 4.2% APY according to CoinLaw. Combined with shrinking exchange balances and ETF-held assets, the available liquid supply is being compressed from multiple vectors simultaneously. Geoffrey Kendrick, Global Head of Digital Assets Research at Standard Chartered, captured this structural shift: "I think 2026 will be the year of Ethereum, much like 2021 was," projecting that the ETH/BTC ratio could recover toward the 2021 high of 0.08, driven by stablecoin adoption, real-world asset tokenization, and scaling upgrades (via The Block).
The supply squeeze mechanics are straightforward: when demand returns — whether from ETF inflows, DeFi growth, or the upcoming Glamsterdam upgrade — it will meet a historically thin order book. For those monitoring Ethereum accumulation signals, the combination of declining exchange reserves, rising staking participation, and a nascent ETF inflow reversal creates the preconditions for explosive repricing. The 2022 bear market's exchange balance bottom preceded a 340% recovery; today's balances are even lower.
How the Glamsterdam Upgrade Could Impact ETH Price
Ethereum's upcoming Glamsterdam upgrade represents the most ambitious scaling leap since the Merge, targeting a 233% increase in gas limits from 60 million to 200 million — effectively tripling the network's raw throughput capacity. According to Phemex, the upgrade aims to push transaction throughput toward 10,000 TPS, roughly a 600% improvement over current capacity, while simultaneously slashing gas fees by an estimated 78.6%. With ETH trading at $2,330 on Binance as of March 17, 2026 — still down approximately 60% from its all-time high — the Glamsterdam upgrade arrives at a critical juncture where fundamental catalysts could finally close the gap between surging network activity and suppressed price. The upgrade is slated for the first half of 2026, and its implications extend far beyond raw performance metrics into the structural economics of the Ethereum ecosystem.
Gas Fee Reduction and L1 Competitiveness
The 78.6% reduction in gas fees directly addresses one of Ethereum's most persistent criticisms: prohibitive transaction costs that drove users and developers to Layer 2 solutions and competing chains. Current Ethereum L1 gas fees have made simple token transfers and DeFi interactions cost-prohibitive for retail users, pushing activity to rollups like Arbitrum, Optimism, and Base. Glamsterdam's fee compression could reverse this migration pattern by making L1 transactions economically viable again for a broader range of use cases.
This shift carries significant implications for ETH's fee-burning mechanism introduced by EIP-1559. If L1 activity increases as users return from L2s, the amount of ETH burned per block could rise substantially — even with lower per-transaction fees — provided total transaction volume grows proportionally. With daily smart contract calls already surpassing 40 million according to CoinDesk, a cheaper L1 could amplify this activity and tighten ETH's supply dynamics. For more context on Ethereum's evolving fee structure, see our Ethereum analysis hub.
Historical Upgrade-to-Price Patterns
Ethereum's major upgrades have historically acted as price catalysts — though with nuanced timing. The Merge in September 2022, which transitioned Ethereum to proof-of-stake, saw ETH rally approximately 90% in the two months preceding the event before correcting 35% in the month following completion — a classic "buy the rumor, sell the news" pattern. The Dencun upgrade in March 2024, which introduced proto-danksharding via EIP-4844, coincided with a broader market rally that took ETH from $2,300 to above $3,900 within three months.
Glamsterdam's scope is arguably more transformative than Dencun's incremental blob-space improvements, drawing closer comparisons to the Merge in terms of network-level impact. However, the current macro environment differs: ETH faces headwinds from six consecutive months of decline and $2.76 billion in ETF outflows over the past four months, per AInvest. The question is whether Glamsterdam can break this cycle.
RWA and Stablecoin Infrastructure as Institutional Catalysts
Beyond raw throughput, Glamsterdam's capacity expansion positions Ethereum as the de facto settlement layer for real-world asset (RWA) tokenization and stablecoin infrastructure. Ethereum already hosts approximately $162 billion in stablecoin supply — roughly 52% of the global total, according to CoinDesk. A 10,000 TPS network with dramatically lower fees removes a key friction point for institutional adoption of on-chain treasury management, tokenized bonds, and cross-border settlement.
With the EU's MiCA framework now fully operational and the U.S. SEC signaling clearer regulatory pathways for tokenized securities, the timing aligns institutional demand with infrastructure readiness. Ethereum's TVL of $56.64 billion as of March 15 — up 5.4% week-over-week per Cryip.co — suggests capital is already positioning ahead of Glamsterdam's potential to make Ethereum the institutional-grade blockchain that traditional finance requires.
Historical Comparison: How Did ETH Perform After the 2018 and 2022 RSI Bottoms?
Ethereum's weekly RSI hovering near the 30 threshold has only occurred three times in the asset's eight-year trading history — and each prior instance marked the beginning of a multi-year recovery cycle that delivered triple- to quadruple-digit returns. According to FX Empire, the weekly RSI touching the 30 level represents a statistically rare oversold condition that has historically preceded ETH's most explosive rallies. With the current drawdown measuring approximately 60% from the all-time high — notably shallower than the 82% collapse in 2022 — the historical data suggests that recovery potential may be substantial, albeit with different magnitude and timing characteristics than previous cycles. Understanding these patterns requires examining each prior RSI bottom in granular detail.
Quick Answer: Ethereum's weekly RSI near 30 has historically signaled cycle bottoms — the 2018 RSI bottom at 28 preceded a 5,566% rally from $83 to $4,700, while the 2022 bottom led to a 290% recovery from $1,000 to $3,900. The current drawdown of ~60% is shallower than 2022's 82% decline, potentially indicating stronger recovery potential this cycle.
The 2018 RSI Bottom: From Capitulation to Historic Highs
In December 2018, Ethereum's weekly RSI plunged to 28 as ETH cratered to $83 — an astounding 94% decline from its January 2018 peak of approximately $1,430. The crypto market was in the depths of the post-ICO bear market, with trading volumes evaporating and mainstream media declaring the death of altcoins. Yet that RSI reading of 28 marked the precise cycle floor.
What followed was a slow, grinding recovery through 2019 and early 2020, with ETH languishing between $100 and $300 for over 18 months. The catalyst that ultimately ignited the next leg came from the DeFi Summer of 2020, when on-chain activity exploded — total value locked surged from under $1 billion to over $15 billion within months. ETH's price followed with a lag, climbing from $230 in July 2020 to $4,700 by November 2021, delivering a 5,566% return from the RSI bottom over approximately three years. The critical lesson: network activity led price by several months, a pattern that appears to be repeating in 2026 with daily active addresses hitting 2 million and smart contract calls exceeding 40 million per day, according to CoinDesk.
The 2022 RSI Bottom: A Faster Recovery Cycle
The 2022 bear market saw ETH collapse from $4,878 to $881 in June 2022 — an 82% drawdown that coincided with the Terra/Luna collapse and cascading liquidations across centralized lenders. The weekly RSI again approached the 30 zone, signaling extreme oversold conditions. Unlike the prolonged bottoming process of 2018-2019, the 2022 recovery was comparatively compressed: ETH climbed from approximately $1,000 at its oversold nadir to $3,900 within roughly two years, delivering a 290% return.
Several structural differences accelerated the 2022 recovery compared to 2018. The Merge upgrade in September 2022 eliminated ETH's proof-of-work inflation, fundamentally altering the supply dynamics. Institutional products like ETH futures ETFs provided new capital on-ramps. And the broader ecosystem had matured — DeFi protocols, NFT infrastructure, and Layer 2 rollups provided tangible utility that the 2018 ecosystem lacked. For a deeper dive into Ethereum's cycle dynamics, visit our ETH price forecast page.
ETH/BTC Ratio: The Altseason Indicator
Beyond the absolute RSI readings, the ETH/BTC ratio provides crucial context for cycle positioning. Currently, the ETH/BTC ratio has declined approximately 31% — a level that closely mirrors previous pre-rally patterns. As crypto analyst Michaël van de Poppe observed: "The ETH versus BTC chart is beginning to resemble the same stride pattern seen before the last major crypto bull run," noting that the ratio's decline matches the 30-40% drawdowns that historically preceded 300%+ ETH/BTC rallies, according to CoinDesk.
In both the 2018-2021 and 2022-2024 cycles, ETH underperformed BTC during the initial accumulation phase before dramatically outperforming during the parabolic expansion phase. With BTC dominance currently at 56.7% and ETH dominance compressed to just 10.7%, the ratio compression is consistent with late-stage accumulation rather than structural decline.
Cycle Comparison Table: RSI Bottoms and Recovery Metrics
| Metric | 2018 RSI Bottom | 2022 RSI Bottom | 2026 Current |
|---|---|---|---|
| Weekly RSI Low | 28 | ~30 | ~30 |
| Price at RSI Bottom | $83 | ~$1,000 | ~$2,066 |
| Peak-to-Trough Decline | -94% | -82% | ~-60% |
| Subsequent Peak | $4,700 | $3,900 | TBD |
| Recovery Return | +5,566% | +290% | TBD |
| Time to Recovery Peak | ~3 years | ~2 years | TBD |
| ETH/BTC Ratio Decline | ~40% | ~35% | ~31% |
| Key Catalyst | DeFi Summer 2020 | The Merge + Institutional ETFs | Glamsterdam + RWA Adoption |
| Exchange Balance Trend | Rising (sell pressure) | Declining | Multi-year low (16M ETH) |
| Staking Lock-up | N/A (PoW era) | ~15% staked | ~30% staked (37M ETH) |
Why This Cycle Could Be Different
The 2026 setup differs from previous RSI bottoms in several structurally bullish ways. First, the drawdown depth of approximately 60% is significantly shallower than the 82% (2022) and 94% (2018) declines, suggesting the floor may be higher relative to the previous cycle's peak. Second, supply-side dynamics are tighter than ever: exchange balances have fallen to 16 million ETH — a multi-year low per AInvest — while approximately 30% of total supply (37 million ETH) is locked in staking contracts, per Phemex.
Third, the current decoupling between record network activity and declining price mirrors the 2020 DeFi Summer pattern, when on-chain metrics surged months before price followed with a 3,000%+ rally. Ethereum's TVL has climbed to $56.64 billion, daily active addresses hit 2 million in February, and stablecoin supply on the network exceeds $162 billion. The fundamental divergence cannot persist indefinitely — historically, price has always re-converged with network utility, though the timing remains uncertain. For investors tracking these signals, the Fear and Greed Index at 28 (Fear) confirms the sentiment backdrop aligns with previous accumulation windows that preceded Ethereum's most powerful rallies.
ETH Price Scenarios: Bull, Neutral, and Bear Case Analysis
What are the realistic price paths for Ethereum over the coming weeks and months? With ETH trading at $2,329 as of March 17, 2026—up 3.48% in 24 hours on Binance—the token sits at a critical inflection point after six consecutive monthly declines, the longest losing streak in Ethereum's history according to AInvest. The pivot level at $2,060 has been reclaimed on the daily chart, but the 50-day SMA at $2,188 and R1 resistance at $2,378 remain the key battlegrounds that will determine direction, per Capital.com technical analysis. Three distinct scenarios emerge from current technical structure, on-chain fundamentals, and macro conditions. Each carries different probability weights depending on whether catalysts like the Glamsterdam network upgrade, sustained institutional ETF inflows, and a broader altseason rotation materialize in the weeks ahead. Here is a detailed breakdown of what traders and investors should prepare for in each case.
Bull Scenario: Breakout Above $2,378 Targets $3,394
The bullish case requires ETH to decisively clear R1 resistance at $2,378—a level nearly touched at the 24-hour high of $2,386 on Binance. A confirmed breakout opens the path toward R2 at $2,792, then the 200-day SMA near $3,394, representing roughly 45% upside from current prices per Capital.com.
Three catalysts could ignite this move. The Glamsterdam upgrade—targeting a gas limit increase from 60M to 200M and throughput of 10,000 TPS according to Phemex—would fundamentally reshape Ethereum's scalability narrative if deployed on schedule in H1 2026. Spot ETF inflows showed early recovery signs with $57 million on March 11 alone per Blockhead, hinting that institutions are buying the dip after $2.76 billion in cumulative outflows over four months. The ETH/BTC ratio's 31% decline also mirrors pre-rally patterns from prior cycles, as analyst Michaël van de Poppe noted via CoinDesk.
Where could the upside extend? Standard Chartered's Geoffrey Kendrick projects ETH could surpass $5,000 if the ETH/BTC ratio recovers toward 0.08—its 2021 cycle peak—as reported by The Block. FX Empire's Alejandro Arrieche goes further, targeting $6,400 based on weekly RSI cycle bottom signals that preceded massive rallies in both 2018 (5,566%) and 2022 (290%) per FX Empire.
Neutral Scenario: $1,990–$2,378 Range-Bound Consolidation
The base case sees ETH oscillating between the 20-day SMA at $1,990 and R1 at $2,378 for several weeks. Supporting this view, the ADX reads 23.4—below the 25 threshold required to confirm a directional trend—according to Capital.com. Binance perpetual funding rates remain near neutral at 0.0020%, suggesting neither bulls nor bears hold decisive leverage in the derivatives market. The Fear & Greed Index at 28 (Fear) indicates sentiment has room to improve but lacks the extreme capitulation readings that typically mark definitive bottoms. In this scenario, the $56.64 billion TVL according to Cryip.co and record network activity—daily active addresses touching 2 million in February per CoinDesk—provide a fundamental floor, while macro uncertainty and lingering ETF outflow concerns cap the upside.
Bear Scenario: Breakdown Below $1,647 Risks $1,400 Zone
The bearish path activates if ETH loses S1 support at $1,647 on a daily closing basis. A confirmed breakdown would expose the $1,400–$1,500 demand zone—levels not tested since the 2022 bear market recovery phase. Triggers for this scenario include renewed ETF outflows beyond the $2.76 billion already withdrawn per AInvest, broader macro deterioration in risk assets, or a delay in the Glamsterdam upgrade timeline. Regional discount dynamics across major Asian exchanges—where ETH has traded at a persistent discount to Western spot prices—signal that local traders remain cautious about near-term recovery prospects. For deeper analysis on how Ethereum's network fundamentals interact with price action during extended downtrends, tracking the widening gap between on-chain growth and token valuation remains essential. The six-month bearish momentum, combined with a roughly 60% drawdown from Ethereum's all-time high, demands that participants on the long side maintain strict risk parameters at all times.
Investor Watchpoints: ETH Entry Timing and Risk Management Strategy
How should investors position themselves for Ethereum's next major move? The convergence of a historically rare weekly RSI near 30, exchange balances at multi-year lows of 16 million ETH per AInvest, and approximately 30% of total supply locked in staking according to Phemex creates a textbook asymmetric setup. This supply compression structure means that when a demand catalyst eventually arrives—whether from Glamsterdam deployment, sustained ETF inflows, or a decisive shift in macro sentiment—the price response could be significantly amplified. History supports this thesis: after the weekly RSI touched comparable levels in 2018 and 2022, ETH rallied 5,566% and 290% respectively per FX Empire. The challenge is timing the entry amid persistent downside momentum and a Fear & Greed Index reading of just 28, firmly in the Fear zone as of March 17, 2026.
Key Indicators to Monitor Weekly
Three signals should top every ETH investor's watchlist. First, the weekly RSI's position relative to the 30 level: a confirmed bounce above 30 with rising momentum has historically marked durable cycle bottoms across Ethereum's eight-year price history. Second, a sustained reclaim of the 50-day SMA at $2,188 on a closing basis would confirm the structural shift from bearish to neutral, according to Capital.com. Third, ETF flow direction matters critically—after four months of net outflows totaling $2.76 billion, the $57 million single-day inflow on March 11 per Blockhead needs confirmation through consecutive positive-flow days to signal genuine institutional re-accumulation. On the derivatives front, a shift in Binance funding rates—currently near neutral at 0.0020%—toward sustained positive territory would indicate growing bullish conviction among leveraged traders.
DCA Strategy Zones and Risk Parameters
For investors seeking measured exposure, a dollar-cost averaging approach within the $1,647–$2,060 zone—the range below the pivot level—offers a structured entry framework. Splitting capital into three to five tranches across this range reduces the risk of mistiming a single entry in a volatile market still gripped by fear. The stop-loss benchmark sits at S1 support of $1,647: a daily candle closing below this level, confirmed by above-average sell volume on Coinglass, would invalidate the accumulation thesis and warrant reducing or exiting positions. On the upside, the Glamsterdam upgrade timeline serves as an event-driven catalyst—once a firm deployment date is confirmed, positioning ahead of the upgrade while maintaining tight risk parameters aligns with the historical pattern of sharp rallies around major Ethereum network events. Given the current environment of extreme fear and six months of relentless declines, disciplined position sizing and predefined exit levels are not optional—they are survival requirements.
Disclaimer: This analysis is provided for informational and educational purposes only and does not constitute investment advice. Cryptocurrency markets carry substantial risk, including the potential for complete loss of principal. Always conduct independent research and consult a licensed financial advisor before making any investment decisions.
Frequently Asked Questions
Is Now a Good Time to Buy Ethereum? A March 2026 Entry Timing Analysis
Multiple on-chain and technical indicators are flashing bullish signals for Ethereum in March 2026, but significant risks remain. On the positive side, the weekly RSI has touched the 30 zone — a historically rare cycle-bottom signal — while exchange balances have dropped to a multi-year low of 16 million ETH, suggesting holders are withdrawing rather than selling, according to AInvest. Daily active addresses surpassed 2 million in February, exceeding the 2021 bull market peak, per CoinDesk. However, ETH has endured six consecutive monthly declines — its longest losing streak in history — with a YTD loss of 31.1%, and the Crypto Fear & Greed Index sits at an extreme-fear reading of 15. For investors considering exposure, a dollar-cost averaging (DCA) strategy across the $1,800–$2,100 range may offer a risk-managed approach to capitalize on potential upside while mitigating further drawdown risk. For a deeper look at current momentum, see our Ethereum price analysis.
Why Is Ethereum's RSI at 30 Considered a Cycle Bottom Signal?
Ethereum's weekly Relative Strength Index (RSI) touching the 30 threshold is an exceptionally rare event — it has occurred only three times in eight years: during the 2018 bear market bottom, the June 2022 capitulation, and now in March 2026. Financial analyst Alejandro Arrieche of FX Empire noted, "The RSI is hovering above 30, and the price seems to have been making a strong floor at $1,800," projecting a $6,400 target based on this pattern. In both prior instances, ETH subsequently rallied by thousands of percent — the 2018 bottom near $80 preceded a run to $4,800, and the 2022 low around $880 led to a recovery above $4,000. It is critical to emphasize, however, that past performance does not guarantee future results, and macro conditions, regulatory shifts, or protocol-level failures could invalidate the pattern entirely. Traders should use RSI as one confluence factor within a broader analytical framework, not a standalone buy signal. Learn more about reading these technical indicators on our crypto trading guide.
How Will the Glamsterdam Upgrade Impact Ethereum's Price?
Ethereum's upcoming Glamsterdam upgrade, targeted for the first half of 2026, is designed to increase the gas limit from 60 million to 200 million, slashing gas fees by an estimated 78.6% and pushing throughput toward 10,000 transactions per second, according to Phemex. This leap in Layer-1 scalability could re-establish Ethereum's competitive edge against high-throughput chains like Solana and Avalanche, while dramatically improving the economics for real-world asset (RWA) tokenization and stablecoin settlement — Ethereum already hosts approximately $162 billion in stablecoin supply, commanding roughly 52% of global market share, per CoinDesk. Geoffrey Kendrick, Global Head of Digital Assets Research at Standard Chartered, stated that "2026 will be the year of Ethereum," citing scalability upgrades and institutional adoption as key drivers, as reported by The Block. Historically, major Ethereum upgrades have produced mixed short-term price action — the Merge in September 2022 triggered a "sell-the-news" drop, while the Dencun upgrade in March 2024 coincided with a sustained rally. Investors should monitor post-upgrade network metrics closely via our Ethereum network updates page.
Why Does Declining Exchange Balance Signal a Potential ETH Price Increase?
Ethereum's exchange balance falling to 16 million ETH — a multi-year low — is a powerful supply-side indicator because tokens withdrawn from exchanges typically reflect reduced selling intent and a shift toward long-term holding or staking. When investors move ETH off centralized platforms, the immediately available liquid supply contracts; if demand increases while supply shrinks, the resulting "supply squeeze" can amplify price appreciation sharply. This dynamic is compounded by the fact that approximately 30% of ETH's total supply — around 37 million ETH — is locked in staking contracts, according to Phemex, further restricting circulating supply. Notably, this accumulation pattern is occurring despite six consecutive months of price decline and $2.76 billion in ETF outflows over four months, per AInvest — a divergence that crypto analyst Michaël van de Poppe compared to the stride pattern seen "before the last major crypto bull run," as reported by CoinDesk. For real-time on-chain tracking, visit our on-chain data dashboard.
Data Sources
- Capital.com — ETH price data, Fear & Greed Index
- CoinDesk — Network activity, stablecoin supply, analyst commentary
- Cryip.co — Ethereum TVL weekly data
- AInvest — ETF flows, exchange balance, historic streak data
- Blockhead — Institutional ETF inflow data
- Phemex — Staking statistics, Glamsterdam upgrade details
- FX Empire — RSI technical analysis
- The Block — Standard Chartered institutional outlook
This article is for informational purposes only and does not constitute investment advice. All investment decisions should be made based on your own judgment and responsibility.
Related Articles
- Bitcoin $70K Battle: Exchange Reserves Hit 7-Year Low Amid 5-Month Decline — Full On-Chain & Futures Breakdown
- Bitcoin On-Chain Deep Dive: Exchange Reserves Hit 7-Year Low as Whales Accumulate 91K BTC — Bottom Signal?
- ETH, SOL & AVAX Deep Dive: Whale Accumulation and ETF Momentum Amid Extreme Fear (March 2026)
- Meme Coin Market Cap Down 75% — Capitulation or Bottom? DOGE, SHIB, PEPE Technical Analysis
- SEC-CFTC Historic MOU Signed, CBDC Ban Passed — Full Breakdown of the U.S. Crypto Regulatory Shift in March 2026