Crypto Bear Market Survival Guide 2026: DCA, Staking & Security Strategies
Fear & Greed at 11: data-backed DCA, staking APY picks, and security strategies to survive the 2026 bear market.
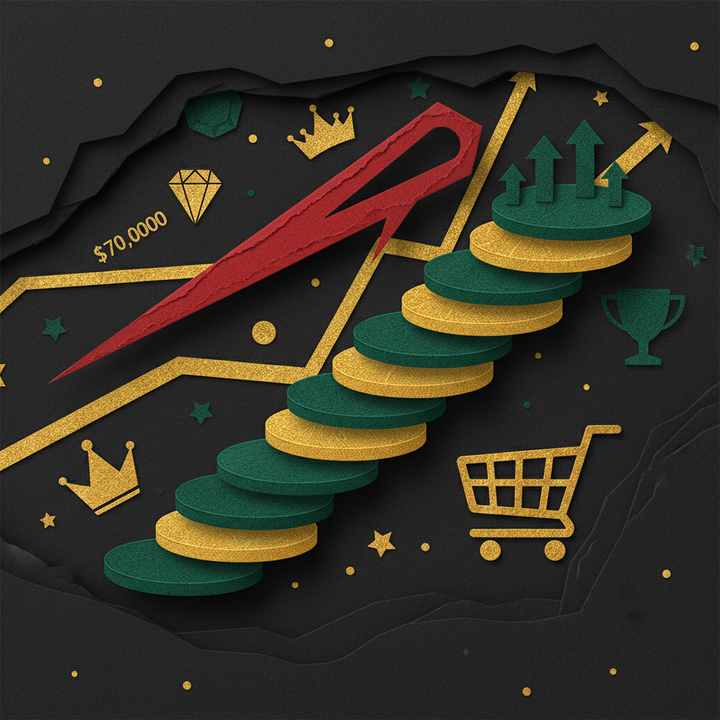
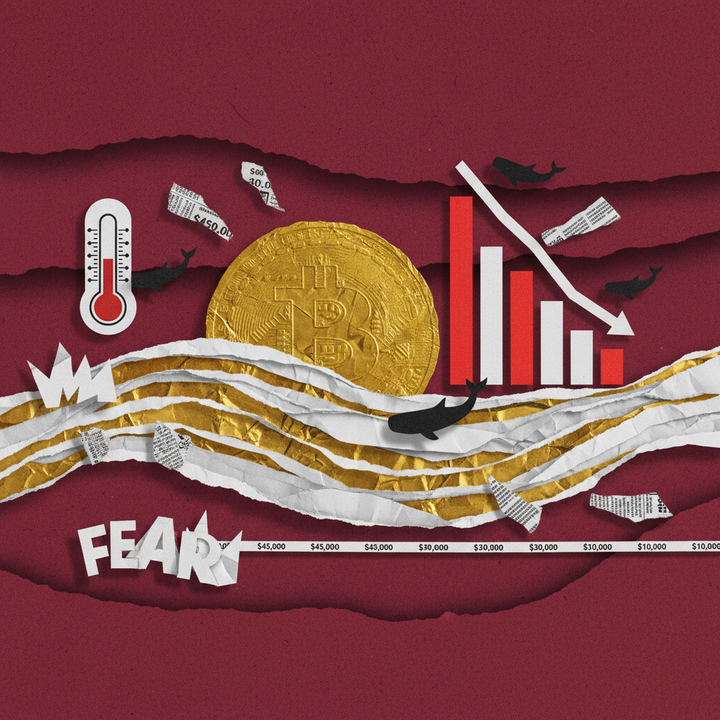
The crypto market is deep in extreme fear territory, with the Fear & Greed Index plunging to just 11 out of 100 — but history shows these moments create the most explosive wealth-building opportunities. This comprehensive guide covers the three essential pillars of bear market survival: dollar-cost averaging (DCA) for systematic accumulation, staking for passive income generation, and self-custody security to protect every satoshi you own.
Fear & Greed Index at 11: How Smart Investors Profit During Extreme Fear
Quick Answer: The three pillars of bear market survival are dollar-cost averaging (DCA) for disciplined accumulation, staking for 3–15% APY passive income, and self-custody security. With BTC at $70,826 — down 43% from its $126,080 all-time high — and the Fear & Greed Index at 11, historical data shows investors who entered at similar extreme fear levels earned between 500% and 2,056% returns over subsequent cycles.
The Crypto Fear & Greed Index measures market sentiment on a 0–100 scale, where readings below 25 signal "extreme fear" — historically the most profitable entry zones for long-term investors. As of March 20, 2026, the index sits at just 11 out of 100, according to Alternative.me, representing a 12-point drop from the previous day and placing the market in rarefied territory seen only during the most severe capitulation events in crypto history. Bitcoin currently trades at $70,826, a staggering 43% below its all-time high of $126,080 set in October 2025, per 247 Wall St. The total market capitalization stands at $2.51 trillion with BTC dominance at 56.6%, while negative funding rates across ETH (−0.0059%), SOL (−0.0049%), and XRP (−0.0036%) on Binance confirm widespread bearish positioning in derivatives markets. Yet paradoxically, these precise conditions have preceded the strongest multi-year rallies in Bitcoin's entire history.
Current Market Snapshot: Fear at Historic Extremes
Today's extreme fear reading of 11 places the market in a rare historical category. Only a handful of dates in crypto history have registered readings at or below 10 on the Fear & Greed Index, with the all-time low of 6 recorded on June 19, 2022, according to Alternative.me. During that period, BTC traded near $17,600 — and investors who held through that capitulation subsequently saw prices surge to $126,080 within 40 months. Across Asia-Pacific exchanges, regional premium indicators are flashing unusual signals: Bitcoin trades at a slight discount to global spot prices on major Asian platforms, suggesting institutional capital is repositioning while long-term accumulators quietly build positions.
The derivatives landscape paints an equally telling picture. Bitcoin's funding rate on Binance sits at a modest 0.0008%, indicating near-neutral perpetual futures positioning, while altcoin funding rates are decisively negative. This divergence mirrors patterns seen in previous capitulation events where BTC stabilized before leading a broader market recovery. For a deeper analysis of how bear market indicators shape smart accumulation strategies, the historical data is unambiguous: extreme fear has consistently been the optimal time to build long-term positions.
Historical Returns After Extreme Fear Events
Every instance of the Fear & Greed Index dropping to 10 or below has preceded a massive rally. The following table tracks the four most significant extreme fear events and their subsequent returns:
| Extreme Fear Event | Date | Fear Index | BTC Price | Subsequent Peak | Time to Peak | Return |
|---|---|---|---|---|---|---|
| 2018 Bear Market Bottom | Dec 2018 | ~10 | $3,200 | $68,789 (Nov 2021) | 35 months | +2,050% |
| COVID-19 Crash | Mar 2020 | ~8 | $3,850 | $68,789 (Nov 2021) | 20 months | +1,687% |
| Luna/3AC Contagion | Jun 2022 | 6 | $17,600 | $126,080 (Oct 2025) | 40 months | +616% |
| FTX Collapse | Nov 2022 | ~10 | $15,476 | $126,080 (Oct 2025) | 35 months | +715% |
| Current Market | Mar 2026 | 11 | $70,826 | — | — | — |
Sources: Alternative.me, CoinTelegraph, BeInCrypto
The pattern is unmistakable: every single instance of the Fear & Greed Index dropping to 10 or below preceded a rally of at least 500%, with the most extreme example — December 2018 — delivering over 2,050% gains within three years. The average recovery time from extreme fear bottoms to previous all-time highs has been approximately 26 to 36 months, according to BeInCrypto. Today's reading of 11 places the current market squarely within that historically explosive zone.
What This Survival Guide Covers
This bear market survival guide is built around three synergistic strategies designed to maximize returns during periods of extreme fear:
- Dollar-Cost Averaging (DCA): Systematic accumulation strategies that turned $10 per week into $7,913 over five years — a 202% return even through multiple crashes.
- Staking & Passive Income: How to earn 3–15% APY on major assets like ETH, SOL, and DOT while waiting for market recovery.
- Self-Custody & Security: Protecting your portfolio with hardware wallets and operational security practices that eliminate exchange counterparty risk.
Each strategy is backed by verifiable on-chain data and real performance metrics — no speculation, no hopium, just the frameworks that have historically separated profitable investors from those who panic-sold at the bottom.
Why Dollar-Cost Averaging Outperforms Lump-Sum Buying in Bear Markets
Dollar-cost averaging (DCA) is an investment strategy where you invest a fixed dollar amount at regular intervals — weekly, bi-weekly, or monthly — regardless of the asset's current price. This mechanical approach eliminates the impossible task of timing market bottoms while automatically purchasing more units when prices are low and fewer when prices rise. According to data published by CoinTelegraph, a $100-per-week Bitcoin DCA strategy executed over five years produced a portfolio worth $42,508 — a 62.9% return that outpaced the S&P 500's 43.6% gain over the identical period. Even more striking, investors who maintained DCA discipline through the catastrophic FTX collapse in November 2022 achieved 192.47% cumulative returns, outperforming lump-sum buyers by 33 percentage points, according to Spoted Crypto's DCA analysis. In a market where the Fear & Greed Index sits at 11 and emotions run at extremes, DCA provides the disciplined framework that separates profitable investors from panic sellers.
The Math Behind DCA: Real Performance Data
The numbers make a compelling case for systematic accumulation over market timing. Even modest weekly investments have generated life-changing returns during volatile periods:
| Strategy | Period | Total Invested | Portfolio Value | Return |
|---|---|---|---|---|
| $10/week BTC DCA | 5 years (2019–2024) | $2,610 | $7,913 | +202.03% |
| $100/week BTC DCA | 5 years | $26,100 | $42,508 | +62.9% |
| $100/week S&P 500 | 5 years | $26,100 | $37,470 | +43.6% |
| DCA through FTX crash | 2022–2024 | Varies | — | +192.47% |
| Fear-augmented DCA | 7 years (2018–2025) | Varies | — | +1,145% |
Sources: CoinTelegraph, Spoted Crypto
The most revealing data point is the accessible $10-per-week strategy. With a total investment of just $2,610 over five years, investors accumulated a portfolio worth $7,913 — a 202% return that required no technical analysis, no chart reading, and no attempt to predict market direction. Bitcoin's DCA performance outpaced the S&P 500 by 19.3 percentage points over the same five-year window, confirming its position as the highest-performing DCA asset class of the past decade.
As Sminston With, a Bitcoin researcher featured by CoinTelegraph, explained: "Entry timing adjusts the range of outcomes, while long holding periods drive the majority of the results."
Why DCA Dominates During Market Crashes
DCA's true superpower emerges during periods of maximum fear — precisely the conditions investors face today. When FTX collapsed in November 2022 and BTC crashed to $15,476, the natural human instinct was to stop buying or sell entirely. Yet investors who maintained their weekly DCA schedule through the wreckage accumulated Bitcoin at prices 77% below the previous all-time high, locking in a 192.47% return that exceeded lump-sum strategies by a full 33 percentage points.
The most sophisticated DCA practitioners take this further with fear-augmented strategies — doubling or tripling their regular investment amount when the Fear & Greed Index enters extreme fear territory. Over a seven-year backtesting period from 2018 to 2025, this approach generated a staggering 1,145% return, outperforming standard buy-and-hold by 99 percentage points, according to Spoted Crypto research. With today's index at 11, this strategy would trigger maximum allocation — historically the single most profitable positioning across all four previous extreme fear events documented above.
Raoul Pal, founder and CEO of Real Vision and former Goldman Sachs executive, reinforced this disciplined approach: "Crypto is the highest-performing asset class in history. You need to have patience and use dollar-cost averaging to navigate the volatility."
Choosing Your DCA Frequency: Daily, Weekly, or Monthly
The optimal DCA interval depends on your capital availability, commitment level, and transaction cost tolerance. Here is how the three most common frequencies compare in practice:
Daily DCA offers the smoothest cost averaging and captures intraday volatility, but generates the highest number of transactions and may incur greater exchange fees on platforms like Binance or OKX. This frequency is best suited for fully automated strategies using exchange recurring-buy features, where the investor sets it once and never touches it again.
Weekly DCA — the most popular interval among both institutional and retail investors — strikes the ideal balance between cost smoothing and practicality. The five-year performance data cited above used weekly intervals, producing the documented 62.9% and 202% returns. Most major exchanges now support automated weekly purchases with zero additional fees beyond standard trading commissions.
Monthly DCA requires the least maintenance and works well for larger sums deployed on a paycheck cycle. However, monthly intervals capture less price volatility and can result in buying at monthly highs if timing aligns poorly with short-term market swings. Research from CoinTelegraph indicates weekly DCA has historically outperformed monthly DCA by 3–7 percentage points over multi-year periods due to superior volatility harvesting.
Regardless of frequency, the critical factor is consistency. The investors who achieved 192.47% returns through the FTX crash didn't succeed because they chose the perfect interval — they succeeded because they never stopped buying. With Bitcoin's long-term price trajectory historically rewarding patient accumulators, the best DCA strategy is the one you can sustain through every market condition without hesitation.
How Much Has Bitcoin Recovered After Extreme Fear Events in History?
Quick Answer: Every Bitcoin bear market on record — from the 84% crash of 2018 to the 77.6% drawdown of 2022 — has been followed by a full recovery and a new all-time high. With BTC currently 43% below its $126,080 ATH and the Fear & Greed Index at 11, historical patterns suggest patient investors have been rewarded with 500%–2,056% gains from similar extreme-fear zones.
Bitcoin's cyclical nature has consistently punished panic sellers and rewarded patient accumulators. Since 2018, every major crash that pushed the Crypto Fear & Greed Index into extreme-fear territory has ultimately resolved with price surging past the previous cycle's peak. Today, with BTC trading at $70,826 — a 43% decline from the October 2025 all-time high of $126,080 according to 247 Wall St — and the Fear & Greed Index registering just 11 out of 100, the market is once again deep inside the zone that has historically preceded multi-year bull runs. Understanding past recovery timelines is not about guaranteeing future results; it is about contextualizing the current drawdown within Bitcoin's well-documented boom-and-bust architecture.
Bear Market Recovery Timeline: 2018–2025
The 2018 bear market remains one of the most brutal on record. Bitcoin plummeted from its then-ATH of approximately $20,000 in December 2017 to a low of $3,200 by December 2018 — an 84% peak-to-trough collapse. According to CoinTelegraph, it took 36 months — until December 2020 — for BTC to reclaim that previous high. The recovery was slow, grinding, and tested the conviction of even the most dedicated holders.
The March 2020 COVID-19 crash offered a starkly different recovery profile. Bitcoin fell to $3,850 on March 12 — a single-day decline of 39%. Yet the bounce was explosive: price doubled within six weeks, reclaimed the previous $20,000 ATH by December 2020, and then rocketed to $64,594 by April 2021 — just 13 months after the crash low. Investors who held through the panic saw gains exceeding 1,800% over four years.
The 2022 cycle followed the familiar script. From the November 2021 high of $69,000, Bitcoin ground down to $15,476 by November 2022 — a 77.6% drawdown intensified by the Terra/Luna implosion and the FTX collapse. The Fear & Greed Index hit a record low of 6 on June 19, 2022. According to BeInCrypto, BTC reclaimed the $69,000 level in approximately 26 months — faster than the 2018 recovery — before ultimately surging to a new ATH of $126,080 in October 2025.
Historical Bear Market Recovery Data
| Bear Market | ATH Before Crash | Cycle Low | Drawdown | Months to Recover ATH | Next ATH | Gain from Low |
|---|---|---|---|---|---|---|
| 2018 Crypto Winter | $20,000 | $3,200 | -84% | 36 months | $64,594 | +1,918% |
| 2020 COVID Crash | $10,500 | $3,850 | -63% | 6 weeks (2× recovery) | $64,594 | +1,578% |
| 2022 FTX / Luna | $69,000 | $15,476 | -77.6% | 26 months | $126,080 | +714% |
| 2025–2026 (Current) | $126,080 | $68,793* | -43%* | In progress | TBD | TBD |
*Current cycle low based on 24-hour trading range as of March 20, 2026. Drawdown measured from ATH.
What the Current Fear Index Tells Us
At 11, today's Fear & Greed Index is just five points above the all-time record low of 6 set during the 2022 capitulation. Historically, readings below 15 have coincided with generational buying opportunities. Investors who began a dollar-cost averaging strategy during crypto bear markets when the index was at or below 10 have recorded cumulative returns between 500% and 2,056%.
As Sminston With, a Bitcoin researcher featured by CoinTelegraph, noted: "Entry timing adjusts the range of outcomes, while long holding periods drive the majority of the results." The data supports this view: every extreme-fear episode in Bitcoin's history has been followed by a new all-time high, though recovery timelines have ranged from six weeks to 36 months.
With BTC dominance at 56.6% and total crypto market capitalization at $2.51 trillion, the current correction is significant but structurally different from previous cycles. Bitcoin's institutional infrastructure — including spot ETFs, corporate treasury adoption, and regulated derivatives markets — is materially more developed than during any prior bear phase. The negative funding rates currently visible across Binance perpetuals (ETH at -0.0059%, SOL at -0.0049%) confirm that bearish sentiment dominates the derivatives market, a condition that has historically preceded sharp mean-reversion rallies.
Which Staking Networks Offer the Best APY During a Bear Market?
Staking is the process of locking cryptocurrency in a proof-of-stake network to help validate transactions and secure the blockchain, earning token rewards in return. According to VentureBurn, approximately 28 million ETH — worth over $60 billion at current prices — is now staked on the Ethereum network, generating annual percentage yields of 3–4%. During bear markets, staking becomes a critical survival strategy: while token prices decline, staking rewards continue to compound, increasing an investor's total coin holdings so that when prices eventually recover, the portfolio benefits from both price appreciation and accumulated yield.
Network-by-Network APY Comparison
Not all staking opportunities are equal. Yields vary dramatically across networks, and so do the risks. Ethereum, the largest staking ecosystem by total value locked, offers a modest 3–4% APY, which translates to a real yield of approximately 2–3% after accounting for validator costs and potential slashing penalties. The relatively low yield reflects Ethereum's massive validator set and network maturity.
Solana presents a significantly more attractive yield profile. Base staking APY ranges from 6.8% to 8.2%, but delegating through MEV-enhanced validators like Jito can push effective returns to 7–9%. The trade-off is higher concentration risk and the potential for network outages that have historically impacted Solana's uptime.
Polkadot stands out with the highest APY among major networks at 12–15%, compensating stakers for the more complex nomination process and a 28-day unbonding period. Cardano, meanwhile, offers 2.8–4.5% APY but distinguishes itself with zero lock-up requirements — delegated ADA remains liquid and can be moved at any time, making it the most flexible staking option for risk-averse investors navigating volatile markets.
Staking APY, Lock-Up, and Risk Comparison
| Network | Staking APY | Real Yield (Est.) | Lock-Up Period | Slashing Risk | Key Consideration |
|---|---|---|---|---|---|
| Ethereum (ETH) | 3–4% | 2–3% | Variable (exit queue) | Yes | Largest TVL; liquid staking via Lido/Rocket Pool |
| Solana (SOL) | 6.8–8.2% | 5–7% | ~2-3 days (1 epoch) | Yes | Jito MEV boosts to 7–9%; network outage history |
| Polkadot (DOT) | 12–15% | 8–11% | 28 days unbonding | Yes | Highest major-network yield; complex nomination |
| Cardano (ADA) | 2.8–4.5% | 2–4% | None (fully liquid) | No | No lock-up; lowest risk profile; flexible exit |
The Compounding Advantage in a Bear Market
The strategic value of staking during a downturn extends beyond the stated APY. Consider a concrete example: an investor staking 100 SOL at 7.5% APY during a 24-month bear market would accumulate approximately 115.56 SOL through compounded rewards — a 15.56% increase in token holdings before any price recovery occurs. If SOL's price doubles during the subsequent bull cycle, the staker's position would be worth 2.31× the original value versus 2× for the non-staker, creating meaningful alpha purely from patience and yield accumulation.
This coin-quantity-growth strategy is particularly powerful when combined with dollar-cost averaging during bear markets. By regularly purchasing tokens at depressed prices and immediately staking them, investors simultaneously lower their cost basis and increase their total token count. The effect compounds over time: each newly staked batch begins generating its own yield, creating a snowball effect that accelerates portfolio growth heading into the next market cycle.
However, staking is not without risk. Slashing — the protocol-level penalty for validator misbehavior or downtime — can result in partial loss of staked assets on Ethereum, Solana, and Polkadot. Investors should evaluate validator performance history, diversify across multiple validators where possible, and factor in the opportunity cost of lock-up periods. During extreme volatility, the inability to quickly unstake (particularly DOT's 28-day unbonding) can leave investors exposed to further downside without the ability to exit.
Crypto Exchange Fees Compared: Where to Trade Cheapest in 2026
Exchange trading fees are the silent killer of long-term cryptocurrency returns, especially for investors employing dollar-cost averaging strategies during bear markets. With BTC trading at $70,826 as of March 2026 and the Fear & Greed Index sitting at an extreme fear reading of 11/100, cost-conscious accumulation has never been more critical. According to CoinGlass, Binance — the world's largest exchange by volume — processes over $1.4 billion in daily BTC trades alone, charging a base maker/taker fee of 0.10%, reducible by up to 25% when paying with BNB tokens. Meanwhile, Kraken offers high-volume traders maker fees as low as 0% and taker fees of just 0.10%, and Coinbase Advanced now provides a $29.99/month subscription that unlocks zero-fee trading. Over a five-year DCA horizon, even a 0.1 percentage point difference in fees compounds significantly — potentially costing thousands in lost returns.
2026 Major Exchange Fee Comparison
| Exchange | Maker Fee | Taker Fee | Fee Discount | Best For |
|---|---|---|---|---|
| Binance | 0.10% | 0.10% | 25% off with BNB | High-volume global traders |
| Kraken | 0.00%–0.25% | 0.10%–0.40% | Volume-tiered to 0% maker | Pro traders seeking zero maker fees |
| Coinbase Advanced | 0.00% | 0.00% | $29.99/mo Coinbase One subscription | US-based DCA investors |
| OKX | 0.08% | 0.10% | OKB token + VIP tiers | Spot and derivatives combo |
| Bybit | 0.10% | 0.10% | VIP volume tiers | Derivatives-focused traders |
The Compounding Cost of Fees on DCA Returns
For dollar-cost averaging investors, fees erode wealth far more than most realize. Consider a $100 weekly BTC DCA strategy over five years: at a 0.10% fee per trade, you pay approximately $1,300 in cumulative fees across 260 purchases. Drop that to 0.00% — as Coinbase Advanced's subscription or Kraken's top tier allows — and you redirect that entire amount into your growing position. According to CoinTelegraph research, a $100 weekly BTC DCA over five years returned 62.9%, turning $26,100 into $42,508. A 0.1 percentage point annual fee drag would have reduced that final balance by over $800 through compounding alone. As our comprehensive DCA strategy guide details, minimizing transaction friction is essential for maximizing bear-market accumulation returns.
Cross-Exchange Price Differentials: A Hidden Opportunity
Beyond posted fee schedules, experienced traders monitor cross-exchange and cross-regional price differentials for additional edge. As of March 2026, BTC shows a -0.57% negative premium across certain Asian exchanges compared to global benchmarks — a phenomenon historically known as an inverse Kimchi premium. Such negative premiums across Asian markets typically signal extreme local selling pressure and have historically preceded recovery phases. During the 2022 bear market bottom, similar inverse premiums of -1% to -3% appeared before BTC rallied from $15,476 to eventual new all-time highs above $126,080. While arbitraging these small differentials requires careful calculation of withdrawal fees and transfer times, awareness of regional pricing dynamics can help global DCA investors optimize both exchange selection and entry timing. Pair this with the lowest-fee platform for your volume tier, and you build a meaningful cost advantage that compounds over years of disciplined accumulation.
Hardware Wallets: Ledger vs Trezor — Which One Should You Choose?
Self-custody of cryptocurrency has become a non-negotiable security practice in 2026, particularly during extended bear markets when exchange insolvency risks escalate dramatically. The collapse of FTX in November 2022 — which wiped out approximately $8 billion in customer funds according to CoinDesk — remains the most devastating reminder of counterparty risk in crypto history. With BTC currently 43% below its all-time high of $126,080 and the Fear & Greed Index at an extreme fear level of 11/100, the temptation to leave assets on exchanges grows — but so does the risk. The two dominant hardware wallet manufacturers, Ledger and Trezor, offer fundamentally different security philosophies. According to CoinLedger, Trezor supports over 9,000 cryptocurrencies with a fully open-source codebase verified by the community, while Ledger covers 5,500+ assets using bank-grade Secure Element chips for enhanced tamper resistance.
Ledger vs Trezor: Head-to-Head Specification Comparison
| Feature | Ledger (Nano X / Stax) | Trezor (Model T / Safe 5) |
|---|---|---|
| Supported Assets | 5,500+ | 9,000+ |
| Security Architecture | Secure Element (SE) chip — bank-grade | General-purpose MCU — open-source auditable |
| Firmware | Partially open-source | 100% open-source |
| Connectivity | USB-C + Bluetooth | USB-C only |
| Touchscreen | Stax: Yes / Nano X: No | Model T & Safe 5: Yes |
| Price Range | $79–$399 | $69–$169 |
| Backup Method | 24-word seed phrase | 12/20/24-word seed + Shamir Backup |
| Best For | Maximum tamper resistance | Full transparency and community trust |
The philosophical divide between these two brands cuts to the core of crypto security debate. As Ethereum co-founder Vitalik Buterin emphasized in his 2025–2026 reflections published on KuCoin News: "Privacy is an important guarantee of decentralization: whoever owns the information owns the power, so we need to avoid centralized control of information." This principle extends directly to asset custody — when exchanges hold your private keys, they hold your financial sovereignty. Ledger's closed-source Secure Element chip provides hardware-level resistance to physical tampering, the same chip architecture used in credit cards and passports. Trezor counters that true security requires full public auditability — every line of their firmware is open for inspection, meaning vulnerabilities are found and patched by a global community rather than hidden behind proprietary walls.
Seed Phrase Security: Your Ultimate Backup Checklist
Your hardware wallet is only as secure as your seed phrase management. The seed phrase — a 12 to 24-word recovery key — is the single point of failure in any self-custody setup. Follow this essential checklist to protect your crypto holdings through the bear market and beyond:
- Write it offline only — never type your seed phrase into any digital device, email, or cloud storage service
- Use metal backup plates — paper degrades over time; steel or titanium seed storage solutions like Cryptosteel or Billfodl survive fire and flooding
- Store in multiple secure locations — keep at least two physical copies in separate geographic locations such as a home safe and a bank deposit box
- Consider Shamir Backup — Trezor's Shamir Secret Sharing splits your seed into multiple shares, requiring a minimum threshold to recover (e.g., 3-of-5 shares), eliminating single-point-of-compromise risk
- Never share with anyone — legitimate support teams will never ask for your seed phrase; any such request is a scam without exception
- Test recovery before funding — perform a full device wipe and recovery test with a small balance before transferring significant holdings to your wallet
For investors running a disciplined DCA strategy through the current bear market, periodically transferring accumulated assets from exchange wallets to hardware storage is a critical risk management step. Historical data shows that exchange failures tend to cluster during market downturns — precisely when your growing DCA position is most vulnerable. The 2022 bear market saw not only FTX but also Celsius, Voyager, and BlockFi collapse in rapid succession, collectively locking billions in user funds. Whether you choose Ledger's bank-grade chip security or Trezor's fully transparent open-source approach, the most important decision is simply moving your assets off centralized platforms and into your own custody before the next crisis strikes.
5 Critical Mistakes Every Bear Market Investor Must Avoid
Bear markets don't just punish weak portfolios — they punish weak decision-making. With the Crypto Fear & Greed Index plunging to 11/100 (Extreme Fear) on March 20, 2026, emotional impulses are at their peak, and history shows that investors who act on panic consistently lock in the worst possible outcomes. The 2022 bear market, where BTC crashed 77.6% from $69K to $15,476, saw mass capitulation at the bottom — yet those same price levels became springboards for a rally to a new all-time high of $126,080 by October 2025, according to BeInCrypto. Understanding the five most common investor mistakes during downturns is not optional — it's the difference between surviving and thriving when the cycle turns. Here are the traps you must sidestep.
1. Panic Selling at Peak Fear
Selling during extreme fear has historically been the single worst timing decision an investor can make. When the Fear & Greed Index hit its all-time low of 6 in June 2022, BTC was trading near $17,600. Investors who capitulated at that level missed a subsequent 615% rally to $126,080. As Adam Livingston, Analyst at Swan Bitcoin, noted: "Purchasing Bitcoin consistently during drawdowns has historically produced stronger cumulative returns despite the price volatility" (CoinTelegraph via TradingView). Today's index reading of 11 mirrors that same capitulation zone — selling here means selling at historically proven inflection points.
2. Over-Leveraging in a Declining Market
Leverage amplifies losses just as effectively as it amplifies gains. Current Coinglass data shows ETH funding rates at -0.0059% and SOL at -0.0049% on Binance — negative rates that signal aggressive short positioning and heightened liquidation risk on both sides. BTC's 24-hour range of $68,793–$70,969 represents a 3.1% swing; at 10x leverage, that's a 31% portfolio move. During bear markets, cascading liquidations have historically wiped out leveraged positions within hours. If you can't afford to lose the capital, you can't afford the leverage.
3. Concentrating Everything in a Single Asset
BTC dominance currently sits at 56.6%, meaning nearly half the market's value resides outside Bitcoin. Investors who went all-in on Luna, FTT, or other single tokens during previous cycles lost everything. Diversification across BTC, ETH, established altcoins, and stablecoins reduces catastrophic single-point failure. A prudent bear market DCA strategy distributes capital across uncorrelated assets to preserve optionality for recovery.
4. Storing Seed Phrases Digitally
Bear markets shift attacker focus from market manipulation to outright theft. Storing seed phrases in cloud storage, email drafts, or screenshot folders creates a single point of compromise. Hardware wallets like Trezor (9,000+ supported assets, fully open-source) and Ledger (5,500+ assets, bank-grade secure element chip) eliminate this risk, according to CoinLedger. Your recovery phrase belongs on metal or paper, in a fireproof safe — never on a connected device.
5. Chasing Short-Term Trades Instead of Systematic DCA
Data overwhelmingly favors dollar-cost averaging over market timing. A $100/week BTC DCA over five years yielded $42,508 (+62.9%), outperforming equivalent S&P 500 DCA at $37,470 (+43.6%), per CoinTelegraph. Investors who deployed a fear-weighted DCA strategy — increasing purchases when the index dropped below 10 — generated 1,145% returns over 2018–2025, outperforming buy-and-hold by 99 percentage points according to Spoted Crypto research. The edge isn't timing — it's consistency.
2026 Bear Market Recovery Scenarios and Key Investor Watchpoints
Every crypto bear market in history has ended — and the recovery has always exceeded the previous peak. With BTC currently trading at $70,826, approximately 43% below its all-time high of $126,080 set in October 2025, investors are asking the critical question: how long until recovery? Historical cycle analysis from CoinTelegraph shows that previous bear markets have required 26 to 36 months to reclaim prior all-time highs — placing a potential recovery window between mid-2027 and early 2028 if the current drawdown follows historical patterns. However, several on-chain and macro indicators suggest the foundation for recovery may already be forming beneath the surface of extreme fear.
Historical Recovery Timelines: What Past Cycles Tell Us
The 2018 bear market saw BTC plunge 84% from $20,000 to $3,200 before requiring 36 months to reclaim its previous high in December 2020. The 2022 crash followed a shorter arc: a 77.6% decline from $69,000 to $15,476, with ATH recovery achieved in approximately 26 months, per BeInCrypto. The 2020 COVID crash was an outlier — a 39% single-day collapse to $3,850 followed by full ATH recovery in just 9 months and an eventual 1,800% gain over four years, according to CoinTelegraph. The trend is clear: recovery cycles are compressing, and each subsequent bear market bottom has been higher in absolute terms.
Current On-Chain Signals: Liquidity Is Waiting
Three critical metrics point to significant dry powder on the sidelines. First, the total stablecoin market capitalization has reached $317.94 billion — an unprecedented reserve of capital ready to deploy, per MEXC Research. USDT commands 60.68% market share at $187 billion, while USDC has surged to $75.7 billion — a remarkable 72% year-over-year growth that signals institutional capital accumulation. BTC dominance at 56.6% suggests capital hasn't fled crypto entirely; it's consolidated into the strongest asset. As Sminston With, Bitcoin Researcher, observed: "Entry timing adjusts the range of outcomes, while long holding periods drive the majority of the results" (CoinTelegraph via TradingView).
Your Bear Market Action Plan: 3 Steps to Execute Now
Step 1 — Automate Your DCA and Remove Emotion. Set recurring weekly or bi-weekly purchases on a trusted exchange. Historical data from Spoted Crypto's DCA research shows that investors who began systematic DCA when the Fear & Greed Index dropped below 10 achieved returns between +500% and +2,056%. With today's reading at 11, you're in that same statistical zone. Consider a fear-weighted approach: increase allocation amounts when extreme fear readings persist.
Step 2 — Deploy Idle Assets Into Staking. Bear markets are the optimal time to earn yield on holdings you plan to keep long-term. ETH staking currently offers 3–4% APY on roughly 28 million staked ETH, SOL delivers 6.8–8.2% (up to 9% with Jito MEV), and DOT leads major networks at 12–15% APY, according to VentureBurn. Compounding staking rewards during a downturn means you hold more units when prices recover.
Step 3 — Migrate to Self-Custody and Lock Down Security. Transfer significant holdings to a hardware wallet — Ledger or Trezor — and store your recovery phrase offline on metal or paper. Disable SMS-based 2FA in favor of hardware security keys. Bear markets test not just your conviction, but your operational security. The assets you protect today are the wealth you'll compound tomorrow. Extreme fear is temporary; disciplined preparation is permanent.
Frequently Asked Questions
Quick Answer: Below we address the most common questions investors face during bear markets — from optimal DCA entry timing (historically, starting when the Fear & Greed Index drops below 10 has yielded +500% to +2,056% returns) to staking yields, exchange custody risks, and typical bear market durations averaging 12–18 months.
When Is the Best Time to Start Dollar-Cost Averaging (DCA) During a Bear Market?
The short answer is: the best time to start DCA is now, regardless of where the market sits. Historically, however, investors who began dollar-cost averaging when the Crypto Fear & Greed Index plunged below 10 — a zone of extreme fear — have recorded returns between +500% and +2,056%. For context, the index hit an all-time low of 6 on June 19, 2022, during the depths of the Luna-FTX contagion; investors who maintained a disciplined $10/week BTC DCA through that turmoil realized a 192.47% return, outperforming lump-sum buyers by over 33 percentage points according to Spoted Crypto's DCA strategy analysis. Over a five-year window (2019–2024), a modest $10/week Bitcoin DCA turned $2,610 into $7,913 — a 202% gain that outpaced both gold and the Dow Jones.
As Bitcoin researcher Sminston With noted in a CoinTelegraph report: "Entry timing adjusts the range of outcomes, while long holding periods drive the majority of the results." The takeaway is clear — while extreme fear zones offer statistically superior entry points, DCA's true power lies in consistency, not precision timing. If you're looking for a comprehensive framework, our complete crypto DCA strategy guide breaks down weekly vs. monthly intervals, portfolio allocation models, and historical performance across multiple market cycles.
Which Cryptocurrencies Offer the Highest Staking Yields?
Staking rewards vary significantly across proof-of-stake networks, with Polkadot (DOT) currently leading major Layer-1 assets at 12–15% APY, followed by Solana (SOL) at 6.8–8.2%, and Ethereum (ETH) at a more conservative 3–4% according to data from VentureBurn. Ethereum's lower yield reflects the massive scale of its staking ecosystem — approximately 28 million ETH is currently locked in staking contracts, making it the most capital-intensive staking network in the industry. However, higher advertised APY does not automatically mean better risk-adjusted returns.
Investors must weigh three critical risk factors before chasing yield: slashing risk (validators can lose staked funds for downtime or malicious behavior), lock-up periods (some networks require 21–28 day unbonding windows during which assets cannot be sold), and network stability (newer chains with fewer validators carry higher systemic risk). A 15% yield means little if a network experiences a major exploit or if your tokens are locked during a 40% price crash. For long-term holders seeking passive income, diversifying staking across two or three established networks — such as ETH for security, SOL for growth exposure, and DOT for yield — is a more prudent approach than concentrating in the single highest-yield asset.
Is It Safe to Keep Crypto on an Exchange Without a Hardware Wallet?
The collapse of FTX in November 2022 — once the world's third-largest exchange with over $8 billion in missing customer funds — remains the most powerful argument against treating centralized exchanges as long-term custodians. While major platforms like Binance and Coinbase have since adopted proof-of-reserves audits, no exchange can guarantee 100% protection against insolvency, hacking, or regulatory seizure. The crypto industry's core principle, "not your keys, not your coins," exists precisely because exchange custody introduces counterparty risk that self-custody eliminates.
For practical purposes, a layered approach works best: keep only the funds you actively trade on exchanges, and move long-term holdings to a hardware wallet. Leading options include Ledger (supporting 5,500+ assets with bank-grade secure element chips) and Trezor (9,000+ assets, fully open-source firmware). If you're holding more than one month's trading capital on any single exchange, your risk profile likely warrants investing $70–$150 in a hardware wallet — a negligible insurance premium against catastrophic loss. For deeper guidance on securing your portfolio, explore our crypto wallet security guide.
How Long Do Bitcoin Bear Markets Typically Last?
Bitcoin has endured three major bear market cycles since its inception, and the data reveals a remarkably consistent pattern. The 2014–2015 bear market lasted approximately 14 months from peak to trough; the 2018 cycle saw 12 months of sustained decline; and the 2021–2022 downturn stretched roughly 13 months before bottoming. On average, Bitcoin bear markets involve 12–18 months of price decline from the all-time high, with full recovery to previous ATH levels taking 26–36 months. Bitcoin's most recent ATH stands at $126,080, set on October 6, 2025 according to BitDegree, and the current price represents approximately a 43% drawdown from that peak.
Adam Livingston, an analyst at Swan Bitcoin, observed: "Purchasing Bitcoin consistently during drawdowns has historically produced stronger cumulative returns despite the price volatility." This pattern is backed by data — a $100/week DCA over five years in BTC yielded $42,508 (+62.9%), compared to $37,470 (+43.6%) for the same strategy in the S&P 500, according to TradingView data via CoinTelegraph. While past performance doesn't guarantee future results, the historical rhyme of Bitcoin's cycles suggests that bear markets, while painful, have consistently rewarded patient, disciplined investors. For a data-driven analysis of current Bitcoin market cycle positioning, visit our dedicated tracker.
Data Sources
- Alternative.me — Crypto Fear & Greed Index
- CoinTelegraph via TradingView — DCA Long-Term Performance Data
- VentureBurn — Staking Platform Yield Comparisons
- CoinLedger — Ledger vs. Trezor Hardware Wallet Comparison
- BitDegree — Bitcoin Price & Fear/Greed Index Data
- Spoted Crypto — Crypto DCA Strategy Guide
This article is for informational purposes only and does not constitute investment advice. All investment decisions should be made based on your own judgment and responsibility.
Related Articles
- Crypto Fear & Greed Index Guide: How to Read It and Trade Smarter in 2026
- Crypto DCA Guide: 202% Returns Over 5 Years, Proven by Data
- The Complete Guide to Long-Term Crypto Investing in 2026: DCA, Staking & Self-Custody
- Kimchi Premium Explained: How It Works, Real Data & Investment Strategies in 2026
- Crypto Fear & Greed Index Guide: How to Read It and Trade Smarter in 2026