Bitcoin (BTC) is trading at $78,168 as of May 2, 2026 at 17:00 KST — up 1.36% on the day but still consolidating below the $80,000 psychological resistance. Exchange reserves have hit a 7-year low, whale wallets net-bought 270,000 BTC in April, and Binance futures show 62.8% of positions are short. The structural setup is charged. What happens next at $80K could define the entire month.
Total crypto market capitalization stands at $2.68 trillion. BTC dominance holds at 58.5%, reflecting capital anchored in Bitcoin rather than rotating into altcoins. The Fear & Greed Index reads 39/100 (Fear), though it has bounced 13 points from the prior session — cautious stabilization, not panic.
BTC Price USD: Current Levels and Key Zones
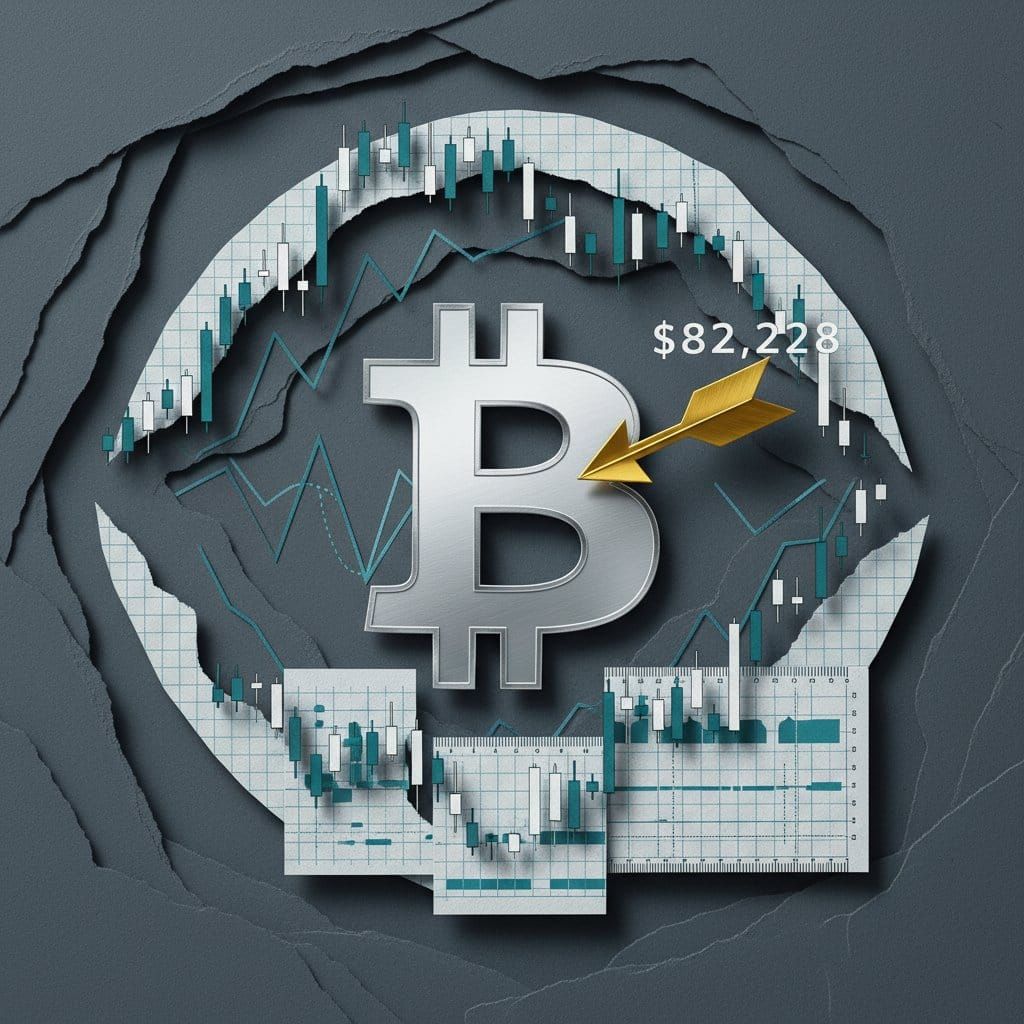
Quick Answer: Bitcoin trades at $78,168 on Binance (May 2, 17:00 KST), up 1.36%, with a 24h range of $77,048–$78,914. Daily RSI sits at ~60, recovering from a historic weekly low of 27.48 in March 2026. The 200-day MA at $82,228 has rejected Bitcoin seven months running — that level is the trade of the month.
On Binance, BTC ranked second by 24-hour volume with $1.2 billion traded, behind only USDC stablecoin flows at $1.3 billion. OKX confirms a near-identical price of $78,167, validating the level across major venues. Support and resistance are sharply defined: resistance at $80,000 (psychological) then $82,228 (200-day MA); support at $78,197 (immediate), $75,678, and $74,300 as deeper cushions.
| # | Coin | Price | 24h Change | Volume (24h) | High | Low |
|---|---|---|---|---|---|---|
| 1 | USDC | $1.00 | -0.01% | $1.3B | $1.00 | $1.00 |
| 2 | BTC | $78,168 | +1.36% | $1.2B | $78,914.12 | $77,048.00 |
| 3 | ETH | $2,300 | +0.89% | $373.9M | $2,325.28 | $2,277.06 |
| 4 | CHIP | $0.07 | +6.40% | $149.9M | $0.07 | $0.06 |
| 5 | SOL | $84 | -0.33% | $128.0M | $84.86 | $83.33 |
| 6 | DOGE | $0.11 | -0.32% | $94.5M | $0.11 | $0.11 |
| 7 | ZEC | $377 | +7.60% | $93.8M | $393.00 | $345.92 |
| 8 | USD1 | $1.00 | -0.04% | $92.1M | $1.00 | $1.00 |
| 9 | XRP | $1.38 | +0.71% | $62.8M | $1.40 | $1.37 |
| 10 | BNB | $616 | -0.30% | $48.7M | $622.84 | $613.79 |
Technical Analysis: RSI Recovery vs. a Seven-Month Ceiling
The daily RSI has recovered to approximately 60 — a significant rebound from the weekly RSI low of 27.48 recorded in March 2026. That reading was only the third occurrence in Bitcoin's entire history. The prior two instances, in 2015 and 2018, both marked generational cycle bottoms. This doesn't guarantee a repeat, but it gives the current price zone historical weight for investors tracking the Bitcoin market cycle.
The MACD has completed a bullish crossover on the daily chart. However, the Supertrend indicator remains bearish — meaning the trend structure hasn't officially reversed. This divergence between momentum signals (RSI, MACD pointing up) and trend signals (Supertrend pointing down) is the defining tension in Bitcoin's setup right now.
The 200-day moving average at $82,228 has rejected every breakout attempt for seven consecutive months. A high-volume confirmed close above this level would be the strongest bullish signal of 2026. Without it, the recovery remains a counter-trend bounce — meaningful, but not yet a trend change.
| Indicator | Current Reading | Signal |
|---|---|---|
| Daily RSI | ~60 | Neutral to Bullish |
| MACD | Bullish crossover | Bullish |
| Supertrend | Bearish | Bearish |
| 200-Day MA | $82,228 | Key Resistance (7 months unbroken) |
| Weekly RSI (March 2026 Low) | 27.48 | Historic Cycle Bottom Signal |
On-Chain: Whales Accumulate as Exchange Supply Disappears
Two on-chain data points define Bitcoin's structural backdrop in May 2026. Exchange BTC reserves have fallen to a 7-year low — the supply available for immediate sale is contracting sharply. Simultaneously, whale wallets net-accumulated approximately 270,000 BTC throughout April 2026 (source: CoinGlass, May 2, 2026). When large buyers absorb that volume off exchanges, the order book thins and the market becomes more sensitive to new demand.
Ki Young Ju, CEO of CryptoQuant, drew a direct comparison to late 2020: "The structure we're seeing — exchange BTC reserves at multi-year lows while large wallets continue absorbing supply off OTC desks — is reminiscent of Q4 2020," Ju stated on X (source: CryptoQuant). That period preceded Bitcoin's run from roughly $10,000 to over $60,000 through 2021. The parallel is structural, not a price target.
Retail on-chain activity is declining in parallel. Smaller wallet transaction counts have trended lower, consistent with a Fear & Greed reading of 39. Quiet retail paired with aggressive whale absorption is a classic early accumulation pattern. Follow ongoing on-chain updates in our market analysis section.
Derivatives: Bitcoin Is the Most Shorted Major Asset on Binance
Binance futures data tells an unambiguous story: BTC long/short ratio sits at 37.2% long versus 62.8% short — making Bitcoin the most heavily shorted major asset on the board. The funding rate is negative at -0.0051%, meaning short positions are paying longs to stay open. Historically, heavy short positioning combined with negative funding creates the mechanical conditions for a short squeeze if spot prices break higher with conviction.
BTC open interest on Binance totals $8.0 billion. A sustained move above $80,000 driven by spot demand could trigger cascading liquidations, amplifying any breakout attempt toward the 200-day MA. The contrast with other assets is notable: ETH shows a more balanced 61.6% long / 38.4% short, SOL leans 72.6% long, and XRP sits at 69.7% long. Bitcoin stands alone as the heavily short-biased outlier. For context on derivatives analysis across the market, see our technical coverage.
| Coin | Funding Rate | Open Interest | Long / Short |
|---|---|---|---|
| BTC | -0.0051% | $8.0B | 37.2% / 62.8% |
| ETH | -0.0038% | $4.5B | 61.6% / 38.4% |
| SOL | -0.0036% | $799.2M | 72.6% / 27.4% |
| XRP | -0.0025% | $363.2M | 69.7% / 30.3% |
| DOGE | +0.0019% | $385.1M | 65.0% / 35.0% |
| BNB | 0.0000% | $340.4M | N/A |
| ADA | -0.0069% | $81.8M | N/A |
| AVAX | -0.0081% | $80.2M | N/A |
| DOT | -0.0091% | $43.1M | N/A |
| LINK | +0.0013% | $87.5M | N/A |
Three May 2026 Price Scenarios
Bull Case — Target $82,228 then $88,000: Bitcoin breaks above $80,000 on high spot volume, triggering cascading short liquidations. The 200-day MA at $82,228 is reclaimed and confirmed as support. Prerequisites include Fear & Greed crossing 50, sustained US spot Bitcoin ETF net inflows, and macro conditions remaining risk-on. This scenario ends a seven-month bearish trend structure.
Base Case — Range $78,000–$80,000: Bitcoin consolidates between immediate support and $80K resistance through mid-May. Mixed signals (bullish MACD vs. bearish Supertrend) produce sideways price action while sentiment gradually recovers. No decisive catalyst forces a directional break in either direction.
Bear Case — Target $75,678 then $74,300: The $78,197 support level fails on a daily close. Exchange BTC inflows spike, signaling holder distribution. The next meaningful floor is $75,678; if that gives way, $74,300 becomes the target. This scenario becomes more probable if macro risk-off conditions re-emerge or ETF outflows accelerate. Track scenario updates in our price prediction coverage.
Five Signals to Watch This Week
- Volume at the $80,000 test: Any breakout attempt must carry meaningful spot volume — a low-volume push above $80K is historically a rejection setup, not a confirmation.
- Fear & Greed crossing 50: A move from Fear (39) to Neutral (50+) has preceded sustained rallies in prior cycles. It's the leading sentiment indicator in this setup.
- Exchange inflow spikes: A sudden surge in BTC flowing back onto exchanges signals potential distribution from current holders — treat it as a short-term bearish flag.
- 200-day MA reclaim at $82,228: A confirmed daily close above this level on strong volume would flip the intermediate trend structure bullish for the first time in seven months — the single most important signal available.
- BTC funding rate direction: A move from -0.0051% toward zero or positive territory confirms that spot demand is catching up with the futures-driven short overhang.
FAQ
Is now a good time to buy Bitcoin near $78,000?
The on-chain backdrop shows favorable structural conditions: whale accumulation of 270,000 BTC in April, exchange supply at a 7-year low, and a weekly RSI that has historically marked major cycle bottoms. However, the 200-day MA at $82,228 remains unbroken and the Supertrend is still bearish. A gradual, position-sized approach is commonly used in mixed-signal environments like this. See SpotedCrypto's Bitcoin analysis for ongoing updates. This article is not investment advice.
What does Bitcoin need to break above $80,000 and hold it?
Three conditions consistently appear in analyst frameworks: (1) sustained daily spot volume above $30 billion, (2) Fear & Greed Index recovering above 50, and (3) continued net inflows into US spot Bitcoin ETFs. With sentiment at 39 (Fear) and the Supertrend still bearish, all three need to align for a breakout to hold rather than reverse into another rejection at $80K.
Disclaimer: This article is for informational purposes only and does not constitute financial or investment advice. Cryptocurrency markets are highly volatile and carry significant risk of loss. Always conduct your own research and consult a qualified financial advisor before making any investment decisions.
Related Articles
- 2026 Crypto Mega Narratives: RWA, AI, and Decentralized Derivatives Are All Firing at Once
- Bitcoin News Today: ETF Flows, Derivatives Anomaly & On-Chain Data — May 2026
- Bitcoin News Today: RSI & MACD Signal in Halving Year 2 — The $80,646 Breakout Scenario
- Bitcoin News: Whales Buy 270K BTC, Exchange Reserves Hit 7-Year Low — April 30, 2026
- DeFi Airdrop Strategy in a Bear Market: Planting Seeds When Fear Peaks