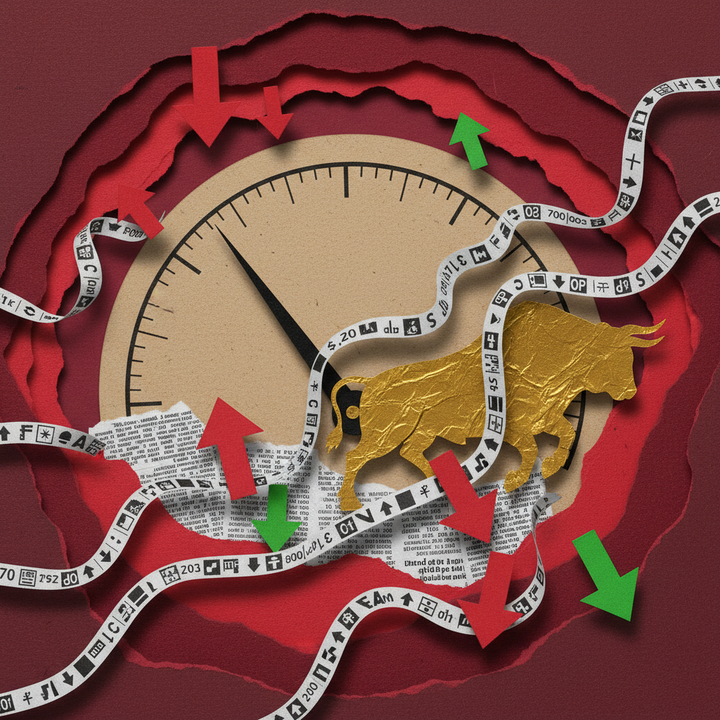
Bitcoin RSI Hits 25.6 — Only the Third Historic Oversold Reading Ever. Is 2018's Bottom Pattern Repeating?
Bitcoin's 14-day RSI has plunged to 25.6 — a level reached only twice before in history. With the Fear & Greed Index at a record low of 5, whales accumulating 230,000 BTC, and $4.5 billion in ETF outflows, we analyze what the data says about a potential bottom.
Bitcoin's 14-day RSI has plunged to 25.6, entering the most extreme oversold territory recorded in only two prior instances across its entire trading history.
As of March 2, 2026 at 11:23 KST, Bitcoin trades at $66,197 on Binance — down 2.27% over 24 hours with a session range of $65,056 to $68,166. The asset has cratered roughly 45% from its October 2025 all-time high of $125,000, posting its worst five-month losing streak since the 2018 bear market (CoinDesk). The only prior instances of an RSI reading below 30 were in 2015 and December 2018 — both of which marked generational bottoms that preceded rallies of 9,900% and 1,700% respectively. Yet the current cycle carries structural variables that didn't exist before: spot Bitcoin ETFs hemorrhaging $4.5 billion in outflows, geopolitical shocks from the Iran-Israel conflict, and a Fear & Greed Index that just printed 5 — the lowest reading across every major crash in Bitcoin's history (ETH News). The question is whether 2018's bottom playbook can survive 2026's radically different market structure.
Key Takeaways
Quick Answer: Bitcoin's 14-day RSI at 25.6 marks only the third time in history this indicator has dropped below 30. Both previous occurrences — 2015 and 2018 — preceded massive rallies after 3–6 months of sideways consolidation. However, $4.5 billion in ETF outflows and heightened geopolitical risk introduce variables absent from prior cycles.
- Historic RSI oversold: Bitcoin's 14-day RSI has fallen to 25.6, the third time ever below 30, following 2015 and December 2018 (CoinDesk).
- Record-low Fear & Greed: The index hit 5 — lower than Mt. Gox (9), COVID crash (8), and FTX collapse (12) — and currently sits at 10 (ETH News).
- -45% from all-time high: BTC has dropped from $125,000 (Oct 2025) to ~$66,197, with a brief bounce to $68,000 after Iran confirmed Khamenei's death on March 1 (CoinDesk).
- Massive ETF outflows: ~$4.5 billion drained from Bitcoin ETFs in the first 8 weeks of 2026, with $3.8 billion over 5 consecutive weeks — the longest streak since February 2025 (CoinDesk).
- Whale accumulation: Addresses holding 1,000–10,000 BTC have added 230,000 BTC since December 10, 2025, pushing total holdings from 2.86M to 3.09M BTC (Cointelegraph).
- Futures OI collapse: Open interest plunged 19.7% in one week — from $61 billion to $49 billion — as leveraged positions were mass liquidated (VanEck).
- Bottom fractal reappears: The same fractal pattern that preceded a 130% rally in 2024 flashed again in late February 2026 (Cointelegraph).
Where Bitcoin Stands Now: Price and Market Snapshot
Quick Answer: Bitcoin trades at $66,197 on Binance as of March 2, down 2.27% in 24 hours. The Fear & Greed Index reads 10 (Extreme Fear), BTC dominance is 56.1%, and total crypto market cap sits at $2.36 trillion.
Bitcoin is trading at $66,197 on Binance as of March 2, 2026 at 11:23 KST, down 2.27% over the past 24 hours with an intraday range of $65,056 to $68,166. On OKX, BTC shows a nearly identical price of $66,205 with $611.8 million in 24-hour volume. The asset briefly touched $68,000 on March 1 after Iran confirmed that Supreme Leader Khamenei had been killed in U.S.-Israeli airstrikes — a roughly 5% bounce from the $63,000 low (CoinDesk). However, the broader trend remains deeply bearish: BTC fell 10% in January, 15% in February, and is down 23% through the first 50 trading days of 2026 — the worst five-month consecutive decline since the 2018 bear market (CoinDesk). Total crypto market capitalization stands at $2.36 trillion, with BTC dominance at 56.1% and ETH dominance at 10.0%. The Fear & Greed Index reads 10 — Extreme Fear — down 4 points from the previous day, having recently printed a record low of 5.
| Metric | Value | Note |
|---|---|---|
| Current Price (Binance) | $66,197 | -2.27% (24h), range $65,056–$68,166 |
| Peak Drawdown | -45.6% | $125,000 (Oct 2025) → ~$66,200 |
| February Decline | -15% | Worst 5-month streak since 2018 |
| 2026 YTD Decline | -23% | First 50 trading days |
| RSI (14-day) | 25.6 | 3rd time ever below 30 |
| Fear & Greed Index | 10/100 | Extreme Fear (record low: 5) |
| BTC Dominance | 56.1% | Total market cap: $2.36T |
| Futures OI (all exchanges) | $49B | Down from $61B (-19.7% in one week) |
| ETF Outflows (2026 YTD) | $4.5B | 8 weeks, 5 consecutive weeks of outflows |
| Whale Accumulation | +230,000 BTC | Since Dec 10, 2025 |
The broader altcoin market is faring even worse. ETH trades at $1,947 on Binance, down 4.25% over 24 hours. SOL has fallen 4.28% to $84, XRP is down 4.46% to $1.36, and DOGE has shed 4.37% to $0.093. The only green among top-10 volume assets is PAXG (tokenized gold), up 0.79% to $5,382 — a clear flight-to-safety signal.
| # | Coin | Price | 24h Change | Volume(24h) | High | Low |
|---|---|---|---|---|---|---|
| 1 | BTC | $66,197 | -2.27% | $1.5B | $68,166.00 | $65,056.00 |
| 2 | ETH | $1,947 | -4.25% | $961.6M | $2,048.26 | $1,907.41 |
| 3 | USDC | $1.00 | +0.01% | $473.8M | $1.00 | $1.00 |
| 4 | SOL | $84 | -4.28% | $345.8M | $88.90 | $81.69 |
| 5 | XRP | $1.36 | -4.46% | $225.3M | $1.43 | $1.34 |
| 6 | PAXG | $5,382 | +0.79% | $133.1M | $5,448.09 | $5,286.25 |
| 7 | USD1 | $1.00 | +0.04% | $107.0M | $1.00 | $1.00 |
| 8 | BNB | $620 | -1.63% | $101.4M | $632.16 | $610.89 |
| 9 | DOGE | $0.09 | -4.37% | $85.5M | $0.10 | $0.09 |
| 10 | SUI | $0.90 | -4.52% | $54.2M | $0.95 | $0.87 |
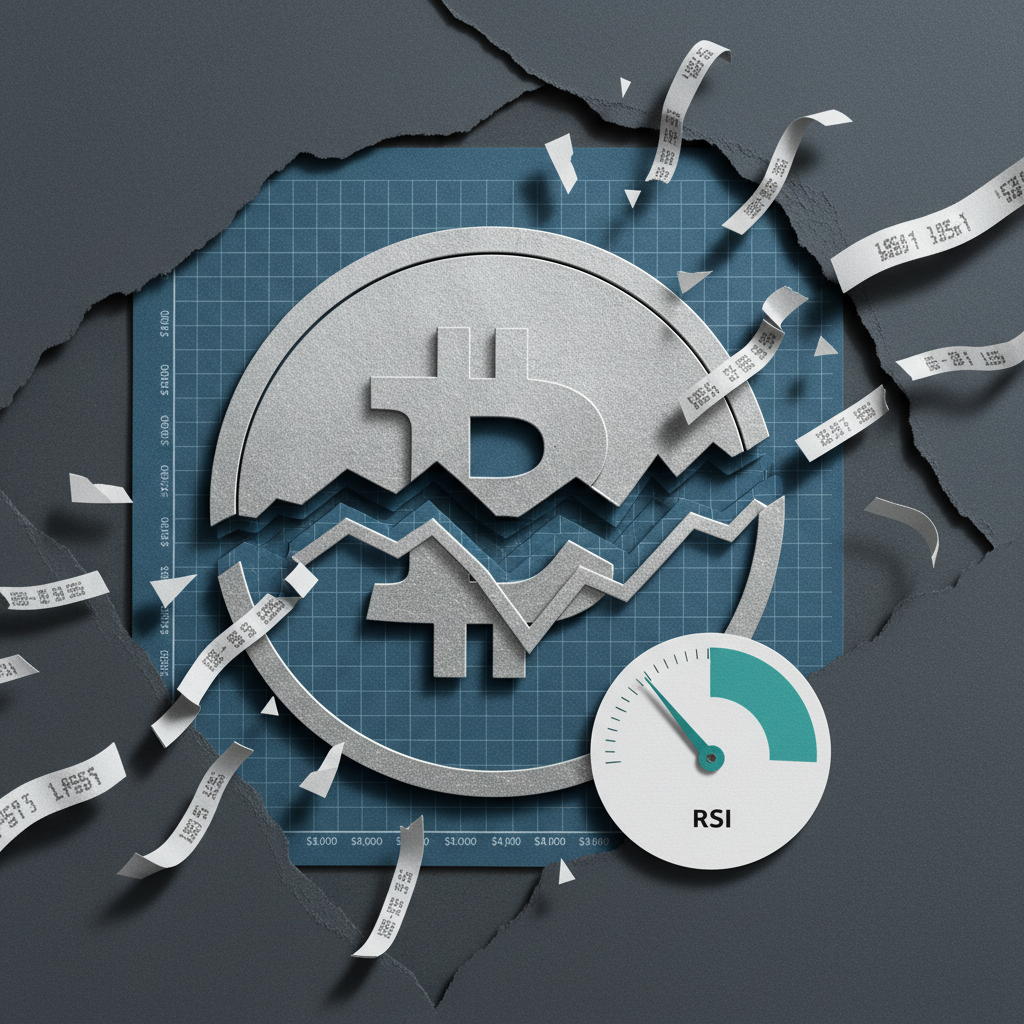
What Bitcoin's RSI of 25.6 Means Historically
Quick Answer: An RSI of 25.6 signals extreme oversold conditions. The only two prior instances — 2015 and December 2018 — both preceded multi-year rallies of 9,900% and 1,700% respectively, though each required 3–6 months of sideways accumulation before the breakout began.
The Relative Strength Index (RSI) is a momentum oscillator that measures the speed and magnitude of price changes on a scale from 0 to 100. Readings below 30 indicate oversold conditions; above 70 signals overbought. Bitcoin's 14-day RSI dropping to 25.6 is a generational rarity — it has happened only twice before in the asset's 17-year history, according to CoinDesk: once in 2015 when BTC traded near $200, and again in December 2018 when it bottomed at $3,500 (CoinDesk). CryptoRank data confirms the current reading of 25.6 is actually lower than the 2018 trough of approximately 24.5, making it the second-lowest RSI reading ever recorded for Bitcoin (CryptoRank). From a technical standpoint, this suggests that the bulk of extreme selling pressure has already been absorbed.
| Period | 14-Day RSI | BTC Price | Consolidation | Subsequent Rally |
|---|---|---|---|---|
| 2015 | <30 | ~$200 | ~6 months | +9,900% (by 2017) |
| Dec 2018 | ~24.5 | $3,500 | ~3 months | +1,700% (by 2021) |
| Mar 2026 | 25.6 | $66,197 | In progress | ? |
Supporting indicators confirm the extreme conditions. The MACD (Moving Average Convergence Divergence) histogram is converging at depressed levels, signaling that bearish momentum is fading. On February 5, BTC registered a -6.05 standard deviation move on the rate-of-change Z-score — one of the fastest single-day crashes in crypto history, according to VanEck's digital asset research team (VanEck). The Bollinger Bands tell a similar story: price has breached the lower band by a historically wide margin, creating strong mean-reversion pressure. When RSI, MACD, and Bollinger Bands all converge on extreme oversold readings simultaneously, the statistical probability favors bottom formation or sideways accumulation rather than further aggressive downside.
On-Chain Data: Capitulation and Accumulation Running in Parallel
Quick Answer: Whales holding 1,000–10,000 BTC have quietly accumulated 230,000 BTC since December 2025, pushing their balance to 3.09 million BTC — even as short-term holders dumped a record $3.2 billion in realized losses on a single day.
On-chain data — the record of all transactions and wallet activity on the Bitcoin blockchain — is currently broadcasting a dual signal: capitulation among short-term holders is nearing completion, while large-scale accumulation by whales is accelerating. Wallets holding between 1,000 and 10,000 BTC have added approximately 230,000 BTC since December 10, 2025, increasing their aggregate balance from 2.86 million to 3.09 million BTC, according to Cointelegraph. This V-shaped accumulation pattern indicates that buy-side demand from the largest market participants is actively absorbing the selling pressure from retail and institutional liquidations (Cointelegraph). Meanwhile, on February 5, entity-adjusted realized losses hit an all-time record of $3.2 billion, confirming that short-term holders capitulated at historic scale (VanEck).
Exchange reserve data adds nuance to the picture. Between February 11 and 17, exchange-held BTC increased from 2,738,959 to 2,751,938 — a net inflow of 12,979 BTC (+0.47%), according to Darkex Academy (Darkex Academy). While this suggests some holders moved coins to exchanges for potential selling, the magnitude is relatively modest. Active addresses during February 11–18 totaled 899,888, with sending addresses peaking at 725,448 on a price spike day — evidence that network activity remains robust despite the bearish price action.
James Check, lead on-chain analyst at Checkonchain, framed the outlook: "Time, not price, is probably going to be more frustrating for bulls from here. Bitcoin has been mostly de-risked at this point. Every mean reversion model, from technical to on-chain, is trading within bottom formation levels, typically seen after the price capitulation event" (CoinDesk). In other words, the worst of the price decline may be over — but a prolonged sideways grind could test investor patience before any sustained recovery materializes.
Futures Leverage Wipeout and ETF Capital Flight
Quick Answer: Futures open interest collapsed 19.7% in one week — from $61 billion to $49 billion — while Bitcoin ETFs bled $4.5 billion in eight weeks. The leverage reset is the most aggressive since the FTX implosion.
The derivatives market tells a story of violent deleveraging. Across all exchanges, Bitcoin futures open interest plummeted from $61 billion to $49 billion in a single week — a 19.7% wipeout that ranks among the sharpest leverage resets since FTX collapsed in November 2022, according to VanEck (VanEck). On the first weekend of February alone, $2.56 billion in leveraged positions were liquidated in a single day. Around the Iran airstrikes on March 1, another $327 million was liquidated within 24 hours, with long positions accounting for 75.6% of the damage (The Market Periodical).
Current Binance futures data reflects the aftermath of this cleansing. BTC open interest on Binance alone sits at $5.1 billion with a funding rate of -0.0003% — slightly negative, indicating short bias but near neutral. The long/short ratio stands at 63.3%/36.7%, showing that remaining participants are cautiously positioned for a bounce. ETH futures paint a more bearish picture with a funding rate of -0.0076% and a long/short split of 68.0%/32.0%.
| Coin | Funding Rate | Open Interest | Long/Short |
|---|---|---|---|
| BTC | -0.0003% | $5.1B | 63.3% / 36.7% |
| ETH | -0.0076% | $3.5B | 68.0% / 32.0% |
| SOL | 0.0024% | $795.1M | 71.7% / 28.3% |
| XRP | -0.0020% | $356.5M | 68.2% / 31.8% |
| DOGE | 0.0005% | $144.6M | 66.2% / 33.8% |
| BNB | 0.0000% | $307.3M | N/A |
| ADA | 0.0078% | $89.1M | N/A |
| LINK | 0.0073% | $73.7M | N/A |
| AVAX | 0.0004% | $72.7M | N/A |
| DOT | -0.0017% | $48.1M | N/A |
On the ETF front, the numbers are stark. Bitcoin spot ETFs have hemorrhaged approximately $4.5 billion in the first eight weeks of 2026, with $3.8 billion in the last five weeks alone — the longest consecutive outflow streak since February 2025 (CoinDesk). Institutional selling has compounded the bearish sentiment. However, Matthew Sigel, Head of Digital Asset Research at VanEck, sees the destruction as constructive: "The depth of the drawdown and the degree of leverage reset have made the current price washout increasingly attractive for building positions on a one- to two-year view. There will be no bailout for Bitcoin" (VanEck). Historically, when ETF outflows peak and reverse, the resulting inflow surge has driven powerful price recoveries — making the timing of that reversal the single most important signal to watch.
2018 vs. 2026: A Side-by-Side Bottom Comparison
Quick Answer: The current drawdown of 45.6% is less severe than 2018's 84% crash, but the Fear & Greed Index at 5 is lower than 2018's trough of 11 — suggesting psychological capitulation may be more extreme this time. The key structural difference: spot Bitcoin ETFs now exist.
Comparing the three instances where Bitcoin's RSI fell below 30 reveals both striking parallels and critical divergences that will shape the recovery trajectory. In December 2018, Bitcoin had fallen 84% from its $20,000 peak to $3,500, with the Fear & Greed Index bottoming at 11. The current drawdown from $125,000 to ~$66,200 represents a 45.6% decline — significantly less severe in percentage terms. Yet the Fear & Greed Index has printed a record low of 5, surpassing every prior crash including Mt. Gox's collapse (9), the COVID black swan in March 2020 (8, when BTC fell 39% in a single day), and the FTX implosion (12) (ETH News). This disparity — less price damage but deeper psychological capitulation — suggests the market may have front-loaded its fear response, potentially shortening the consolidation window before recovery.
| Metric | December 2018 | March 2026 | Comparison |
|---|---|---|---|
| Peak-to-Trough | -84% ($20K → $3.5K) | -45.6% ($125K → $66K) | 2026 drawdown more contained |
| RSI (14-day) | ~24.5 | 25.6 | Comparable levels |
| Fear & Greed | 11 | 10 (low: 5) | 2026 sentiment more extreme |
| Consolidation | ~3 months | In progress | Time still needed |
| Subsequent Rally | +1,700% (by 2021) | ? | — |
| Spot ETFs | Did not exist | Active ($4.5B outflows) | Institutional flow variable |
| Institutional Presence | Low | High | Faster recovery possible |
| Macro Backdrop | Late-stage rate hikes | Geopolitical risk + tariff war | Different external pressures |
The structural game-changer is the existence of spot Bitcoin ETFs. In 2018, the recovery relied entirely on organic crypto-native capital rotation. In 2026, ETFs provide a direct pipeline for institutional capital — currently draining at $4.5 billion, but capable of reversing into a powerful tailwind when sentiment shifts. Every major Fear & Greed extreme in Bitcoin's history — Mt. Gox, COVID, FTX — has been followed by meaningful recoveries within months. Additionally, the same bottom fractal pattern that appeared in 2023 before a 130% rally in 2024 has flashed again in late February 2026 (Cointelegraph).
Rony Szuster, Head of Research at Mercado Bitcoin, has identified a gold-denominated Bitcoin price cycle spanning 12–13 months, which suggests a market bottom could arrive as early as March 2026 (CoinDesk).
March Price Scenarios: Bull Case vs. Bear Case
Quick Answer: The bull case targets $85,000–$100,000 by year-end after 3–6 months of consolidation between $60,000 and $72,000. The bear case warns of a retest at $55,000–$60,000 if ETF outflows accelerate and geopolitical risk escalates.
Bitcoin stands at an inflection point between historic oversold recovery patterns and persistent structural headwinds from ETF outflows and geopolitical uncertainty. Polymarket bettors assign a 71% probability that BTC will drop below $65,000 at some point in 2026, reflecting prevailing bearish sentiment (TradingView). Standard Chartered has slashed its 2026 Bitcoin target from $300,000 to $100,000 (Bloomberg). The range of credible outcomes is wide — and both cases rest on identifiable triggers.
Bull Case: $85,000–$100,000
If the bottom fractal holds and 2018's pattern repeats, expect 3–6 months of sideways accumulation in the $60,000–$72,000 range, followed by a breakout toward $85,000–$100,000 by year-end. Key triggers: (1) ETF outflows halt and reverse to net inflows, (2) whale accumulation continues past 3.09M BTC toward 3.20M+, (3) RSI reclaims 30 and pushes above 50, and (4) the Fed signals a dovish pivot. Carol Alexander, Professor of Finance at the University of Sussex, expects Bitcoin to trade within a "high-volatility range of between $75,000 and $150,000, with the centre of gravity around $110,000" (CNBC). BitMEX co-founder Arthur Hayes has gone further, predicting Bitcoin will reach $200,000 on the back of Fed liquidity injections (CNBC).
Bear Case: $55,000–$60,000
If ETF outflows accelerate beyond $1 billion per week and geopolitical risk escalates — particularly an expansion of the Iran-Israel conflict or new tariff shocks — Bitcoin could retest the $63,000 low and potentially fall to the $55,000–$60,000 zone. A CryptoQuant analysis of geopolitical shock patterns shows that BTC exchange inflows spike sharply during major crises but normalize quickly — wars briefly jolt crypto markets without reversing long-term trends (Coin-Turk). However, the current convergence of ETF outflows, leverage liquidations, and geopolitical instability is a multi-front stress test unlike any single prior episode. Bear triggers: (1) weekly ETF outflows exceeding $1 billion, (2) loss of $63,000 support, (3) escalation in Iran or a new geopolitical shock.
What Investors Should Watch
- $63,000 support: The March 1 bounce originated here. A decisive break below reopens the door to $55,000–$60,000.
- $72,000 resistance: The descending trendline since mid-February converges near this level. A break above confirms trend reversal.
- ETF flow reversal: After five consecutive weeks of outflows, the first week of net inflows would be the strongest sentiment-shift signal available.
- RSI reclaiming 30: A move from 25.6 back above 30 would confirm exit from oversold territory and strengthen the technical case for a bounce.
- Whale wallet tracking: If whale balances continue rising past 3.09M BTC, it validates ongoing accumulation at current prices.
- Geopolitical developments: The Iran-Israel situation, U.S. tariff policy shifts, and potential escalation remain the primary short-term volatility catalysts.
- March FOMC meeting: The Fed's rate guidance will shape macro conditions for crypto and risk assets broadly.
On the risk side, Bitcoin's five-month losing streak remains the longest since 2018, ETF outflows show no sign of abating, and the Iran situation could deteriorate further. While the leverage reset has been severe ($61B → $49B in OI), residual long positions could face cascading liquidations on any further downturn. The BTC funding rate at -0.0003% is near neutral — not yet signaling the kind of extreme short crowding that typically marks definitive bottoms.
Frequently Asked Questions
What does a Bitcoin RSI of 25.6 mean?
The Relative Strength Index (RSI) at 25.6 indicates Bitcoin is in extreme oversold territory. The 14-day RSI has only dropped below 30 twice before — in 2015 and December 2018. Both prior instances marked cycle bottoms followed by massive rallies, though each required 3–6 months of sideways consolidation before the recovery began (CoinDesk).
What is different between the 2018 bottom and today?
The most significant structural difference is the existence of spot Bitcoin ETFs. In 2018, recovery depended entirely on organic crypto capital flows. In 2026, ETFs create a direct channel for institutional money — currently flowing out at $4.5 billion, but capable of reversing into powerful buying pressure. Additionally, the current drawdown (-45.6%) is less severe than 2018's (-84%), yet sentiment as measured by the Fear & Greed Index is more extreme (current low of 5 vs. 2018's 11) (CoinDesk).
Is a Fear & Greed Index of 10 a buy signal?
Historically, Fear & Greed readings between 5 and 15 have shown a strong correlation with medium-to-long-term buying opportunities. The Mt. Gox collapse (9), COVID crash (8), and FTX implosion (12) all saw significant recoveries within months of reaching extreme fear levels. However, short-term downside remains possible — dollar-cost averaging (DCA) is generally the most prudent risk-management strategy when entering at extreme fear readings (ETH News).
How do Bitcoin ETF outflows affect the price?
ETF outflows represent direct selling pressure. When ETF operators redeem shares, they sell the underlying Bitcoin on spot markets, pushing prices lower. The $3.8 billion outflow over five weeks is the longest streak since February 2025. However, the inverse is equally powerful: when outflows peak and reverse, inflows provide a concentrated buying force that has historically driven sharp price recoveries. Whether weekly outflow velocity is decelerating is the critical metric to track (CoinDesk).
Sources
- Bitcoin Tops $68,000 After Iran Confirms Leader Killed, CoinDesk
- Bitcoin's 14-Day RSI Falls Below 30 for Third Time Ever, CoinDesk
- Bitcoin RSI Historic Oversold Signal, CryptoRank
- What Triggered Bitcoin's Major Selloff in February 2026, VanEck
- Bitcoin ETFs Bleed $3.8 Billion in Historic Five-Week Outflow Streak, CoinDesk
- 2026 Fear Index Reading of 5 Is the Lowest Across Every Major Bitcoin Crash, ETH News
- Bitcoin Whales Participate in V-Shaped Accumulation, Cointelegraph
- Bitcoin Bottom Fractal Calls for 130% Rally, Cointelegraph
- Weekly Bitcoin On-Chain Report, Darkex Academy
- Bitcoin Price Pain Largely Over but Time Pain Remains, CoinDesk
- Bitcoin Price Predictions for 2026, CNBC
- Bitcoin Market Bottom May Be Nearing, CoinDesk
- StanChart Cuts Bitcoin 2026 Target to $100,000, Bloomberg
This article is for informational purposes only and does not constitute investment advice. All investment decisions should be made based on your own judgment and research.