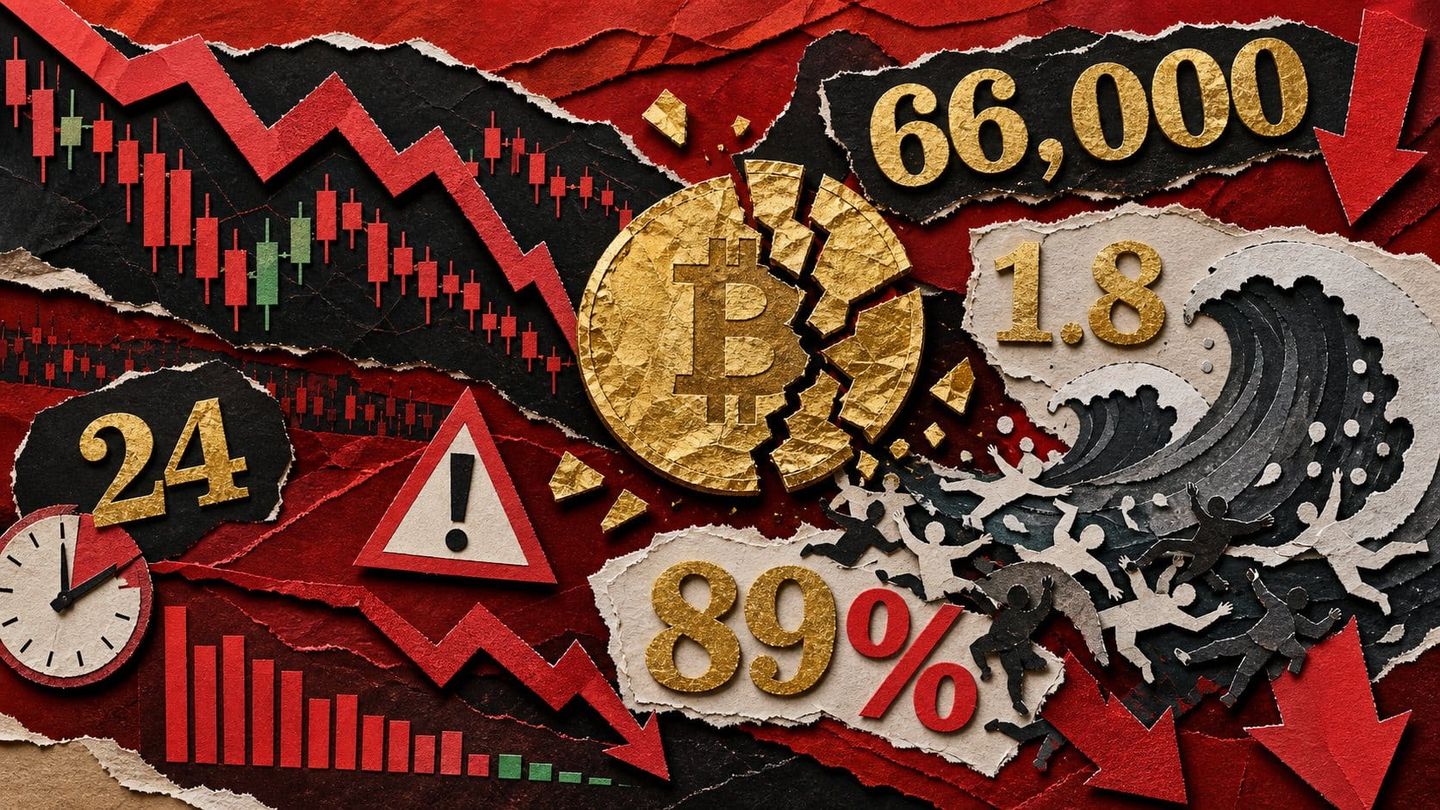
Crypto's leverage stack snapped on Wednesday. A single 24-hour window erased $1.84 billion in bullish bets, and nearly nine in ten of those were longs caught on the wrong side of a fast move.
What Happened: $1.84B Forced Out in 24 Hours
Bitcoin dropped roughly 8% from Tuesday's high near $71,300 to a nine-week low around $65,360 by early Wednesday, June 3, 2026 — its lowest level since March 29 . The break below $66,000 triggered about $1.84 billion in leveraged liquidations in 24 hours, the largest single-day forced-closure event since February 2026, per CoinGlass data cited by CoinDesk .
Quick Answer: On June 3, 2026, Bitcoin fell ~8% to a nine-week low near $65,360, breaking $66,000 and forcing about $1.84 billion in leveraged positions to close in 24 hours. Roughly 88–90% were long bets — a one-sided deleveraging flush, not a balanced sell-off.
This was overwhelmingly a long-side washout. Between 88% and 90%-plus of the liquidations came from bullish positions, meaning traders had crowded into leveraged upside and got flushed as support failed . Ethereum slid under $1,900, and total crypto market capitalization was pushed back toward $2.3 trillion after rejecting near $2.7 trillion .
| Long liquidations by asset (24h) | Amount |
|---|---|
| BTC longs | ~$884M |
| ETH longs | ~$476M |
| SOL longs | ~$91M |
| Largest single unwind (BTC-USDT long, HTX) | $59.67M |
The figures above come from CoinDesk's CoinGlass snapshot . Venue concentration tells the rest of the story: Binance alone handled about $748 million — roughly 41% of the entire cascade . Note that totals drift by source and rolling window; other dashboards logged $1.83B to $1.86B, so treat every number here as approximate .
Three Converging Causes — Not One Headline
The $1.8 billion flush had three drivers stacked on top of each other, not a single war headline. Geopolitics lit the fuse, but crowded long leverage and a 12-session run of ETF redemptions had already built the powder keg. Treat the U.S.-Iran escalation as the amplifier — not the sole cause.
The military backdrop was real and documented. U.S. Central Command said it defended against Iranian ballistic missiles and drones and struck a ground-control station on Qeshm Island on June 2, 2026 . Missiles fired toward Kuwait fell short and three aimed at Bahrain were intercepted . With the Strait of Hormuz in play, Brent crude rose 1.9% to $97.81 . Bitcoin traded as a high-beta risk asset, not a safe haven.
The second pressure point was institutional selling. U.S. spot Bitcoin ETFs posted $519.19 million in net outflows on June 2 — a 12-session streak, the longest since the funds launched in January 2024 . BlackRock's IBIT alone shed $308.64 million, and two-day damage reached roughly $1 billion . The regulated buyer of the last cycle had turned seller.
The third cause was positioning that was lopsided before any headline hit. Long-short ratios going into the flush:
- Binance: 2.22 long-short ratio
- OKX: 2.01
- Bybit: 1.58
The crowd was overwhelmingly long, so a downside move forced cascading liquidations rather than a balanced two-way shakeout. That mechanic explains why 88%–90%+ of the wipeout hit bullish bets.
Not every analyst blames the strikes. "The drop looks more about leverage, ETF outflows and technical breakdowns than pure Iran news," Bitrue Research told Cointelegraph . In other words: geopolitics pulled the trigger, but the market loaded the gun.
What to Watch: $60K or a Bounce?
The immediate question is whether the $64,000–$65,000 zone holds. That band marks Bitcoin's nine-week low near $65,360 set early on June 3, and traders are watching it as the first floor before deeper support at $60,000–$61,000. A clean break below would put the round-number $60,000 level in play as the next major test.
Analysts are split on which way it resolves. Trader Michael van de Poppe flagged the $60K–$66K band as a crucial accumulation zone where spot demand would likely step in.
"$65,000–$66,000 is reasonable support for a short-term bounce, but a $60K retest is possible," — analyst Colin Talks Crypto (source: Cryptonews).
Positioning data sends a mixed signal. This was a deleveraging flush, not a full capitulation:
- OKX whale long-short ratio collapsed to 0.54, an extremely bearish reading from large accounts.
- BTC open interest actually rose from about 759,000 to 788,600 contracts — fresh positioning entering the volatility rather than wholesale exit.
- Retail stayed net-long, with Binance's long-short ratio at 2.22 even after the wipeout.
The cleanest signal to track is institutional flow. U.S. spot Bitcoin ETFs have now logged 12 straight sessions of net outflows — the longest streak since the funds launched in January 2024 — with $519.19 million leaving on June 2 alone. The regulated marginal buyer of this cycle has temporarily turned seller.
The takeaway: watch for the first day daily ETF flows flip net positive. Until they do, $60,000–$61,000 stays the line that decides whether this was a leverage reset or the start of a deeper trend break.
Frequently asked questions
Why did Bitcoin crash below $66,000 on June 3, 2026?
Bitcoin fell below $66,000 because three pressures converged, not because of one headline. A renewed U.S.-Iran military flare-up near the Strait of Hormuz triggered a broad risk-off move, while U.S. spot Bitcoin ETFs extended a 12-session outflow streak with about $519 million leaving on June 2 alone. Crowded long leverage then cascaded into roughly $1.84 billion in forced liquidations. The geopolitical shock amplified an already fragile, over-leveraged setup rather than acting as the sole cause.
How big were the crypto liquidations and which assets were hit hardest?
About $1.84 billion in leveraged positions were forcibly closed within 24 hours — the largest single-day liquidation event since February 2026. The damage was overwhelmingly long-side, with 88%–90% of liquidations from bullish bets. By asset, CoinDesk reported BTC longs near $883.66 million, ETH longs $475.73 million and SOL longs $91.18 million. DOGE, SUI, HYPE, BNB, NEAR, AAVE and LINK were also caught in the cascade.
Is Bitcoin's $65,000 level strong support or will it fall to $60,000?
Analysts are split, and the level is contested rather than confirmed. Several traders cite the $64,000–$66,000 band as a reasonable near-term bounce zone, while flagging $60,000–$61,000 as the next significant support if selling pressure from ETF redemptions and fresh shorts persists. Open-interest contract counts actually rose from about 759,000 to 788,600, suggesting fresh positioning into the volatility rather than full capitulation.
Were Bitcoin ETF outflows a major factor in the crash?
Yes — institutional selling was a clear pressure point. U.S. spot Bitcoin ETFs posted $519.19 million in net outflows on June 2, extending the redemption run to 12 trading sessions, the longest since the funds launched in January 2024. BlackRock's IBIT alone redeemed $308.64 million, and combined with Monday's outflows the two-day total reached roughly $1 billion. The marginal regulated buyer of this cycle had temporarily turned net seller.
How did U.S.-Iran military strikes affect crypto markets?
The strikes pushed Bitcoin to trade as a high-beta risk asset, not a safe haven. U.S. Central Command confirmed self-defense strikes on a ground-control station on Qeshm Island on June 2, with Iranian missiles intercepted over Kuwait and Bahrain and no U.S. personnel harmed [strike report]. With the Strait of Hormuz being the world's largest oil-transit chokepoint, Brent crude rose 1.9% to $97.81, and Bitcoin sold off alongside global equities.