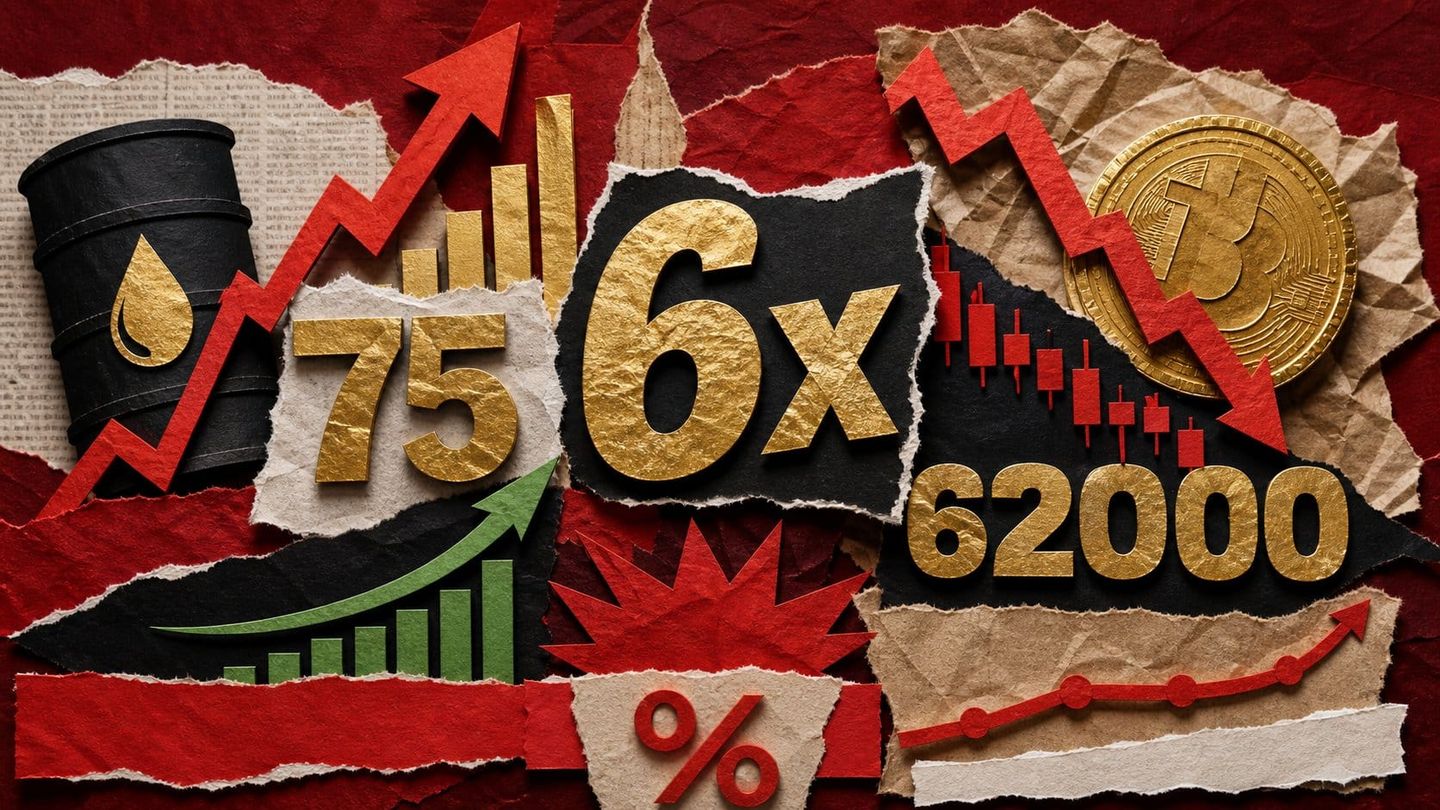
When President Donald Trump declared the U.S.–Iran ceasefire "over" from the NATO summit stage, the reaction split cleanly by asset: oil surged, Bitcoin barely flinched. On a single identical headline, crude moved roughly six times more than BTC.
What changed on July 8: ceasefire gone, oil above $75, Bitcoin at $62K
On 8 July 2026, the fragile U.S.–Iran ceasefire collapsed after Trump declared it "over, as far as I'm concerned," speaking alongside NATO Secretary General Mark Rutte and accusing Iran of violating the agreement "every day" — he added the U.S. would "probably hit Iran again tonight" . The statement reignited geopolitical risk across global markets within hours.
Oil absorbed the shock. WTI crude jumped roughly 5–7% to above $74–$75 per barrel, its highest level since 22 June 2026, as both sides renewed threats to close the Strait of Hormuz . Brent, which had eased to about $73 after the June truce, reversed higher toward the $80–$95 analyst consensus band under a partial-reopening scenario .
Bitcoin, by contrast, fell only about 2.5% to $62,000, briefly touching $61,500 intraday before recovering toward $63,200 the following session . Crude moved roughly six times more than BTC on the identical headline, concentrating the war premium in the asset the Strait physically transports.
This was the fourth disruption-and-partial-recovery cycle since fighting began in early March 2026. The ceasefire had held since 17 June, tied to Iran reopening the Strait, and was extended twice before breaking down .
Why oil absorbed the shock and Bitcoin didn't
The 6× gap comes down to what the Strait of Hormuz physically carries. The chokepoint moves roughly 20% of global oil supply plus large volumes of LNG . It was the exact asset the ceasefire was protecting, so a closure threat concentrates the entire war premium in crude — not in a digital asset that no tanker transports.
The disruption signal was immediate and countable. On 8 July only one tanker was spotted transiting the Strait, versus a daily average of 34 crossings during the ceasefire period . That is a supply shock you can quantify within hours, which is why WTI, not Bitcoin, priced the headline first.
Bitcoin's relative calm was partly structural. Spot BTC held better than crypto-adjacent equities on the same session:
| Asset | Move on 8 July 2026 | Primary risk channel |
|---|---|---|
| WTI crude | +5% to +7% | Energy supply shock |
| Bitcoin (spot) | ≈ −2.5% | Broad risk-off |
| MicroStrategy (MSTR) | −3.6% | Equity risk-off + BTC beta |
| Coinbase (COIN) | ≈ −2.5% | Equity risk-off |
Those equity declines are sourced from Cointelegraph, with ETH and XRP falling in line with Bitcoin . Analysts framed the drop as contained rather than a breakdown.
"As long as price holds above $60,000, the correction stays relatively shallow" — Michaël Van de Poppe, analyst, who flagged the $61,000 area as the crucial support/retest level (source: CoinDesk) .
The takeaway: two distinct channels only partially overlapped. Oil absorbed a direct energy-supply shock tied to the Strait, while crypto took a lighter, sentiment-driven risk-off hit. That separation — not any special immunity — is why crude moved roughly six times more than Bitcoin on the identical headline.
The macro chain that actually threatens Bitcoin: oil → inflation → Fed
The real risk to Bitcoin is not the headline — it is the transmission chain that runs oil → inflation → Fed. Sustained crude above $75 feeds directly into inflation expectations, and U.S. consumer inflation expectations already reached 3.7%, the highest since September 2023 . That is the number that ultimately shapes policy, and policy is what prices risk assets.
The pressure is already visible in official signals. FOMC minutes flagged rising core goods inflation on tariff and AI-cost pressures, with "a few" participants favoring immediate rate hikes . Bond yields tell the same story: the 10-year Treasury yield reached 4.46% in late March, its highest since July 2025 .
"The combination of higher oil and higher yields raises the odds of a more hawkish Fed," argued Andrew Jackson, strategist at Ortus Advisors, noting the effect is amplified by November U.S. midterm election dynamics (source: CoinDesk).
Prediction markets are repricing accordingly:
- Kalshi places the probability of a 2026 rate hike at 55% .
- The CME FedWatch Tool shows rising odds of a September move .
- Goldman Sachs raised its U.S. recession probability to 30% under an oil-above-$100 escalation scenario, projecting unemployment near 4.6% and inflation closer to 3% than 2% by end-2026 .
The logic for traders is straightforward. A genuine tightening cycle — not a single geopolitical headline — is the primary second-half obstacle for Bitcoin. If crude stays elevated and feeds the next inflation prints, the hawkish Fed trade tightens financial conditions and caps risk appetite. That macro chain, not the ceasefire itself, is what would keep a lid on price.
Three signals that will decide Bitcoin's next move
With the macro chain in focus, three concrete signals will tell traders which way Bitcoin resolves in the second half of 2026. None require guessing about diplomacy — each is a measurable data point you can track weekly.
- Strait of Hormuz tanker traffic. Only one tanker was spotted transiting the Strait by Thursday, versus a post-ceasefire daily average of 34 crossings . Crossings recovering toward 30-plus would signal crude retreating from the $80 area and the inflation narrative losing momentum. Weekly shipping data is the earliest leading indicator — it moves ahead of any price print.
- Bitcoin's $60,000 floor. BTC held this level through the prior month's selloff and recovered toward $63,000 the following day . A weekly close below $60,000 shifts the technical picture materially and opens the $55K zone; above it, Van de Poppe's "shallow correction" thesis stays intact.
- The next U.S. CPI print. If the July 8 energy spike shows up in headline inflation, September Fed hike probability surges — the CME FedWatch Tool already showed rising odds . That release, not the Strait itself, is likely the real catalyst.
The takeaway: watch tankers first, defend $60K second, and treat the next CPI as the decision point. The ceasefire made the headline; inflation data will make the trend.
Frequently asked questions
Why did Bitcoin only fall 2.5% when oil surged over 6% on the same news?
The two assets sit on different risk channels. Oil bears the physical Hormuz supply disruption, so the war premium concentrates in the commodity the Strait actually transports; crude moved roughly six times more than Bitcoin on the identical headline . Bitcoin faced only sentiment-driven risk-off selling — a daily decline near 2.5% with a brief dip toward $61,500 — and its $60,000 support absorbed the pressure .
What is the Strait of Hormuz and why does it move crypto markets?
The Strait of Hormuz is the world's most critical energy chokepoint, carrying about 20% of global oil supply plus large volumes of LNG . When closure threats spike crude — WTI jumped above $74–$75 per barrel on July 8 — inflation expectations rise, pressuring the Fed toward tightening . That chain reaches crypto indirectly, through rate-hike risk and reduced risk appetite rather than any direct energy link.
What Bitcoin price levels should traders watch right now?
Two levels matter. Analyst Michaël Van de Poppe flagged the $61,000 area as the crucial support and retest zone, arguing that holding above $60,000 keeps the correction "relatively shallow" . The $60,000 line is the macro floor traders have defended since the prior month's selloff; Bitcoin recovered near $63,000–$63,200 the following day . A weekly close below $60,000 would shift the outlook bearish.
Could a Fed rate hike in 2026 push Bitcoin significantly lower?
It is a genuine risk. Prediction market Kalshi placed 2026 rate-hike odds at 55%, and the CME FedWatch Tool showed rising odds of a September move . Bitcoin has historically underperformed in genuine tightening cycles. The deciding variable is whether crude stays above $75 into the next CPI print — FOMC minutes already showed most participants voicing inflation concerns, with consumer inflation expectations at 3.7% .
Is the Iran ceasefire collapse a one-off event or a recurring pattern?
It is a recurring pattern, not an isolated shock. The July 8 breakdown marks the fourth major disruption-and-partial-recovery cycle since fighting began in early March 2026 . Each cycle follows the same sequence: attack, oil spike, diplomatic signal, partial reversal, then a new incident. That rhythm points to elevated baseline oil volatility for the second half of 2026, regardless of any single ceasefire announcement.
Enjoyed this article? Subscribe to get new stories by email whenever they're published.