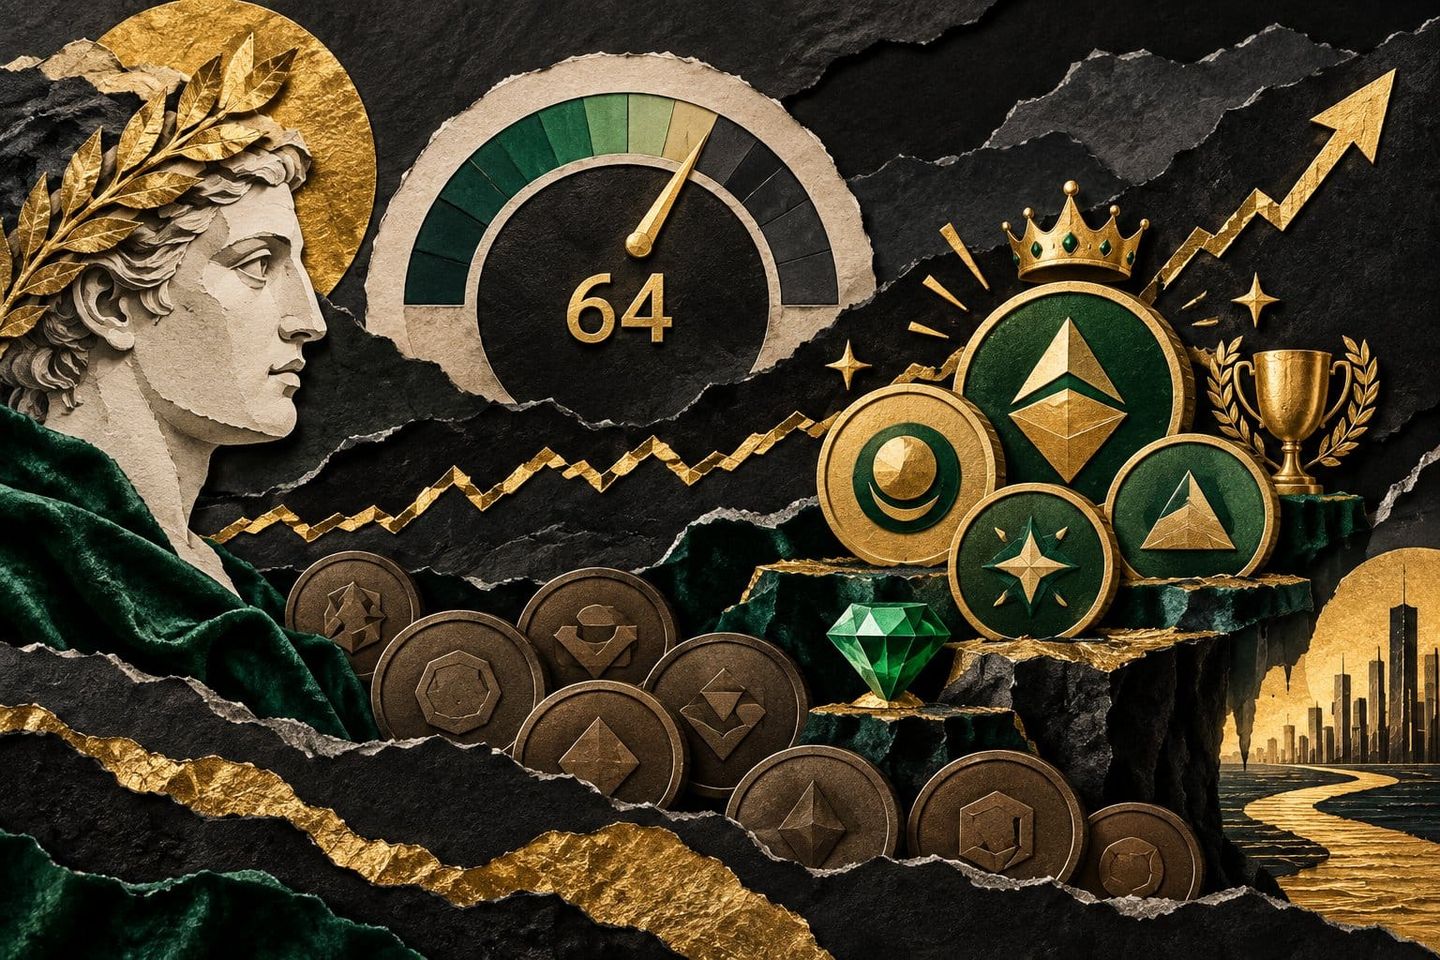
The Altcoin Season Index just posted its strongest reading of 2026 — and it still isn't enough. At 64, the gauge sits in the same ambiguous zone that has trapped traders twice this cycle: rotation is real, but confirmation is not.
Is It Altseason Yet? What an Index Reading of 64 Actually Means
No — not by the index's own definition. CoinMarketCap's Altcoin Season Index printed 64 in late September 2026, up from 48 the prior week, but the official altseason threshold is 75 . The index measures how many of the top 100 non-stablecoin tokens outperformed Bitcoin over a rolling 90-day window; 75 or more of them beating BTC is what flips the reading to confirmed altseason . A 64 means the majority of large-cap alts are outrunning Bitcoin, but not the supermajority that historically marks a broad rotation.
Quick Answer: The Altcoin Season Index reached 64 in late September 2026, its highest level of the year, but altseason is only confirmed at 75. With Bitcoin dominance still near 58.6% — above the sub-55% level most desks require — capital is rotating selectively into large caps, not broadly into the long tail.
The second condition is the one most readers skip. Most trading desks treat altseason as a two-part signal: a 75+ index reading and Bitcoin dominance below 55%. Dominance sat near 58.6% in the latest snapshot, with Ethereum at 11.5% . That is progress from May 2026, when the index read 35 and dominance closed at 60.88% after breaking out of an eight-month 58–60% range toward 66.06% resistance . Progress, not confirmation.
The verdict for Q4 2026: capital is rotating, but narrowly. Flows are concentrating in revenue-generating protocols, privacy names, and assets with a regulated ETF wrapper — not the indiscriminate melt-up that defined 2021 . The sections below trace how the index got here, what the flows actually bought, and how to screen for it.
Altcoin Season Index Timeline 2026: From 35 to 64
The Altcoin Season Index moved from 35 in May 2026 to 64 in late September 2026, a 29-point climb that tracks Bitcoin dominance falling from 60.88% to roughly 58.6% over the same stretch . The index counts how many of the top 100 non-stablecoin tokens outperformed Bitcoin over a rolling 90 days, and 75 is the published threshold for altseason. At 64, roughly two-thirds of the top 100 are beating BTC — the strongest reading of 2026, and still 11 points short of the line.
The May snapshot is the useful reference point because it captured the opposite condition. With the index at 35, Bitcoin dominance closed at 60.88% after breaking out of an eight-month accumulation range between 58% and 60%, aiming at the 66.06% cycle-high resistance . That is textbook capital consolidation into Bitcoin, not distribution out of it. Four months later, dominance had eased back inside the old range at roughly 58.6%, with Ethereum holding 11.5% of total market cap . The single sharpest leg came in the final week: the index jumped from 48 to 64, a 16-point move in seven days .
| Snapshot | Altcoin Season Index | BTC dominance | Market interpretation |
|---|---|---|---|
| May 2026 | 35 / 100 | 60.88% (breakout above 58–60% range, targeting 66.06%) | Bitcoin-led consolidation; alts losing ground on a 90-day basis |
| Week of ~19 Sep 2026 | 48 / 100 | ~59% | Early rotation; fewer than half the top 100 beating BTC |
| Late Sep 2026 | 64 / 100 | ~58.6% (ETH 11.5%) | Strongest reading of 2026, below the 75 threshold — rotation underway but unconfirmed |
| Desk confirmation bar | 75+ / 100 | Sub-55% | The paired condition most desks require to call a broad rotation |
Two details keep the timeline honest. First, the 90-day lookback means a reading of 64 partly reflects Bitcoin's own corrective stretch earlier in the period — Bitcoin traded roughly $90,000–$95,000 in early 2026 with dominance above 59% . Relative outperformance can rise because BTC stalls, not because alts find new buyers. Second, dominance at 58.6% is a return to the middle of a range the market has respected since 2025, not a structural break below it.
Analyst Ben Cowen's framing is the main counterweight to reading the climb as confirmation: he argues 2026 structurally rhymes with late-cycle 2019, when alts bled quietly against Bitcoin even as headlines called for altseason . Under that read, a 64 print is a mid-cycle relief rotation inside a Bitcoin-dominant regime rather than the opening of a new one — and a 16-point weekly spike is exactly the kind of move that mean-reverts if dominance turns back toward 60%. The distinction matters for position sizing: a rotation that needs sub-55% dominance to confirm has not yet given the signal (video: CRYPTO - BUSINESS).
What Traders Are Actually Buying: Revenue Over Hype
The assets leading this rotation share one measurable trait: they collect fees. Cointelegraph Magazine's trader survey published 28 September 2026 found 30-day leadership concentrated in protocols with live revenue rather than the speculative long tail, with PONS up roughly 350%, NEAR near 180%, ARB 150% and UNI 110% over the period, while Zcash (ZEC) traded briefly above $1,600 for a record high . That composition is the signal — not the size of the moves.
The clearest break from prior cycles is what is missing. Only two memecoins appeared among the top 20 weekly gainers, an inversion of the 2021 and 2024 patterns in which low-float, narrative-only tokens dominated the leaderboard during comparable index readings . Lookonchain's read of the same tape describes capital as "mainly concentrated in yield-generating protocols, on-chain perpetual contracts, and DeFi projects" — a flow map, not a sentiment call.
"They make money, they all print revenue," — David Hoffman, co-host of Bankless, on the common thread linking ARB, UNI, JUP and ONDO (source: Cointelegraph Magazine, 2026-09).
Grouping the flow makes the screen easier to apply. In rough order of capital absorbed, six buckets are active :
- Revenue-generating DeFi — UNI, MORPHO, LIT and JUP. Fee capture is observable on-chain, which is why this bucket sits first.
- Privacy — ZEC and XMR. ZEC's move above $1,600 is the single largest repricing in the group .
- AI-adjacent — TAO, VVV, and NEAR's repositioning toward AI infrastructure, which underwrites its ~180% 30-day move.
- Tokenized real-world assets — ONDO alongside tokenized gold and equities, where the bid is tied to distribution rather than trading volume.
- On-chain perpetuals venues — trading fees scale directly with volatility, making these a levered play on the rotation itself.
- Memecoin launchpad infrastructure — PUMP and PONS. Speculative in nature, but they collect fees from the activity they host rather than depending on their own token narrative.
Note what that last bucket implies. PONS led the 30-day table at roughly 350% , yet it qualifies under the same test as UNI — it is the toll booth, not the traffic. Traders are not avoiding speculation; they are positioning one layer upstream of it, where the cash flow is.
Sergej Kunz of 1inch characterises the behaviour as "breadth before depth" — smaller allocations spread across many names rather than conviction size in any single one . Curve founder Michael Egorov points to the same shift in criteria: "there's now more interest in protocols that actually do something useful, can connect crypto with real financial activity" . Binance's own 2026 research arrives at a compatible conclusion from the data side, framing the cycle as one where surviving altcoins are fewer and better capitalised rather than more numerous (video: Binance).
For a trader building a shortlist, the practical translation is that a position's thesis should name the fee stream. If the answer to "where does the revenue come from" is a narrative rather than a number, the asset is in the bucket this rotation has so far skipped.
Why This Rotation Stays Narrow, Not Broad
This rotation stays narrow because altcoin market cap has consolidated into a much smaller set of assets than in previous cycles. The top ten altcoins now command roughly 80% of total altcoin market capitalisation, up from about 70% at the end of 2024 . Concentration, not index level, is the structural reason a 64 reading has not translated into broad-based gains: there is simply less long tail left to bid.
Binance's own research puts the figure slightly higher and gives the historical contrast that matters. Its 2025 measurement of top-ten share was approximately 82%, against roughly 64% at the 2021 peak, while the count of altcoins with a market cap above $1 billion fell from about 105 at the 2021 peak to closer to 50 — even as total altcoin market cap held above $1 trillion . The capital did not leave the asset class; the number of destinations shrank by half (video: Binance). A trader who mechanically screens for "small cap altcoins with room to run" is screening a population that has been systematically defunded since 2021.
The second constraint is market-making depth. Dealer participation fell from 65% at the end of 2024 to 32% in September 2026 . Dealer participation here refers to the share of market-making activity supplied by professional liquidity providers who quote two-sided books. When that share halves, the mechanical consequence is thinner order books on mid- and small-cap pairs: the same inflow that produced a coordinated long-tail melt-up in 2021 now produces violent, isolated moves in whichever names still have quoted depth, and nothing at all in the names that do not.
That shows up in how allocations are actually sized. Sergej Kunz of 1inch describes the pattern as "breadth before depth" — smaller allocations spread across many names rather than conviction size in any single one . Talos's Samar Sen reads the same tape the same way, noting that capital is "clustering around a smaller number of assets rather than rotating broadly into the long tail."
"There's now more interest in protocols that actually do something useful, can connect crypto with real financial activity," — Michael Egorov, founder of Curve Finance (source: Cointelegraph Magazine, 2026-09).
Three structural facts, taken together, explain the ceiling on breadth:
- Fewer viable assets. Roughly 50 altcoins above $1 billion, versus about 105 at the 2021 peak .
- Thinner liquidity provision. Dealer participation at 32%, half its end-2024 level .
- Diluted position sizing. Breadth-before-depth allocation spreads capital too thin to lift any individual small cap decisively .
Lookonchain's on-chain read is consistent with all three, describing flows as "mainly concentrated in yield-generating protocols, on-chain perpetual contracts, and DeFi projects" rather than dispersed across the market . The practical implication for position sizing is that a diversified basket of twenty low-cap names is not diversification in this structure — it is twenty exposures to the same missing bid. Concentration in the assets that retain dealer depth is the lower-variance expression of the same rotation thesis.
The ETF Pipeline: Which Altcoins Have an Institutional Bid
The regulated fund wrapper is now the single clearest divider between altcoins that receive institutional capital and those that do not. In 2025, Ethereum investment products drew nearly $13 billion, Solana products roughly $3.6 billion — about 10 times the prior year — and XRP products about $3.7 billion, roughly 5 times the prior year, while all other altcoin products combined drew just $318 million, down 30% year over year . That is not a small gap in degree; it is a structural split in who can buy what.
The 2026 tape confirms the pattern rather than closing it. U.S. spot Solana ETFs took in $188.22 million in the week to 26 September 2026, a 2026 record and the second-best week on record behind the $199.21 million launch week, lifting cumulative net inflows to $1.61 billion . The distribution inside that total matters for anyone reading flow as a demand signal: Bitwise accounts for $1.22 billion, Fidelity's FSOL for $231.35 million, and Grayscale's GSOL for $164.15 million . One issuer is carrying roughly three-quarters of the Solana wrapper bid.
Spot XRP ETFs added $75.89 million over the same week — an eleventh consecutive weekly inflow — taking cumulative net inflows to approximately $1.79 billion, with Bitwise at $677 million, Franklin's XRPZ at $501 million, and Canary's XRPC at $489.37 million . Eleven straight weeks is the more informative number than the dollar figure: it describes a persistent allocation program, not an event-driven spike. For context on the top of the stack, CoinShares' weekly tape recorded roughly $1.03 billion in total digital-asset fund flows with $790 million going to Bitcoin, following $2 billion and $2.9 billion weeks — the strongest of the year .
| Asset / bucket | 2025 product inflows | 2026 latest weekly flow (to 26 Sep) | Cumulative U.S. spot ETF net inflows | Institutional access path |
|---|---|---|---|---|
| Ethereum (ETH) | ~$13B | Not separately disclosed in the weekly SOL/XRP tape | Established since 2024 launch cohort | Multiple U.S. spot ETFs |
| Solana (SOL) | ~$3.6B, ~10x prior year | $188.22M — 2026 record | $1.61B | Bitwise $1.22B, Fidelity FSOL $231.35M, Grayscale GSOL $164.15M |
| XRP | ~$3.7B, ~5x prior year | $75.89M — 11th straight inflow week | ~$1.79B | Bitwise $677M, Franklin XRPZ $501M, Canary XRPC $489.37M |
| All other altcoins (long tail) | $318M combined, −30% YoY | No dedicated weekly flow reporting | No U.S. spot ETF | Spot venues and self-custody only |
Read as a screen rather than a scoreboard, the table produces one rule: an altcoin without a regulated wrapper has no institutional bid, only a retail one. The long tail's $318 million for an entire year is smaller than Solana ETFs collected in nine trading days of late September 2026 . Binance's research frames this as the mechanism behind fewer, larger survivors — the count of $1B+ altcoins fell from roughly 105 at the 2021 peak to closer to 50, even with total altcoin market capitalisation above $1 trillion (video: Binance) .
Two qualifiers belong on this screen. First, wrapper existence is not a valuation argument: SOL and XRP flows tell you a bid exists, not that current prices are attractive. Second, a filing is not a listing — the practical checkpoints are a live, trading U.S. spot product and multiple issuers competing, because single-issuer concentration makes flow data fragile. For traders positioning into Q4 2026, the usable test is whether an asset sits on one of three access tiers: a live multi-issuer spot ETF, a credible pending wrapper with institutional sponsorship, or nothing at all — with the third tier priced entirely off retail and protocol fundamentals .
Bull Case vs. Bear Case for Q4 2026 Altseason
The bull and bear cases for Q4 2026 altseason rest on the same data set and disagree only about breadth. The bull case points to an Altcoin Season Index that moved from 35 in May 2026 to 64 in late September , roughly $1.03 billion of weekly digital-asset fund inflows on CoinShares' tape , and stablecoin supply near $307 billion. The bear case points to structure: Bitcoin dominance above 59% and an OTHERS index tracing a double top.
The bull case, in numbers. Index momentum is the cleanest input — a 29-point move in roughly four months is the fastest rotation signal of the cycle, and it happened while Bitcoin dominance eased from 60.88% toward 58.6% . Fund flows corroborate it: the ~$1.03 billion week followed $2 billion and $2.9 billion weeks, the strongest of 2026 . Even with $790 million of that going to Bitcoin, the residual is the largest altcoin allocation the regulated channel has produced this year. Behind it sits the dry-powder argument: stablecoin supply reached roughly $307 billion by February 2026, up about $23 billion in five months (video: Binance). That capital is on-chain, denominated in dollars, and one transaction away from a bid.
The bear case, in structure. The counter-read is that liquidity existing is not liquidity deployed. Bitcoin traded roughly $90,000–$95,000 in early 2026 after a corrective stretch, with dominance at 59%-plus and ETF inflows absorbing marginal demand; ETH, XRP and SOL held up selectively while the broader alt complex bled (video: CRYPTO - BUSINESS). The technical objection is sharper. The OTHERS index — altcoins outside the top ten, the truest proxy for long-tail breadth — printed a double top in 2021 that capped that cycle, and chartists argue the current structure echoes both 2021 and 2017 (video: Decentralizer). Ben Cowen's framing is that 2026 rhymes with late-cycle 2019, when alts quietly bled against Bitcoin rather than crashing outright . A slow bleed is harder to trade than a drawdown because it never produces a clear exit signal.
The reconciliation is that both sides may be right about different assets. Curve founder Michael Egorov reads the rotation as qualitative rather than cyclical:
"There's now more interest in protocols that actually do something useful, can connect crypto with real financial activity," — Michael Egorov, founder of Curve Finance (source: Cointelegraph Magazine, 2026-09).
Talos's Samar Sen supplies the net read: capital is "clustering around a smaller number of assets rather than rotating broadly into the long tail" . Held together, that means a bull case for perhaps 30 to 50 names with revenue or a wrapper, and a bear case for everything else — not one verdict on "alts."
Decision Framework: How to Screen Altcoins in a Selective Rotation
The screen that desks are using in this rotation has three factors: fee or revenue generation, a regulated institutional access path, and a defensible current narrative. A token that satisfies all three is a rotation target; a token that satisfies none is long-tail beta, priced off Bitcoin's direction rather than its own fundamentals. Bankless co-host David Hoffman condensed the first factor to a single line about ARB, UNI, JUP and ONDO — "They make money, they all print revenue" . The other two factors explain why revenue alone has not been enough.
Applied in order, the screen works as a ranking exercise rather than a pass/fail gate. Score each name on a watchlist before sizing anything:
- Factor 1 — Fee revenue. Does the protocol collect measurable fees from real usage? Lookonchain reads the current tape as capital concentrating in "yield-generating protocols, on-chain perpetual contracts, and DeFi projects" . Even speculative launchpad infrastructure such as PUMP and PONS passes this test, because it collects fees.
- Factor 2 — Institutional access path. Is there a spot ETF, a filed product, or another regulated wrapper? In 2025, ETH products drew close to $13 billion, SOL roughly $3.6 billion and XRP about $3.7 billion, while every other altcoin product combined drew $318 million — down 30% year over year . An altcoin without a wrapper has no institutional bid to rotate into it.
- Factor 3 — Live narrative. Is there a current reason the asset is being discussed this quarter — privacy, AI, tokenized real-world assets, on-chain perpetuals? Narrative is what converts a revenue line into flow.
The contrast with the 2021 playbook is the practical point. Buying a low market cap and waiting for beta worked when breadth was wide; it does not work when the top ten altcoins hold roughly 80% of total altcoin market capitalization, up from about 70% at the end of 2024 , and when the count of $1 billion-plus altcoins has fallen from roughly 105 at the 2021 peak to closer to 50 . Thinner dealer participation compounds it — down from 65% at the end of 2024 to 32% in September 2026 , which means less market-making depth beneath the long tail when it moves.
For confirmation that the screen can be loosened, two conditions need to print together: Bitcoin dominance below 55% and the Altcoin Season Index sustaining above 75. Dominance sits near 58.6% today , so neither is met. Until both are, treat the three-factor screen as the position-sizing rule rather than a starting filter to be relaxed on a strong week.
What to Watch Next
The next four weeks will resolve the question this reading leaves open, and four specific data series will do the resolving. The Altcoin Season Index needs to hold above its current 64 rather than retrace toward the 48 it printed the week before ; Bitcoin dominance needs to keep drifting from 58.6% toward 55% rather than turning back up toward the 66.06% cycle-high resistance ; ETF flow tapes need to keep widening past SOL and XRP; and dealer participation needs to recover from 32% . Each is published weekly, so this is a checklist a trader can actually run.
- Index level, weekly. A move from 64 into the high 60s sustained for two or three consecutive weeks is meaningful; a snap back under 50 says the September move was a rally in a handful of names, not a rotation (source: CoinMarketCap, 2026-09).
- Dominance path. The eight-month 58–60% accumulation range is the pivot. Losing it decisively opens the path to 55%; reclaiming 60% puts the 66.06% target back in play .
- ETF flows as the leading tell. Spot SOL products took $188.22 million in the week to 26 September and spot XRP products $75.89 million, an eleventh straight weekly inflow . Watch whether a third or fourth asset joins that tape — that filing and launch sequence, not price, is where the next institutional bid announces itself.
- Dealer participation. At 32%, down from 65% at end-2024, there is not enough market-making depth for a long-tail move . A recovery toward 50% would be the first real structural argument for broadening exposure.
One more series sits underneath all four: roughly $307 billion of stablecoin supply as of February 2026, up about $23 billion in five months . That is dry powder, and it explains why the index can jump 16 points in a week without breadth following (video: Binance).
The concrete takeaway: 64 is a signal to review position sizing in names that already pass the revenue-plus-access screen, not a signal to buy beta. Log the four numbers every Monday. Loosen the screen only when dominance is under 55% and the index holds above 75 — and until then, treat any week where memecoins reclaim the top-20 gainers list as evidence the rotation is weakening, not broadening.
Frequently asked questions
What is the Altcoin Season Index and how is it calculated?
The Altcoin Season Index is a CoinMarketCap metric that measures what share of the top 100 non-stablecoin cryptocurrencies has outperformed Bitcoin over a rolling 90-day window. A reading of 75 or above is the published altseason threshold, meaning at least 75 of those 100 tokens beat Bitcoin over the trailing quarter; a reading below 25 is labelled Bitcoin season . Because the window is 90 days and rebalances daily, the index is a lagging breadth gauge, not a forward signal — it confirms that a rotation has already happened rather than predicting one. It also says nothing about the size of those gains, only the count of tokens participating.
Why isn't a reading of 64 considered altseason?
A reading of 64 falls 11 points short of the official 75 threshold, so by CoinMarketCap's own definition the market is still in a neutral zone rather than altseason . Most trading desks add a second condition: Bitcoin dominance below 55%. Dominance stood at roughly 58.6% in late September 2026, with Ethereum at 11.5% — easing from the 60.88% May 2026 close but well above the trigger level . The jump from 48 the prior week to 64 is the strongest print of the year and worth tracking, but a single unconfirmed week of breadth is not the same as a regime change .
Which altcoins are leading the 2026 rotation?
Two distinct groups lead: price performers and ETF-wrapped assets. On 30-day performance, PONS gained roughly 350%, NEAR about 180%, ARB 150% and UNI 110%, while Zcash briefly traded above $1,600 for a record high . On institutional flow, U.S. spot Solana ETFs took in $188.22 million in the week to 26 September 2026 — a 2026 record, lifting cumulative net inflows to $1.61 billion — while spot XRP ETFs added $75.89 million for an eleventh consecutive weekly inflow and about $1.79 billion cumulative . The shared trait among the performers is fee revenue. Bankless co-host David Hoffman put it plainly on ARB, UNI, JUP and ONDO: "They make money, they all print revenue" .
Why is this altcoin rotation different from 2021?
Concentration is the difference. The top ten altcoins now hold roughly 80% of total altcoin market capitalisation, up from about 70% at the end of 2024 , and Binance's research puts the 2025 figure near 82% against roughly 64% at the 2021 peak, with the number of $1 billion-plus altcoins falling from about 105 to closer to 50 even as total altcoin market cap held above $1 trillion (video: Binance) . Dealer participation dropped from 65% at end-2024 to 32% in September 2026, leaving less market-making depth for the long tail . The clearest behavioural marker: only two memecoins appeared among the top 20 weekly gainers, inverting the 2021 and 2024 pattern . Talos's Samar Sen describes capital as "clustering around a smaller number of assets rather than rotating broadly into the long tail" .
What would confirm a full altseason in 2026?
Confirmation requires three things together: the Altcoin Season Index sustained above 75 rather than a single weekly spike, Bitcoin dominance falling below 55% from its current ~58.6% , and broader participation that pulls names outside the top-ten concentration bucket into the gainers list. The liquidity for that exists — stablecoin supply reached roughly $307 billion by February 2026, up about $23 billion in five months (video: Binance) — but it is parked, not deployed. The counterweight is the ETF channel: in 2025, Ethereum products drew nearly $13 billion, Solana about $3.6 billion and XRP about $3.7 billion, while all other altcoin products combined took just $318 million, down 30% year over year (video: Binance) . Until regulated wrappers exist beyond a handful of large caps, breadth stays capped structurally, not just cyclically.
What is the main risk to the altseason thesis right now?
The main risk is that 2026 resolves as a late-cycle bleed rather than a rotation. Bitcoin traded roughly $90,000–$95,000 in early 2026 after a corrective stretch with dominance above 59%, and ETF inflows continued absorbing marginal demand while the broader alt complex weakened (video: CRYPTO - BUSINESS) . Chartists point to the OTHERS index — altcoins outside the top ten — which printed a double top in 2021 that capped that cycle, with an analogous structure traceable to 2017 (video: Decentralizer) . Analyst Ben Cowen's framing is that 2026 rhymes with late-cycle 2019, when alts quietly bled against Bitcoin . CoinShares' weekly tape showed roughly $1.03 billion of total digital-asset fund flows with $790 million going to Bitcoin — the allocation split that keeps dominance elevated .
Watch / Sources
- Binance — Altcoin Season Isn't Dead... It Evolved: What Data Shows in 2026, So Far
- Decentralizer — Altcoin Season 2026 Is Coming — The OTHERS/BTC Chart Just Repeated the 2017 and 2021 Pattern
- CRYPTO - BUSINESS — ALTSEASON 2026: The Truth Nobody Tells You (Bitcoin Controls Everything)
Primary written sources: Cointelegraph Magazine, CoinMarketCap Altcoin Season Index, CryptoPotato, Lookonchain, CoinShares Research, and Yahoo Finance.
Last updated: 2026-09-29. Index level, Bitcoin dominance, and ETF flow figures reflect data published in the week to 28 September 2026 and will move; re-check the primary sources before acting.
Enjoyed this article? Subscribe to get new stories by email whenever they're published.