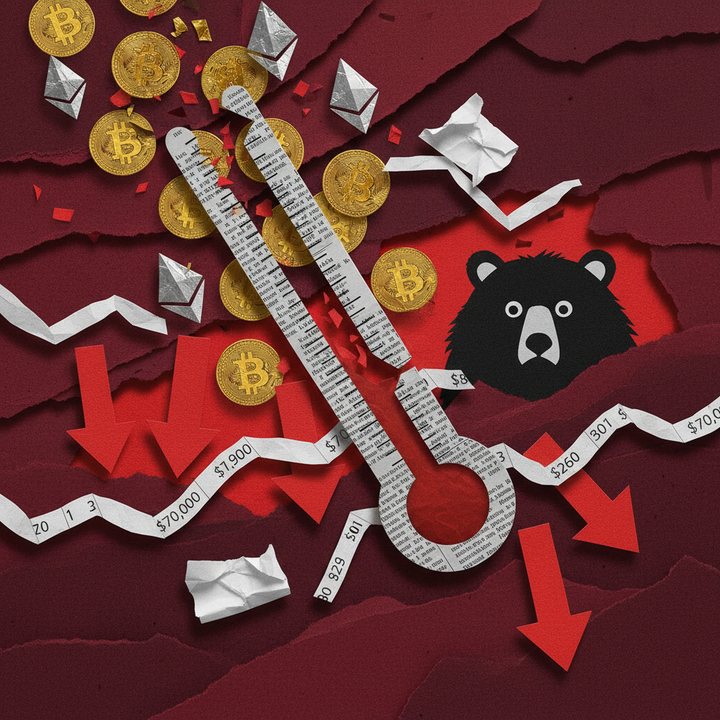
PEPE Coin Deep Dive — Whales Accumulate 23 Trillion Tokens During 42% Crash. Contrarian Signal or Value Trap?
PEPE crashed 42% in 30 days to $0.0000036, yet top 100 whale wallets scooped 23T tokens. RSI near oversold at 34, OI up 10% — data-driven analysis inside.

PEPE has plunged 42% over the past 30 days to $0.0000036 — yet the top 100 whale wallets quietly accumulated 23.02 trillion tokens over four months. With RSI teetering at 34, open interest jumping 10%, and the Fear and Greed Index pinned at 11, we break down whether this divergence between smart money and retail panic is a genuine bottom signal or a classic value trap.
As of February 28, 2026 at 20:42 KST, the total meme coin sector market capitalization has contracted to $31.02 billion — a 75% collapse from its 2024 peak of roughly $120 billion (Source: CoinMarketCap/Santiment). The Crypto Fear and Greed Index reads 11, deep in "Extreme Fear" territory and close to the historic lows seen during the Terra/Luna collapse (6) and the FTX implosion (12). On Binance, DOGE trades at $0.089 with a 24-hour loss of 6.46%, while BTC sits at $64,000 (-3.00%) and ETH at $1,867 (-4.59%).
On-chain data, however, tells a very different story. PEPE's open interest has climbed to $221 million — up 10% — and large wallets have been aggressively accumulating, creating a stark disconnect between so-called smart money and retail sentiment. This analysis synthesizes technical indicators, futures positioning, and whale activity to map out the scenarios ahead. For broader market coverage and technical insights, SpotedCrypto's daily analysis tracks these developments in real time.
Key Takeaways
Quick Answer: PEPE is down 42% over 30 days to $0.0000036, yet the top 100 whale wallets accumulated 23.02 trillion tokens (5.5% of total supply) over four months. RSI at 34 signals near-oversold conditions, while open interest rising 10% to $221 million hints at a crowded short trade that could unwind violently. The meme coin sector market cap has shrunk 75% from its 2024 peak to $31 billion.
- PEPE at $0.0000036 — down 4.54% (24h), 11.43% (7d), 42% (30d), and roughly 80% from its ATH of ~$0.000018 (Source: crypto.news, 2026-02-28)
- 23.02 trillion tokens accumulated by whales — top 100 wallets absorbed approximately 5.5% of total supply over four months while retail investors panic-sold
- RSI at 34–35 — approaching the traditional oversold threshold of 30, raising the probability of a technical bounce
- Open interest at $221M (+10%) — OI rising during a price decline suggests aggressive short positioning, creating potential fuel for a short squeeze
- Meme coin sector at $31.02B — down 75% from the 2024 peak of $120B, with trading volume off 72% from highs (Source: OpenPR)
- Fear and Greed Index at 11 — recovering slightly from an all-time low of 5 on February 6, but still at historically extreme levels (Source: 247WallSt)
- Santiment's analysis — "When the crowd completely writes off a sector, it is often the contrarian time to start paying attention again" (Source: CoinMarketCap)
The 42% Crash — What's Behind the Meme Coin Meltdown?
Pepe coin (PEPE) is a meme cryptocurrency launched in April 2023 on the Ethereum blockchain, inspired by the internet meme character "Pepe the Frog." As of February 28, 2026, PEPE trades at $0.0000036, having shed 4.54% over 24 hours, 11.43% over seven days, and a brutal 42% over the past month (Source: crypto.news, 2026-02-28). The token sits roughly 80% below its all-time high of approximately $0.000018. This is not a PEPE-specific problem. The entire meme coin sector market cap has cratered to $31.02 billion — down 34.04% over 30 days — from a 2024 peak of approximately $120 billion. Trading volume has fallen 72% from peak levels, signaling accelerating participant exodus (Source: CoinMarketCap/Santiment).
Comparing PEPE to other flagship meme coins reveals the sector-wide carnage. Dogecoin (DOGE) is down 89% from its ATH, Shiba Inu (SHIB) has plunged 92%, and PEPE is off 80% (Source: OpenPR, 2026-02-28). To underscore how dire the landscape has become: 11.6 million crypto tokens had their trading halted in 2025 alone — representing 86% of all token failures over the past five years (Source: CryptoNewsNavigator). The structural vulnerability of the meme coin market has never been more apparent.
| Coin | Price | 24h Change | 30d Change | From ATH | RSI |
|---|---|---|---|---|---|
| PEPE | $0.0000036 | -4.54% | -42% | -80% | 34–35 |
| DOGE | $0.089 | -6.46% | ~-30% | -89% | 38.53 |
| SHIB | ~$0.0000050 | ~-5% | ~-25% | -92% | N/A |
Meme coin comparison table (February 28, 2026. Sources: crypto.news, blockchain.news, OpenPR. DOGE price from Binance spot data.)
The broader crypto market paints an equally bleak picture. As of 20:42 KST on February 28, Bitcoin trades at $64,000 on Binance with a 24-hour decline of 3.00%, Ethereum at $1,867 (-4.59%), and Solana at $79 (-5.45%). Stablecoins USDC and USD1 rank among the top volume leaders on Binance — a clear sign that capital is rotating into safe havens. BTC dominance stands at 56.0%, suggesting altcoins, and meme coins in particular, continue to bleed market share. For a deeper look at this flight to safety across global exchanges, check SpotedCrypto's market coverage.
Whale Accumulation — Why Smart Money Is Betting Against the Crowd
Whale accumulation refers to the sustained buying behavior of the largest wallet addresses — analogous to institutional accumulation in traditional finance. In PEPE's case, the top 100 whale wallets have absorbed 23.02 trillion PEPE tokens over the past four months (Source: crypto.news, 2026-02-28). That figure represents approximately 5.5% of PEPE's total supply of 420.69 trillion tokens. While retail investors dumped their holdings in a wave of fear-driven selling, large holders moved in the opposite direction — aggressively accumulating at depressed prices. This divergence between smart money and retail sentiment is a pattern that has recurred at historical market bottoms across crypto.
The implications of this accumulation unfold along several axes. First, these wallets appear to view the current $0.0000036 range as a medium-to-long-term accumulation zone. Distributing purchases of 5.5% of total supply over four months signals strategic positioning rather than speculative flipping. Second, whale accumulation mechanically reduces circulating supply (free float), meaning that any future inflow of buying pressure could amplify price moves to the upside disproportionately.
On-chain analytics platform Santiment offered a pointed assessment of the current environment: "When the crowd completely writes off a sector, it is often the contrarian time to start paying attention again. Watch sectors that the crowd has left for dead — max pain often marks the bottom" (Source: CoinMarketCap). Community-driven sentiment data on platforms like Vote.Token can help traders gauge real-time crowd positioning against on-chain signals.
The counterargument is equally important. Contributing analyst Dominic Basulto at The Motley Fool warns: "These meme coins are fundamentally worthless, and their massive market caps are really just a result of their very high circulating coin supplies" (Source: The Motley Fool, 2026-01-20). Whale accumulation does not guarantee a price recovery — large wallets may be building OTC (over-the-counter) inventory or pursuing strategies entirely disconnected from directional bets on price.
Technical Analysis — RSI at 34, Bollinger Band Support Test
Technical analysis uses historical price patterns and volume data to project future price movements. As of February 28, 2026, PEPE's 14-day Relative Strength Index (RSI) sits at 34–35, just a few points above the traditional oversold threshold of 30 (Source: crypto.news, 2026-02-28). The Moving Average Convergence Divergence (MACD) indicator remains in bearish territory with a sell signal intact, while price is pressing against the lower Bollinger Band. Having all three core indicators simultaneously signal extreme weakness is a relatively rare configuration — one that has historically preceded technical bounces, though not always immediately.
| Indicator | Value | Signal | Interpretation |
|---|---|---|---|
| RSI (14-day) | 34–35 | Near Oversold | Bounce probability rises on a sub-30 dip and reversal |
| MACD | Negative | Sell | Bearish momentum persists; watch for signal line crossover |
| Bollinger Bands | Lower band | Near Oversold | Band squeeze followed by expansion will determine direction |
| Support Zone | $0.0000032–36 | Being Tested | Breakdown targets $0.0000030 psychological support |
| 50-day SMA Resistance | $0.0000043 | Overhead Resistance | Key level for confirming a trend reversal |
PEPE technical indicator summary (February 28, 2026. Source: crypto.news)
One detail worth noting: PEPE's RSI is lower than DOGE's 38.53 reading — meaning PEPE is closer to the traditional oversold threshold within the meme coin cohort. RSI readings below 30 are conventionally considered oversold, and buying pressure tends to materialize around these levels. However, in strong downtrends, RSI can plunge into the 20s and stay there — a phenomenon known as "oversold persistence" — so a sub-30 reading alone does not guarantee an immediate reversal.
From a Bollinger Band perspective, PEPE is currently pressing against the lower band. A touch of the lower band followed by a rebound is a standard mean-reversion pattern, but a decisive break below it often accelerates the sell-off. The key confirmation signals for a short-term trend reversal are: (1) a MACD bullish crossover (signal line crossing above the MACD line), and (2) RSI bouncing off the 30 level. For regular chart updates and technical breakdowns, SpotedCrypto's technical analysis series covers meme coins alongside large-caps.
Futures Market Data — Can Rising Open Interest Trigger a Short Squeeze?
Open interest (OI) measures the total value of outstanding, unsettled futures contracts for a given asset — a critical gauge of trader positioning and leverage in the market. PEPE's open interest stands at $221 million, up 10% from the previous day (Source: crypto.news, 2026-02-28). Meanwhile, spot volume declined to $274 million (-13%) and futures volume fell to $430 million (-12%). The fact that OI is rising while both spot and futures volume are contracting is a notable divergence. Traditionally, the combination of falling prices + rising OI suggests aggressive new short positioning — which, paradoxically, can become the fuel for a short squeeze if a catalyst triggers forced liquidations.
| Futures Metric | Value | 24h Change | Signal |
|---|---|---|---|
| Spot Volume | $274M | -13% | Selling pressure fading |
| Futures Volume | $430M | -12% | Derivatives activity declining |
| Open Interest | $221M | +10% | New positions being opened aggressively |
| Futures/Spot Ratio | 1.57x | — | Futures-dominated market |
PEPE futures market data (February 28, 2026. Source: crypto.news)
A short squeeze occurs when a reversal forces over-extended short positions into cascading liquidations, creating a feedback loop of forced buying that can spike prices sharply higher. PEPE's futures-to-spot volume ratio of 1.57x confirms that derivatives are dominating price discovery — a market structure where leverage unwinds tend to produce outsized moves. If an unexpected positive catalyst were to appear (meme coin regulatory clarity, a major exchange listing, a viral community event), the concentrated short positioning could unwind explosively.
That said, rising OI does not exclusively mean short positioning. Bargain-hunting long positions also increase OI. In the current extreme-fear environment, the probability skews toward shorts being the dominant new entrants, but exact long/short ratios vary by exchange. For reference, DOGE — the largest meme coin by market cap — shows a Binance long/short ratio of 66.6%/33.4% (ratio: 1.99) with a funding rate of -0.0105%, confirming that even on DOGE, shorts are paying to maintain positions. Cross-chain portfolio tracking through tools like Nestree Bridge can help traders monitor multi-exchange exposure efficiently.
Broader Market Snapshot — Binance and OKX Data
The PEPE sell-off is unfolding against a backdrop of broad crypto market weakness. As of 20:42 KST on February 28, 2026, the total cryptocurrency market cap stands at $2.29 trillion, with BTC dominance at 56.0% and ETH dominance at 9.9%. The Fear and Greed Index reads 11 — down 2 points from the prior day — firmly in "Extreme Fear" territory. Negative funding rates across every major asset on Binance confirm that the derivatives market is leaning heavily bearish: BTC at -0.0037%, ETH at -0.0095%, SOL at -0.0201%, XRP at -0.0204%, and DOGE at -0.0105%. This uniform negativity in funding signals that short sellers are paying premiums to maintain their positions — an environment ripe for a broad-based squeeze if sentiment shifts.
| # | Coin | Price | 24h Change | Volume(24h) | High | Low |
|---|---|---|---|---|---|---|
| 1 | BTC | $64,000 | -3.00% | $1.5B | $66,344.90 | $63,030.00 |
| 2 | USDC | $1.00 | +0.00% | $1.0B | $1.00 | $1.00 |
| 3 | ETH | $1,867 | -4.59% | $850.5M | $1,969.00 | $1,835.36 |
| 4 | SOL | $79 | -5.45% | $361.8M | $83.80 | $77.12 |
| 5 | XRP | $1.30 | -6.15% | $307.0M | $1.39 | $1.27 |
| 6 | PAXG | $5,467 | +5.24% | $244.1M | $5,600.00 | $5,194.21 |
| 7 | USD1 | $1.00 | -0.06% | $156.5M | $1.00 | $1.00 |
| 8 | BNB | $596 | -2.88% | $97.2M | $616.85 | $588.64 |
| 9 | DOGE | $0.089 | -6.46% | $95.8M | $0.096 | $0.088 |
| 10 | SUI | $0.84 | -8.49% | $58.9M | $0.92 | $0.83 |
Binance volume top 10 (February 28, 2026 20:42 KST)
Two data points stand out. First, PAXG (Paxos Gold) surged 5.24% to $5,467 — the only Binance top-10 asset in the green — underscoring the flight to hard assets. Second, stablecoins USDC and USD1 both rank in the top seven by volume, confirming a broad risk-off posture. On OKX, the same pattern holds: BTC at $63,994 (-2.85%), ETH at $1,867 (-3.25%), and DOGE at $0.089 (-4.93%). XAUT (Tether Gold) on OKX also climbed 2.22%, mirroring the gold bid on Binance.
| Coin | Funding Rate | Open Interest | Long/Short |
|---|---|---|---|
| BTC | -0.0037% | $5.2B | 68.7% / 31.3% |
| ETH | -0.0095% | $3.4B | 71.3% / 28.7% |
| SOL | -0.0201% | $816.6M | 74.6% / 25.4% |
| XRP | -0.0204% | $366.5M | 68.4% / 31.6% |
| DOGE | -0.0105% | $152.6M | 66.6% / 33.4% |
| BNB | 0.0000% | $290.9M | N/A |
| LINK | -0.0017% | $72.4M | N/A |
| ADA | +0.0006% | $83.8M | N/A |
Binance futures data — funding rates, open interest, long/short ratios (February 28, 2026 20:42 KST)
Notably, SOL (-0.0201%) and XRP (-0.0204%) carry the most negative funding rates among the majors, suggesting these altcoins face the steepest bearish positioning. DOGE at -0.0105% falls in the middle, while BNB is perfectly neutral at 0.0000%. The long/short ratio data shows that despite the bearish funding, account-level data leans long — BTC longs at 68.7%, ETH at 71.3%, SOL at 74.6%. This apparent contradiction between negative funding (shorts dominating dollar value) and majority-long account counts typically indicates that larger, more leveraged accounts are positioned short while smaller retail accounts hold longs — a setup that often resolves with retail liquidations driving further downside before a reversal. For daily derivatives analysis and cross-exchange comparisons, explore the Nestree ecosystem tools.
Historical Parallels — What Happened After Previous Extreme Fear Events?
The current Fear and Greed reading of 11 places the market among the most fearful episodes in crypto history. On February 6, 2026, the index hit an all-time low of 5 — below the Terra/Luna collapse reading of 6, and well under the FTX implosion's 12 (Source: 247WallSt, 2026-02-12). Studying how markets behaved after comparable fear extremes provides crucial context for evaluating PEPE and the meme coin sector today. Historically, extreme fear has been a reliable medium-to-long-term buy signal — but the short-term path often involves additional pain before a bottom is confirmed.
March 2020 — COVID-19 crash: The Fear and Greed Index plunged to 10 as BTC cratered from $9,000 to $3,800. Within 13 months, Bitcoin rallied to $64,000 — a 1,584% gain from the lows. The meme coin sector at the time was essentially just DOGE, which subsequently surged to $0.73 in May 2021, delivering five-figure percentage returns for bottom buyers.
November 2022 — FTX collapse: The index hit 12 as BTC slumped to $15,500, which proved to be the cycle bottom. Over the subsequent 12–18 months, BTC gained 150% to 1,400% depending on timeframe. PEPE did not exist during this crash (it launched in April 2023) and thus has no direct comparable, but the broader meme coin sector exploded during the 2023–2024 bull run that followed.
The critical difference this time: According to 247WallSt's analysis, "unlike past crashes with clear triggers, this decline has no single catalyst, and institutions are net sellers rather than buyers" (Source: 247WallSt). The 2018 ICO bubble collapse saw a similar ~75% sector-wide drawdown, and recovery eventually came during the 2020–2021 cycle — but the wait lasted years. The historical pattern suggests that extreme fear is eventually rewarded, but the path from peak fear to sustainable recovery can be long and volatile.
PEPE Price Scenarios — Bull Case vs. Bear Case
Constructing forward-looking price scenarios for PEPE requires integrating the technical indicators, on-chain data, and macro environment outlined above. The token is currently testing support at $0.0000032–$0.0000036, with RSI at 34, persistent whale accumulation, and a 10% OI increase creating a complex mix of signals. The ultimate direction will hinge on whether meme coin sector sentiment recovers, macro conditions stabilize, and PEPE's community remains active enough to drive demand. Both scenarios below are data-driven frameworks — actual outcomes will depend on variables that cannot be fully predicted.
Bull scenario: 50-day SMA reclaim opens path to $0.0000050–$0.0000060
The bull case rests on three conditions. First, RSI bounces off the 30 level, triggering an oversold relief rally. Second, four months of whale accumulation (23 trillion tokens, 5.5% of supply) has reduced free float sufficiently that moderate buying pressure generates outsized price impact. Third, the crowded short trade (OI +10%) unwinds via a short squeeze. Under this scenario, the near-term (1-month) target is the 50-day simple moving average at $0.0000043. A sustained breakout above that level on strong volume opens a medium-term (3–6 month) path toward $0.0000050–$0.0000060. Santiment analyst Brian Quinlivan cautions that "sustained upside depends on retail investors staying cautious rather than FOMOing into positions" (Source: CoinMarketCap/X).
Bear scenario: Support breakdown targets $0.0000025–$0.0000020
The bear case activates if the current $0.0000032 support floor gives way. A break of the psychological $0.0000030 level would open a technical vacuum toward $0.0000025, with an extreme downside scenario targeting $0.0000020 — an 89% decline from ATH, matching where DOGE currently sits in its own drawdown. Dominic Basulto of The Motley Fool has described recent meme coin bounces as a "dead-dog bounce" and warned of further downside (Source: The Motley Fool, 2026-01-20). Trigger factors for this scenario include continued institutional net selling, accelerating meme coin sector outflows, and deteriorating macro conditions.
Key Levels Traders Should Watch
- RSI sub-30 bounce: Watch for PEPE's RSI to dip below 30 and then reverse. A confirmed bounce off the 30 level is a classic short-term buy signal in technical analysis.
- $0.0000032 support hold: If this level breaks, the next stops are the $0.0000030 psychological floor and $0.0000025 technical target.
- 50-day SMA at $0.0000043: A volume-backed breakout above this moving average would be the first credible sign of a trend reversal for PEPE.
- Open interest direction: If OI declines as price bounces, it confirms short covering (bullish). If OI continues rising during a price decline, further downside is likely.
- Whale wallet behavior: Continue tracking the top 100 wallets. A shift from accumulation to distribution would negate the contrarian bull thesis.
- Fear and Greed recovery above 20: A move above 20 would signal the market is emerging from the extreme fear phase, historically a precursor to more sustained recoveries.
- Meme coin sector market cap reclaiming $40B: Sector-wide recovery is necessary for any individual meme coin rally to sustain itself beyond a dead-cat bounce.
Risk factors include the inherent volatility of meme coins, the absence of fundamental value or revenue-generating utility, regulatory uncertainty, and the structural fragility of a market where 11.6 million tokens ceased trading in 2025 alone. Meme coin exposure should be sized as a small, speculative allocation within a diversified portfolio — never more than an investor can afford to lose entirely.
For deeper chart analysis, real-time whale tracking, and daily derivatives breakdowns, explore SpotedCrypto's premium analysis for professional-grade crypto market intelligence.
Frequently Asked Questions
What is the current PEPE price and market status?
As of February 28, 2026, PEPE trades at $0.0000036, down 4.54% in 24 hours, 11.43% over 7 days, and 42% over 30 days. It sits roughly 80% below its all-time high of approximately $0.000018. The broader meme coin sector market cap has contracted to $31.02 billion — a 75% decline from its 2024 peak of $120 billion (Sources: crypto.news, CoinMarketCap).
What does the PEPE whale accumulation mean for price?
The top 100 whale wallets accumulated 23.02 trillion PEPE tokens over four months — approximately 5.5% of total supply. This pattern, where large holders buy while retail panic-sells, has historically appeared near market bottoms. However, whale accumulation does not guarantee a short-term rebound. Large wallets may be building OTC inventory or pursuing non-directional strategies. Tracking these wallets through on-chain analytics tools and SpotedCrypto's market updates is essential for monitoring changes in this thesis.
What are PEPE's technical indicators signaling right now?
PEPE's 14-day RSI sits at 34–35, just above the traditional oversold threshold of 30. MACD remains in bearish territory, and price is pressing against the lower Bollinger Band. The 50-day SMA at $0.0000043 is the key resistance level for confirming a trend reversal. Open interest has risen 10% to $221 million, which could fuel a short squeeze if a catalyst drives price higher (Source: crypto.news).
Can the meme coin sector recover from this crash?
Historically, periods when the Fear and Greed Index dropped below 10 have preceded strong medium-to-long-term recoveries. After the March 2020 COVID crash, BTC rallied 1,584% within 13 months. After the November 2022 FTX collapse, markets recovered 150–1,400% from the lows (Source: 247WallSt). However, this drawdown differs structurally: there is no single identifiable catalyst for the decline, and institutions are net sellers rather than buyers, making the timing and magnitude of any potential recovery uncertain.
Sources
- PEPE Coin Price Tests Support as Whales Accumulate, crypto.news
- Meme Coin Market Shows Capitulation Signal Amid 34% Decline, CoinMarketCap/Santiment
- The Meme Coin Sector Is Down 75% From Its Peak, OpenPR
- Bitcoin's Fear Index Hit 9 — Here's What Happened Last 3 Times, 247WallSt
- DOGE Price Prediction: Targets $0.11 Resistance, blockchain.news
- Prediction: 4 Popular Cryptocurrencies Will Plunge, The Motley Fool
- Meme Coins Crashed 34% — Buying Window?, CryptoNewsNavigator
- Dogecoin Active Addresses Jump 36%, CoinPaper
Data Sources
- Real-time market data: Binance API, OKX API, CoinGecko (2026-02-28 20:42 KST)
- Fear and Greed Index: Alternative.me (2026-02-28)
- On-chain data: Santiment, crypto.news (2026-02-28)
- Technical indicators: crypto.news, blockchain.news (2026-02-28)
- Futures/derivatives data: Binance Futures API, crypto.news (2026-02-28)
This article is for informational purposes only and does not constitute investment advice. Meme coins are extremely volatile assets with no intrinsic value guarantee. All investment decisions should be made based on your own research and risk tolerance. Always do your own research (DYOR) before investing.