MANTRA Surges 61% on OM Rebrand — Token Swap Rally Analysis
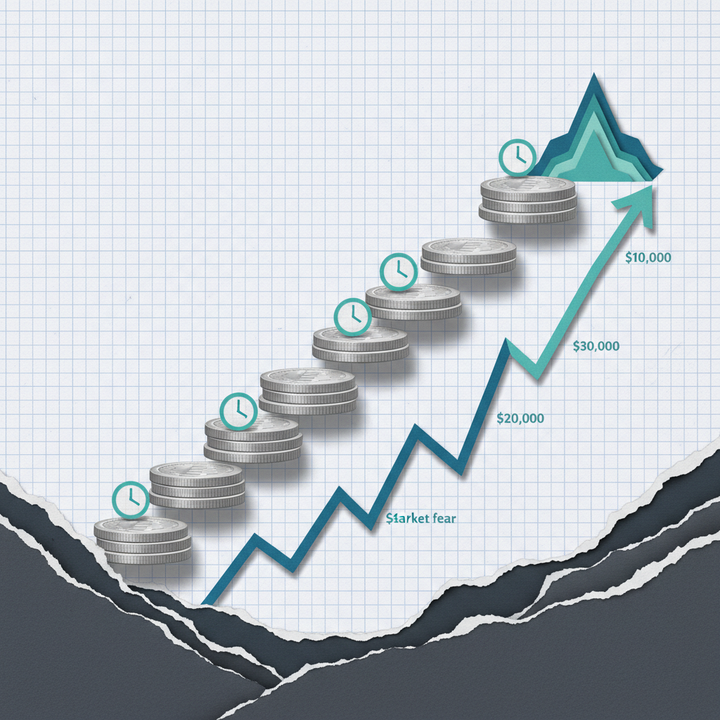
MANTRA surged 61.8% to $0.024 after the 1:4 token swap rebrand from OM on Binance, with $115.6M in 24h volume as Fear & Greed hits a historic low of 10.

MANTRA token surged 61.8% to $0.024 on March 4, 2026, after Binance completed a 1:4 token swap rebrand from OM — generating $115.6 million in 24-hour trading volume and becoming one of the day's most dramatic outliers in a market gripped by historic fear (Source: Blockchain Magazine).
The Crypto Fear & Greed Index sits at 10 out of 100 — the third most extreme reading since the index launched in 2018, behind only the COVID crash and the Terra-Luna collapse, both of which scored 8 (Source: SpotedCrypto). Meanwhile, 38% of all altcoins are trading near their all-time lows, surpassing the 37.8% recorded after FTX's implosion in November 2022 (Source: CoinPedia). Here's a complete breakdown of what drove the MANTRA rally, where the broader market stands, and what investors should watch next.
Key Takeaways
Quick Answer: MANTRA surged 61.8% to $0.024 after Binance completed a 1:4 token swap rebrand from OM on March 4, 2026. The event-driven rally generated $115.6M in 24-hour volume — a dramatic outlier in a market where the Fear & Greed Index sits at just 10/100 (Extreme Fear) and 38% of altcoins hover near all-time lows.
- MANTRA 24h price change: +61.8% to $0.024; intraday range $0.0143–$0.0256 (78.3% swing) (Source: Blockchain Magazine)
- 24h trading volume: $115.6 million globally
- Catalyst: OM → MANTRA rebrand with 1:4 token swap, completed on Binance March 4
- Fear & Greed Index: 10/100 (Extreme Fear), down 4 points — 3rd lowest since 2018
- Altcoin distress: 38% near all-time lows, worse than post-FTX collapse (37.8%)
- Altcoin Season Index: 35/100 — firmly in "Bitcoin Season" territory
- Whale accumulation: ~270,000 BTC (~$18.7B) over the past 30 days (Source: SpotedCrypto)
- BTC ETF inflows: $458 million on March 3 (Source: Bankless Times)
What Drove MANTRA's 61.8% Surge?
MANTRA is a Layer-1 blockchain project specializing in real-world asset tokenization (RWA) — the process of bringing traditional financial assets like real estate, bonds, and private equity onto the blockchain. On March 4, 2026, Binance officially completed a 1:4 token swap that converted every existing OM token into four MANTRA tokens. The per-unit price adjusted to one-quarter of OM's pre-swap value while total market capitalization remained unchanged. This was not a cosmetic name change. The rebrand marks MANTRA's strategic pivot from its origins as a DAO governance project (MANTRA DAO) to a regulation-friendly RWA infrastructure platform targeting institutional adoption — particularly through partnerships in Dubai and Abu Dhabi, where regulatory frameworks for tokenized assets are maturing rapidly. The intraday price swing from $0.0143 to $0.0256 — a 78.3% range — signals massive speculative interest around the event (Source: Blockchain Magazine).
Several factors converged to amplify the rally. Binance's official support ensured deep global liquidity and broad access for institutional and retail investors alike. The 1:4 split lowered the per-token price, triggering the well-documented "low-price token effect" — retail traders tend to perceive cheaper tokens as having more upside. And the RWA narrative itself is one of 2026's most compelling investment themes, with total tokenized real-world assets approaching $18.6 billion globally. On South Korea's largest exchange Upbit, MANTRA recorded ₩127.3 billion (~$87M) in 24-hour trading volume, ranking third behind only ETH and USDT — underscoring intense Asian demand.
| Metric | Value | Notes |
|---|---|---|
| Global Price | $0.024 | +61.8% (24h) |
| 24h High | $0.0256 | Intraday peak |
| 24h Low | $0.0143 | Intraday bottom |
| Intraday Swing | 78.3% | Low to high |
| 24h Volume | $115.6M | Global |
| Token Swap Ratio | 1 OM : 4 MANTRA | Market cap unchanged |
| Swap Exchange | Binance | Completed March 4 |
History offers useful parallels for managing expectations. When Polygon rebranded from Matic in 2022, the token rallied over 120% in three months. EOS saw a 50%+ short-term spike after announcing its Vaulta rebrand in 2023. Both cases were followed by 20–40% pullbacks within 2–4 weeks as initial hype faded. In the RWA sector specifically, MANTRA differentiates itself by operating its own Layer-1 chain rather than building on Ethereum like competitors Ondo Finance (focused on U.S. Treasury tokenization) and Centrifuge (SME lending). MANTRA's niche — large-scale real estate and private equity tokenization with Middle Eastern institutional partners — is distinctive but carries meaningful execution risk.
Broader Market: Extreme Fear Meets a Relief Rally
MANTRA's rally unfolded against a broader market bounce driven by reports that Iranian officials reached out to the CIA for peace talks, easing geopolitical tensions that had battered risk assets for weeks (Source: Bankless Times). As of March 4, 22:00 KST, Bitcoin traded at $71,330 on Binance, up 5.85% in 24 hours, while Ethereum climbed 4.43% to $2,053 and Solana rose 5.84% to $89.33. On OKX, BTC confirmed at $71,360 and ETH at $2,054, showing consistency across exchanges. The total crypto market cap stands at $2.48 trillion with BTC dominance at 57.2%. Bitcoin ETF investors added $458 million on March 3 alone, signaling institutional appetite even as the Fear & Greed Index printed 10/100 — down 4 points from the prior day and the third most extreme reading in the index's history (Source: SpotedCrypto).
| # | Coin | Price | 24h Change | Volume(24h) | High | Low |
|---|---|---|---|---|---|---|
| 1 | BTC | $71,330 | +5.85% | $2.4B | $71,893.00 | $66,158.00 |
| 2 | USDC | $1.00 | -0.03% | $1.4B | $1.00 | $1.00 |
| 3 | ETH | $2,053 | +4.43% | $1.2B | $2,092.90 | $1,929.56 |
| 4 | SOL | $89 | +5.84% | $482.0M | $91.48 | $82.50 |
| 5 | XRP | $1.39 | +2.65% | $238.1M | $1.43 | $1.34 |
| 6 | PAXG | $5,185 | -0.73% | $206.3M | $5,227.20 | $5,027.33 |
| 7 | USD1 | $1.00 | -0.03% | $193.4M | $1.00 | $1.00 |
| 8 | DOGE | $0.09 | +2.22% | $113.2M | $0.09 | $0.09 |
| 9 | BNB | $650 | +3.66% | $100.1M | $654.83 | $621.00 |
| 10 | ENSO | $1.32 | -2.94% | $84.1M | $1.36 | $1.28 |
Derivatives data reveals a more cautious undercurrent beneath the surface rally. BTC's funding rate sits at 0.0025% with a long/short ratio of 47.1%/52.9% — meaning more futures traders are positioned short, which could fuel a squeeze if the bounce extends. ETH funding is negative at -0.0071%, reflecting bearish sentiment on Ethereum futures. Open interest stands at $6.3 billion for BTC and $4.2 billion for ETH. Total 24-hour liquidations reached $226.87 million, with the largest single liquidation being a $4 million BTC-USD short on Bybit (Source: Gate.com).
| Coin | Funding Rate | Open Interest | Long/Short |
|---|---|---|---|
| BTC | 0.0025% | $6.3B | 47.1% / 52.9% |
| ETH | -0.0071% | $4.2B | 53.7% / 46.3% |
| SOL | 0.0011% | $867.9M | 60.7% / 39.3% |
| XRP | -0.0019% | $381.9M | 65.2% / 34.8% |
| DOGE | -0.0088% | $185.5M | 67.4% / 32.6% |
| BNB | 0.0000% | $335.1M | N/A |
| LINK | 0.0038% | $78.4M | N/A |
| ADA | -0.0070% | $81.5M | N/A |
CryptoQuant market analyst Darkfost captured the prevailing tension: "The overall environment remains unfavorable for risk-taking, and the first sector to bear the consequences is the cryptocurrency market, particularly altcoins" (Source: crypto.news). Yet he also struck a contrarian note: "It is precisely when conditions deteriorate significantly that opportunities also begin to emerge. When market conditions deteriorate to extreme levels, bottoming signals tend to emerge" (Source: CoinPedia).
The historical record supports that contrarian read. When the Fear & Greed Index dropped to 8 during the COVID crash in March 2020, buying Bitcoin at the $3,850 bottom yielded 123% returns in six weeks and over 1,800% within a year. The June 2022 Terra-Luna reading of 8 preceded a 40%+ recovery within 90 days. Historically, buying during sub-15 readings has produced positive 30-day returns roughly 80% of the time. Meanwhile, whale wallets holding 1,000+ BTC have accumulated approximately 270,000 BTC (~$18.7 billion) over the past 30 days — one of the largest accumulation sprees in Bitcoin history, a classic "smart money" signal diverging sharply from retail panic selling (Source: SpotedCrypto).
| Date | Fear & Greed | Event | BTC at Bottom | 90-Day Return |
|---|---|---|---|---|
| March 2026 | 10 | Iran conflict + altcoin capitulation | ~$63,000 | TBD |
| June 2022 | 8 | Terra-Luna + 3AC collapse | $17,600 | +40%+ |
| March 2020 | 8 | COVID Black Thursday | $3,850 | +123% (6 weeks) |
Outlook and Key Watchpoints
MANTRA's near-term trajectory hinges on three factors: whether the rebrand euphoria sustains beyond the initial spike, whether the broader market recovers from extreme fear levels, and whether MANTRA delivers tangible progress on its RWA partnerships. At $0.024 globally, the token has already digested the 1:4 swap catalyst. Past rebrand rallies — Polygon's 120% run followed by a pullback, EOS's 50% spike followed by correction — established a consistent pattern: an initial surge, then a 20–40% retracement within 2–4 weeks as hype fades. Investors should treat this historical pattern as the base case rather than the exception. The Altcoin Season Index at 35/100 confirms that capital continues to favor Bitcoin over altcoins, and BTC dominance at 57.2% could still climb further, pulling liquidity away from smaller tokens like MANTRA.
Bullish Scenario
If the RWA sector sees accelerated institutional adoption and MANTRA announces concrete results from its Middle Eastern real estate tokenization projects, the token has room to extend gains. The Fear & Greed reading of 10 has historically preceded strong multi-month recoveries, and $458 million in BTC ETF inflows on March 3 suggests institutional capital is re-entering crypto. A broader market rebound from extreme fear could disproportionately benefit event-driven tokens with fresh catalysts.
Bearish Scenario
If the rebrand proves to be a one-off catalyst without meaningful ecosystem growth, MANTRA risks retracing a significant portion of its 61.8% gain. With 38% of altcoins near all-time lows and the Altcoin Season Index signaling clear Bitcoin dominance, capital rotation out of small-cap alts could accelerate. Renewed Iran-U.S. geopolitical tensions or FATF stablecoin regulatory pressure — stablecoins accounted for 84% of 2025's $154 billion in illicit crypto volume (Source: CoinDesk) — could trigger another risk-off selloff across the board.
Key indicators to monitor:
- Post-rebrand correction pattern: Watch whether MANTRA holds above $0.020 or follows the typical 2–4 week retracement seen in past rebrands
- Volume sustainability: The $115.6M in 24-hour volume needs to hold — fading volume signals fading interest
- RWA ecosystem metrics: On-chain TVL growth and new partnership announcements will determine fundamental value
- Fear & Greed recovery: A move from 10 back to the 20–25 range would signal broader market stabilization
- Whale behavior: The 270,000 BTC accumulation trend among large wallets is a leading indicator for overall market direction
- BTC dominance trajectory: A decline below 55% would signal capital rotation back into altcoins
Frequently Asked Questions
What is the MANTRA rebrand and 1:4 token swap?
The MANTRA rebrand converted the existing OM (MANTRA DAO) token into MANTRA at a 1:4 ratio — each OM token became 4 MANTRA tokens. The per-token price adjusted to one-quarter while total market capitalization remained the same. Binance completed the swap on March 4, 2026.
How do I participate in the MANTRA token swap?
On major exchanges like Binance, the swap was processed automatically. If you held OM in a personal wallet, visit MANTRA's official website to complete the swap manually. Most major exchanges are now trading under the MANTRA ticker.
What is MANTRA's core business?
MANTRA is a Layer-1 blockchain specializing in real-world asset (RWA) tokenization — bringing traditional financial assets like real estate, bonds, and private equity onto the blockchain. The project focuses on institutional partnerships in the Middle East, particularly within Dubai and Abu Dhabi's regulatory frameworks.
Can MANTRA keep rising after the 61.8% surge?
Short-term profit-taking pressure is expected after such a sharp rally. Historical rebrand precedents show 20–40% corrections within 2–4 weeks. However, if the RWA sector's growth continues and overall market sentiment recovers from the extreme fear zone, medium-term upside remains possible. All investment decisions should be based on your own research and risk tolerance.
Sources
- BREAKING: MANTRA Surges 61.8%, Blockchain Magazine
- 38% of Altcoins Near All-Time Lows, CoinPedia
- Fear & Greed Index Hits 10, SpotedCrypto
- Whales Accumulate 270K BTC, SpotedCrypto
- Altcoin Capitulation Deepens, Crypto.news
- Here's Why Crypto Is Going Up Today, Bankless Times
- FATF Warns Stablecoins Used in Sanctions Evasion, CoinDesk
Market data: Binance API, OKX API (March 4, 2026, 22:00 KST)
This article is for informational purposes only and does not constitute investment advice. Cryptocurrency investments carry high volatility and the risk of principal loss. All investment decisions should be made based on your own judgment and risk tolerance.