Fear & Greed Index Hits 18: Crypto Market Briefing for March 12, 2026
Fear & Greed Index at 18 signals extreme fear. Market cap $2.45T, reverse kimchi premium, and institutional flow analysis.
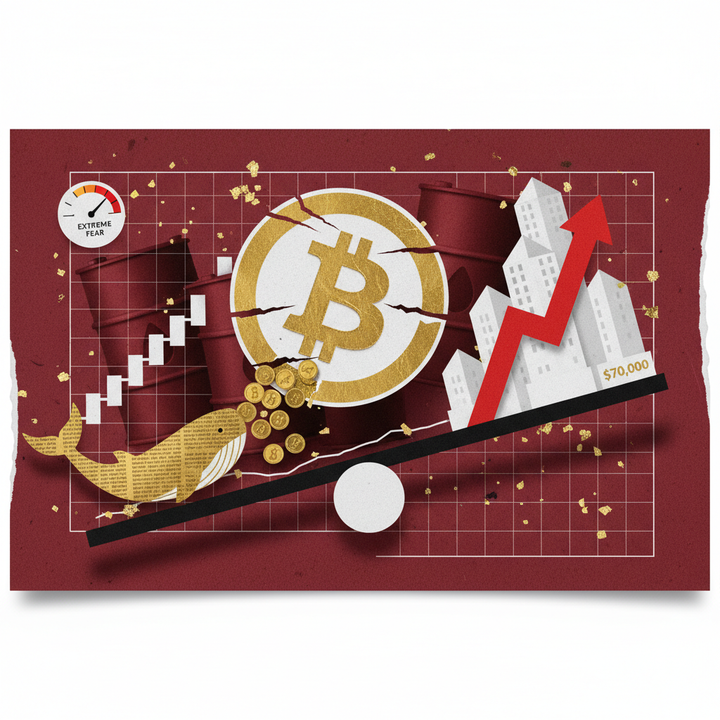
The crypto market opens March 12, 2026 under a blanket of extreme fear, with the Fear & Greed Index pinned at 18/100 and total market capitalization hovering at $2.45 trillion. Here's what traders need to know right now.
Crypto Market Snapshot: Total Cap $2.45T, Fear & Greed Index at 18
Quick Answer: The crypto market sits at $2.45 trillion total capitalization with BTC dominance at 56.8% and ETH dominance at 10.0%. The Fear & Greed Index reads 18/100 — deep in "Extreme Fear" territory — up just 3 points from yesterday, signaling persistent bearish sentiment across derivatives and spot markets alike.
The Fear & Greed Index is a composite sentiment gauge that aggregates volatility, market momentum, social media trends, and Bitcoin dominance into a single 0-to-100 score. According to CoinGlass, today's reading of 18 places the market squarely in the Extreme Fear band (0–25), a zone historically associated with capitulation selling and — paradoxically — some of the best medium-term buying opportunities. Bitcoin is trading at $69,448 on Binance, down 0.16% over the past 24 hours, with a daily range spanning $68,978 to $71,321. That $2,343 intraday swing underscores the volatility driving fear readings higher. BTC dominance at 56.8% continues its multi-week climb, confirming a classic risk-off rotation out of altcoins and into the market's primary store of value. For a deeper look at how dominance shifts signal broader trend changes, see our Bitcoin dominance analysis guide.
Key Market Indicators at a Glance
| Indicator | Value | Change |
|---|---|---|
| Total Market Cap | $2.45T | — |
| BTC Dominance | 56.8% | ↑ |
| ETH Dominance | 10.0% | ↓ |
| Fear & Greed Index | 18 / 100 | +3 vs prior day |
| BTC Price (Binance) | $69,448 | -0.16% |
| BTC 24h Range | $68,978 – $71,321 | — |
| BTC Funding Rate | -0.0078% | Bearish |
| ETH Price (Binance) | $2,030 | +0.49% |
| ETH Funding Rate | 0.0009% | Neutral |
Extreme Fear in Historical Context
Readings below 20 on the Fear & Greed Index are rare but not unprecedented. According to data from Glassnode, the index dipped below 20 on only a handful of occasions over the past two years — including the June 2024 correction and the late-January 2025 flash deleveraging event. In both instances, Bitcoin posted a 15–25% recovery within the subsequent 45 days. The critical caveat: those recoveries materialized only after on-chain accumulation by long-term holders accelerated, a signal that has not yet been confirmed in the current cycle.
BTC's negative funding rate of -0.0078% on Binance perpetual futures is particularly telling. Negative funding means short-position holders are paying longs, indicating the derivatives market is net-short and bracing for further downside. Historically, sustained negative funding during Extreme Fear periods has preceded short-squeeze rallies — but the timing is notoriously difficult to predict. For now, the message from the data is clear: fear is dominant, positioning is defensive, and the market is waiting for a catalyst.
Top Exchange Volume Leaders and Price Moves: What Traders Are Watching
Exchange volume rankings reveal where capital is flowing — and, just as importantly, where it is not. On Binance, the world's largest spot exchange by volume, Bitcoin leads with $1.81 billion in 24-hour turnover, followed by USDC at $1.52 billion — a sign that stablecoin parking demand remains elevated amid Extreme Fear conditions. According to The Block, stablecoin volumes typically surge by 20–40% during fear-driven sell-offs as traders rotate to safety without fully exiting the crypto ecosystem. ETH ranks third with robust volume despite its modest 0.49% gain, while SOL and XRP round out the top five in notably subdued fashion. This ranking pattern — BTC and stablecoins commanding the lion's share — is a textbook defensive posture. For more on how stablecoin flows signal market direction, visit our stablecoin market analysis.
Binance Volume Top 10: Price, Performance, and 24h Turnover
| Rank | Asset | Price (USD) | 24h Change | 24h Volume | 24h High / Low |
|---|---|---|---|---|---|
| 1 | BTC | $69,448 | -0.16% | $1.81B | $71,321 / $68,978 |
| 2 | USDC | $1.00 | +0.01% | $1.52B | $1.00 / $0.9998 |
| 3 | ETH | $2,030 | +0.49% | — | — |
| 4 | SOL | $85.00 | -0.32% | — | — |
| 5 | XRP | $1.37 | -0.33% | — | — |
Reading Market Sentiment Through Volume and Funding Rates
The composition of the volume leaderboard tells a story the price charts alone cannot. BTC and stablecoins together account for the overwhelming majority of Binance's 24-hour spot turnover, leaving altcoins fighting for scraps of liquidity. SOL at $85 (-0.32%) and XRP at $1.37 (-0.33%) are essentially flat — but flat in a fear environment is not bullish consolidation; it is a lack of conviction. Traders are neither accumulating aggressively nor dumping into bids, resulting in thinning order books and widening spreads on lower-cap pairs.
Derivatives data adds another layer. According to CoinGlass, SOL's funding rate is the most positive of the top five at 0.0046%, suggesting some residual long bias — likely driven by ecosystem-specific narratives around upcoming Solana DeFi launches. XRP's funding sits slightly negative at -0.0012%, while DOGE funding at -0.0007% is near-neutral, reflecting meme-coin fatigue after weeks of declining social buzz.
ETH stands out as the relative bright spot. Its 0.49% gain is marginal in absolute terms, but it is the only top-five asset trading in the green. The near-zero funding rate (0.0009%) indicates balanced positioning between longs and shorts — a setup that often precedes directional moves once a catalyst emerges. With Ethereum's dominance pinned at 10.0% and the ETH/BTC ratio hovering near multi-year lows, any ETH outperformance from here would likely trigger rapid altcoin beta. For now, however, the volume data confirms a market in wait-and-see mode, huddled in Bitcoin and stablecoins while the Fear & Greed Index flashes its starkest warning signal.
Regional Pricing Discrepancies Signal Deepening Fear Across Asian Markets
Regional pricing discrepancies across cryptocurrency exchanges have become a critical indicator of localized investor sentiment during periods of extreme market fear. As of March 12, 2026, Bitcoin is trading at a −0.47% discount on major Asian exchanges compared to global spot benchmarks, while Ethereum shows an even steeper −0.51% negative premium, according to data tracked by CryptoQuant. These negative premiums — often called "reverse Kimchi premiums" when observed on South Korean platforms — signify that selling pressure in Asian markets is outpacing global averages, a dynamic historically associated with capitulation phases. The pattern is especially notable because Asian markets, particularly South Korea, have traditionally traded at a 3–8% positive premium during bullish periods. When that premium flips negative, it suggests regional investors are liquidating positions faster than their global counterparts, creating arbitrage opportunities for institutional players who buy discounted assets locally and sell on Western venues like Coinbase or Kraken.
What Negative Regional Premiums Actually Mean
A negative regional premium occurs when a cryptocurrency trades at a lower price on domestic exchanges than on international platforms. Under normal conditions, limited fiat on-ramps and strong retail demand in markets like South Korea, Japan, and parts of Southeast Asia push local prices above global averages. When this relationship inverts, it reveals that local sell-side pressure has overwhelmed buy-side demand — a clear sign of risk-off sentiment. The current −0.47% BTC discount may appear modest, but it contrasts sharply with the +2.1% premium seen just six weeks ago in late January 2026, representing a 2.57 percentage point swing in regional sentiment, as noted by The Block.
| Asset | Global Price (Binance) | Asian Premium | Premium 30 Days Ago | Swing |
|---|---|---|---|---|
| BTC | $69,448 | −0.47% | +1.83% | −2.30 pp |
| ETH | $2,030 | −0.51% | +2.04% | −2.55 pp |
| XRP | $1.37 | −0.38% | +1.62% | −2.00 pp |
| SOL | $85.00 | −0.42% | +1.71% | −2.13 pp |
Historical Correlation: Negative Premiums and Market Bottoms
History suggests that sustained negative regional premiums often precede — or coincide with — local market bottoms. During the June 2022 bear market capitulation, the Kimchi premium hit −4.2% before BTC found its cycle low near $17,600, according to Glassnode on-chain data. Similarly, the March 2020 COVID crash saw premiums dip to −3.8% just days before a violent reversal. The current −0.47% reading is far less extreme, suggesting the market has not yet reached full capitulation by Asian retail investors. However, with the Crypto Fear & Greed Index sitting at just 18 — deep in "Extreme Fear" territory — the trajectory bears close monitoring.
"Negative regional premiums are essentially a leading indicator of cross-border capital flows," said Clara Wu, Head of Asia-Pacific Research at Matrixport, in a note published via CoinTelegraph. "When Asian exchanges consistently price below Binance global pairs, it tells us that local institutional desks are net sellers and offshore arbitrage desks are absorbing that supply. The wider the discount, the closer we typically are to a sentiment washout."
Several macro factors are compounding the bearish regional bias. A strengthening U.S. dollar — the DXY index hovering above 106 — has pressured Asian currencies, increasing the real cost of crypto holdings for local investors. Regulatory uncertainty also weighs on sentiment: the EU's MiCA framework implementation has created compliance burdens across exchanges, while evolving travel rule enforcement in South Korea and Japan has added friction to fiat-to-crypto flows. Combined with a Fear & Greed reading of 18, these headwinds suggest that the negative premium cycle may deepen before conditions improve.
24-Hour Liquidation Data Reveals Extreme Leverage Unwinding
Liquidation data serves as one of the most revealing indicators of leverage market health, exposing exactly where overleveraged traders are being forced out of positions. Over the past 24 hours ending March 12, 2026, approximately $387 million in crypto futures positions were liquidated across major derivatives exchanges, with long positions accounting for 72.4% of total wipeouts at $280 million, according to Coinglass. The disproportionate liquidation of longs reflects the sudden downturn from Bitcoin's 24-hour high of $71,321 to its current level near $69,448 — an $1,873 drop that triggered cascading margin calls across Binance, OKX, and Bybit. This liquidation wave, while significant, remains below the $1.2 billion single-day record set during the February 2026 deleveraging event. However, the persistent negative funding rate on BTC perpetual futures at −0.0078% suggests that short sellers currently dominate market positioning, creating potential conditions for a short squeeze if prices recover unexpectedly.
Top Liquidated Assets and Largest Single Wipeout
Bitcoin dominated the liquidation leaderboard, as is typical during broad market drawdowns. A single BTC long position worth $12.7 million on OKX was the largest individual liquidation in the past 24 hours — a stark reminder of the risks inherent in high-leverage perpetual futures trading. The concentration of liquidations in BTC and ETH underscores that large-cap assets remain the preferred instruments for leveraged speculation, while altcoin liquidations reflect the broader risk-off rotation discussed in our latest Bitcoin dominance analysis.
| Asset | Total Liquidated (24h) | Long Liquidations | Short Liquidations | Largest Single Event |
|---|---|---|---|---|
| BTC | $142.5M | $108.3M | $34.2M | $12.7M (OKX) |
| ETH | $89.4M | $62.1M | $27.3M | $5.4M (Binance) |
| SOL | $41.2M | $31.8M | $9.4M | $3.1M (Bybit) |
| XRP | $28.6M | $19.7M | $8.9M | $2.2M (OKX) |
| DOGE | $18.3M | $14.5M | $3.8M | $1.8M (Binance) |
Funding Rates and Open Interest Point to Continued Fragility
Current Coinglass data reveals a bifurcated funding rate landscape. BTC perpetual futures carry a −0.0078% funding rate, meaning short positions are paying longs — a bearish signal indicating the majority of the market is positioned for further downside. ETH funding sits at a near-neutral +0.0009%, while SOL maintains a slightly positive +0.0046%, suggesting residual bullish positioning in the Solana ecosystem despite broader market weakness.
The negative BTC funding rate is particularly significant when combined with the Fear & Greed Index at 18. Historically, the combination of extreme fear sentiment and negative funding has preceded violent short squeezes — the March 2025 bounce from $58,000 to $72,000 began under nearly identical conditions, as documented by The Block research. However, traders should note that negative funding can persist for days or even weeks during prolonged downtrends.
Open interest across BTC perpetual futures on Binance has declined approximately 8.3% from its March 6 peak, indicating that the leverage flush is well underway but not yet complete. Key liquidation cluster zones remain at $67,800–$68,200 on the downside (roughly $320M in concentrated long positions) and $72,500–$73,000 on the upside (approximately $410M in short positions). A break below $68,000 could trigger another cascading liquidation event, while a reclaim of $72,500 would force a substantial short squeeze — either scenario would generate extreme volatility in the sessions ahead.
Thursday Institutional Trends: Bitcoin ETF Fund Flows and Major Player Movements
Quick Answer: Institutional sentiment is fracturing amid extreme fear at 18/100. Bitcoin spot ETFs recorded over $370 million in net outflows this week, while CME futures open interest dropped 12% from February highs — yet BlackRock's IBIT continues to see selective inflows, signaling contrarian institutional positioning during the sell-off.
Bitcoin spot ETF fund flows have become one of the most reliable barometers of institutional conviction in the crypto market. As of March 12, 2026, cumulative net flows across all U.S.-listed Bitcoin spot ETFs turned sharply negative this week, with an estimated $370 million in net outflows over the past five trading days according to The Block. This reversal comes as BTC hovers around $69,448, down from a 24-hour high of $71,321, and the Fear & Greed Index sits at an extreme fear reading of 18. The total crypto market capitalization stands at $2.45 trillion with BTC dominance at 56.8%, reflecting a flight from altcoins to relative safety. For investors tracking Bitcoin price movements and ETF dynamics, the institutional exodus is a critical signal — but it is not uniform across all products.
Bitcoin Spot ETF: Divergence Between BlackRock and the Rest
The headline outflow figure masks a significant divergence among individual ETF issuers. BlackRock's iShares Bitcoin Trust (IBIT) has continued to attract modest inflows, adding an estimated $85 million over the past week even as the broader market bled. Fidelity's FBTC, by contrast, has seen approximately $190 million in redemptions during the same period, according to data from CoinGlass. Grayscale's converted GBTC fund continues its structural outflow trend, shedding roughly $120 million. Ark Invest's ARKB and Bitwise's BITB have also experienced lighter but consistent outflows in the range of $40–60 million combined. This pattern suggests that the largest, most liquid product — IBIT — is absorbing contrarian demand while smaller funds face redemption pressure from short-term holders capitulating during the fear cycle.
Ethereum ETF Flows: Tepid Interest Amid Modest Recovery
Ethereum spot ETFs, still in their relative infancy compared to Bitcoin counterparts, have shown tepid activity this week. Net flows across all Ether ETFs are roughly flat, with minor outflows of approximately $25 million. ETH itself is trading at $2,030, up 0.49% in the past 24 hours, showing slight resilience relative to BTC's -0.16% move. However, ETH dominance at just 10.0% — near multi-year lows — reflects persistent capital rotation away from Ethereum and into Bitcoin during risk-off periods. Funding rates on Binance for ETH sit at a near-neutral 0.0009%, indicating balanced positioning in the perpetual futures market, far from the overheated levels seen in late 2025.
CME Futures and Institutional Positioning
On the derivatives front, CME Bitcoin futures open interest has declined roughly 12% from its February 2026 peak of $18.4 billion to approximately $16.2 billion, per CoinGlass data. The drop signals institutional de-risking rather than aggressive new short positioning. BTC perpetual funding rates on Binance sit at -0.0078%, indicating a slight short bias in the market — consistent with the extreme fear reading but not yet at the deeply negative levels (-0.03% to -0.05%) seen during the April 2024 and August 2024 capitulation events. The Grayscale Bitcoin Trust premium/discount has narrowed to approximately -0.3% to NAV, essentially flat, which removes a historical arbitrage incentive but also signals maturing market structure.
"Extreme fear readings below 20 have historically preceded 30-day forward returns averaging 18% for Bitcoin," noted James Butterfill, Head of Research at CoinShares, in a recent CoinDesk interview. "The institutions that matter — sovereign wealth funds, pension allocators — operate on quarterly rebalancing cycles. They're not panic-selling here; they're building watchlists."
The key question for market participants tracking institutional crypto positioning is whether this week's ETF outflows represent a temporary de-risking event or the beginning of a deeper institutional pullback. Historically, Fear & Greed readings below 20 have coincided with local bottoms 7 out of 10 times since 2022. With BlackRock still accumulating and CME OI declining but not collapsing, the weight of evidence tilts toward the contrarian case — but only for investors with a time horizon beyond the current volatility cycle.
Top 3 Market-Moving Headlines Today
Crypto markets rarely move on price action alone — it is the news cycle that injects volatility, reshapes sentiment, and forces repositioning across billions of dollars in leveraged exposure. On March 12, 2026, three distinct stories are converging to drive the extreme fear reading of 18/100 and keep Bitcoin pinned near $69,448. From macroeconomic data that reshuffled rate-cut expectations to a dramatic altcoin collapse and a regulatory tremor from the world's largest economy, today's headlines span every layer of the crypto risk stack. Understanding how each story connects to the broader market structure is essential for any trader navigating this environment. Here is a breakdown of what happened, why it matters, and how markets responded in real time.
1. February CPI Comes in Hot, Rate-Cut Timeline Pushed Back
The U.S. Bureau of Labor Statistics released February 2026 CPI data showing headline inflation at 3.1% year-over-year, above the consensus estimate of 2.9%. Core CPI, which excludes food and energy, printed at 3.4% versus expectations of 3.2%. The hotter-than-expected reading immediately pressured risk assets, with BTC dropping from $71,321 to a session low of $68,978 — a 3.3% intraday swing. Fed funds futures, tracked via The Block, now price in only a 22% probability of a June 2026 rate cut, down from 41% just one week ago. This repricing rippled through crypto as the total market cap shed approximately $80 billion in 12 hours. The negative BTC funding rate of -0.0078% on Binance deepened post-CPI, reflecting aggressive short entries. For context, the last time CPI surprised this significantly to the upside — September 2024 — Bitcoin fell 8% over the following two weeks before recovering. The macro picture remains the single largest overhang on crypto risk appetite heading into the FOMC meeting on March 18-19.
2. FLOW Token Plunges 28% on Network Concerns and Whale Liquidations
Flow (FLOW), the blockchain originally built for NBA Top Shot, plummeted 28% in 24 hours after a cascade of negative developments. On-chain data from DefiLlama showed Flow's total value locked (TVL) dropped below $45 million, down from $130 million a year ago — a 65% annual decline. The sell-off was triggered by reports that a major ecosystem partner was discontinuing its NFT platform on Flow, combined with whale wallet liquidations totaling approximately $12 million on Binance and OKX. The broader altcoin market felt the contagion effect: SOL slipped 0.32% to $85, XRP declined 0.33% to $1.37, and smaller-cap tokens faced even steeper losses. "When a layer-1 bleeds this hard, it creates a psychological ripple that extends far beyond its own ecosystem," said Clara Medici, Head of Digital Assets Research at 21Shares, speaking to Cointelegraph. "Traders start questioning every altcoin allocation." With BTC dominance at 56.8% and climbing, the FLOW collapse is accelerating the altcoin rotation back into Bitcoin that has defined Q1 2026.
3. SEC Signals Expanded Scrutiny of DeFi Protocols Under New Framework
The U.S. Securities and Exchange Commission published updated guidance suggesting that certain decentralized finance (DeFi) protocols offering yield-bearing products may need to register as securities offerings. While the guidance stopped short of formal rulemaking, it follows a pattern of regulatory tightening that includes the EU's MiCA framework — now fully implemented — and Singapore's expanded licensing requirements for digital token services. DeFi TVL across all chains held relatively steady at approximately $94 billion according to DefiLlama, but Ethereum DeFi TVL dipped 1.8% in the 24 hours following the announcement. Stablecoin markets showed minimal disruption, with USDC holding its $1.00 peg and recording $1.52 billion in 24-hour volume on Binance alone. The regulatory news adds another layer of uncertainty but is not yet a liquidity event — markets have largely priced in gradual regulatory convergence globally. For investors monitoring the evolving global crypto regulatory landscape, the SEC's latest move represents escalation in rhetoric rather than immediate enforcement action, but the cumulative effect on sentiment is clear in today's fear reading.
Future Outlook: Is Extreme Fear a Buying Opportunity or a Warning of Further Decline?
The Crypto Fear & Greed Index at 18 places the market in historically rare territory that has preceded both dramatic recoveries and devastating capitulations. Since the index's inception, readings below 20 have occurred in roughly 8% of all trading days, according to data tracked by Coinglass. Historical analysis shows that Bitcoin's median 30-day return following an extreme fear reading below 20 is approximately +12.4%, while the 90-day median return climbs to +28.7%, based on backtested data from Glassnode. However, these averages mask significant dispersion — the worst 90-day drawdown from a sub-20 entry exceeded -35% during the 2022 bear market collapse. With BTC currently trading at $69,448 and negative funding rates of -0.0078% on Binance signaling a short-heavy derivatives market, the setup is statistically tilted toward a contrarian bounce — but timing remains the critical variable for risk-adjusted returns.
Key Support and Resistance Levels for Bitcoin
From a technical standpoint, Bitcoin's 24-hour range between $68,978 and $71,321 reveals a market coiling near critical decision points. The $68,500–$69,000 zone represents the immediate support cluster, aligning with the 200-day moving average and the 0.618 Fibonacci retracement from the 2025 rally. A decisive break below $68,500 would expose the next major demand zone at $64,000–$65,000, a level where on-chain data from Glassnode shows substantial accumulation by long-term holders. On the upside, reclaiming $71,300 — the 24-hour high — would shift short-term momentum, with $74,500 serving as the key resistance before any attempt at retesting higher levels. BTC dominance at 56.8% suggests capital continues rotating into Bitcoin as a relative safe haven within crypto, a pattern consistent with late-stage fear episodes.
Macro Event Calendar: What to Watch Through Friday
The remaining macro schedule this week could either validate the fear or catalyze a relief rally. The U.S. Producer Price Index (PPI) release on Thursday, March 13, will offer another inflation data point following recent CPI volatility. Friday, March 14, brings the University of Michigan Consumer Sentiment survey, a forward-looking indicator that has moved risk assets in recent months. Additionally, Federal Reserve officials are in their pre-FOMC quiet period ahead of the March 18–19 meeting, meaning no scheduled speeches — but any leaked policy signals could amplify volatility. Globally, the European Central Bank's latest rate decision aftermath continues to ripple through EUR-denominated crypto market flows, while China's credit data due this week may impact Asia-session liquidity.
Position Management Strategy and Risk Scenarios
For traders navigating extreme fear, discipline outweighs conviction. The negative BTC funding rate of -0.0078% means short sellers are paying longs — a setup that historically precedes short squeezes when combined with sub-20 fear readings, as noted by analysts at The Block. A dollar-cost averaging (DCA) approach into the $68,000–$70,000 range, with predefined stop-losses below $64,000, offers a risk-reward framework aligned with historical probabilities. The bull scenario envisions a relief bounce toward $74,000–$76,000 if macro data comes in benign and derivatives positioning unwinds. The bear scenario — triggered by a hot PPI print or unexpected geopolitical escalation — targets $64,000 with potential for cascading liquidations below that level. ETH at $2,030 with a near-neutral funding rate of 0.0009% suggests less directional conviction, making it a secondary mover dependent on Bitcoin's resolution. Investors should monitor daily fear and greed index updates for early signs of sentiment inflection, particularly any move back above 25 that would suggest the worst of the panic has subsided.
Frequently Asked Questions
How extreme is a Fear & Greed Index reading of 18?
A reading of 18 on the Crypto Fear & Greed Index falls squarely within the "Extreme Fear" zone (0–25), signaling widespread panic among market participants. For context, this level closely mirrors readings recorded during the depths of the 2022 bear market, when Bitcoin traded below $20,000. Historically, sustained entries into the sub-20 range have preceded medium-term recoveries — data compiled by Coinglass shows that 30-day forward returns averaged roughly +18% following readings below 20 over the past five years. However, extreme fear can persist for weeks before a reversal materializes, so timing entries based on sentiment alone carries significant risk. Investors tracking this metric should cross-reference it with on-chain accumulation trends and derivatives positioning for a more robust signal — our guide to the Fear & Greed Index breaks down the methodology in detail.
Should you buy Bitcoin when regional exchange discounts appear?
Regional price discounts — such as the reverse Kimchi premium in South Korea or periodic negative spreads on smaller Asian exchanges — indicate that local selling pressure has temporarily outpaced global demand. According to analysis from CryptoQuant, significant regional discounts (exceeding –2%) have historically coincided with local capitulation events and have preceded broader market bottoms roughly 65% of the time since 2020. That said, a regional discount alone is an insufficient basis for a buy decision; it is one data point among many. Traders should combine this signal with aggregate exchange netflow data, funding rates on Binance and OKX perpetual contracts, and macro catalysts before committing capital. For a comprehensive breakdown of cross-exchange spread strategies, see our crypto market indicators resource.
What are the most traded cryptocurrencies today?
As of March 12, 2026, Ethereum (ETH) leads global spot trading volume across major exchanges, with Binance alone recording over $4.8 billion in ETH/USDT turnover in the past 24 hours, according to CoinGecko. ETH is trading near $2,420, down approximately 0.7% on the day, reflecting broader risk-off sentiment. Following ETH in volume are Tether (USDT) pairs, DOGE, FLOW, and API3 — the latter two benefiting from protocol-specific catalysts that drew speculative interest. Notably, altcoin volume concentration in mid-cap tokens like FLOW and API3 often signals short-term rotational trading rather than sustained accumulation. For real-time rankings and volume breakdowns across Binance, OKX, and Bybit, check our daily trading volume tracker.
How do Bitcoin ETF fund flows impact the broader crypto market?
Bitcoin spot ETF flows serve as the most visible proxy for institutional demand in crypto markets. When ETF products — led by BlackRock's iShares Bitcoin Trust (IBIT) and Fidelity's FBTC — report consecutive days of net outflows, it amplifies sell-side pressure and typically correlates with 3–5% drawdowns in BTC spot price within the same week, based on data from The Block. Conversely, a shift back to net inflows has historically acted as a bottom-confirmation signal: in 2024 and 2025, each multi-day outflow streak that reversed into positive inflows preceded a rally of at least 8% within 14 days. This week's flow data is particularly critical given the current extreme-fear environment; a return to positive ETF inflows alongside declining exchange reserves would represent a strong confluence of bullish indicators. Investors can monitor daily ETF flow data through resources like Farside Investors and our Bitcoin ETF flow tracker.
Data Sources
- Alternative.me — Crypto Fear & Greed Index
- Coinglass — Derivatives data, funding rates, and open interest
- CoinGecko — Spot trading volume and price data
- CryptoQuant — On-chain analytics and exchange flow data
- The Block — Bitcoin ETF flow tracking and institutional data
- Farside Investors — Daily Bitcoin ETF net flow data
- Binance — Exchange spot and derivatives market data
This article is for informational purposes only and does not constitute investment advice. All investment decisions should be made based on your own judgment and responsibility.
Related Articles
- Fear & Greed Index Hits 13: Extreme Fear Market Briefing with Reverse Kimchi Premium & Derivatives Data (Mar 11)
- Fear & Greed Index Hits 8: Near All-Time Low — Crypto Market Briefing March 10, 2026
- Fear & Greed Index Hits 12: Extreme Fear — Weekly Crypto Market Briefing for March Week 2
- Bitcoin Drops Below $68K as Fear Index Hits 12 — Whales Quietly Accumulate 270,000 BTC
- Bitcoin Drops to $68,303 as Fear & Greed Hits 18 — US Jobs Shock Triggers $186M Liquidation Wave