Fear & Greed Index Hits 12: Extreme Fear Grips Crypto as Every Funding Rate Turns Negative
Fear & Greed Index at 12 signals extreme fear. Negative funding rates and $334M in liquidations — but whales are buying.
The crypto Fear & Greed Index has plunged to 12 out of 100 — deep in "Extreme Fear" territory — as $334 million in positions were liquidated over the past 24 hours and negative funding rates dominate every major cryptocurrency on Binance Futures.
As of March 8, 2026 at 17:06 KST, the total cryptocurrency market capitalization stands at $2.38 trillion, with Bitcoin (BTC) dominance at 56.5% and Ethereum (ETH) dominance at just 9.9% (Source: CoinGecko, March 8, 2026). BTC is trading at $67,291 on Binance, down 0.73% in the past 24 hours, while ETH has slipped 1.50% to $1,953. Solana (SOL) has fared worse, dropping 1.67% to $82.85.
What makes the current environment particularly striking is the convergence of bearish signals: universally negative funding rates across every tracked asset, a Fear & Greed reading that has remained below 15 for multiple consecutive sessions, and spot BTC ETF outflows totaling $7.8 billion since November 2025 — roughly 12% of total assets under management (Source: CoinShares, March 2026). Yet beneath the surface, whale wallets have quietly accumulated 270,000 BTC — approximately $18.7 billion worth — over the past 30 days (Source: Glassnode, March 2026). The question is whether this represents smart-money accumulation ahead of a rebound, or the beginning of a deeper correction.
What Does a Fear & Greed Index of 12 Mean for Crypto Markets?
Quick Answer: The Crypto Fear & Greed Index measures market sentiment on a 0–100 scale. A reading of 12 places the market in "Extreme Fear," indicating widespread panic selling and risk aversion. Historically, readings below 15 have preceded positive 90-day BTC returns approximately 80% of the time (Source: Alternative.me).
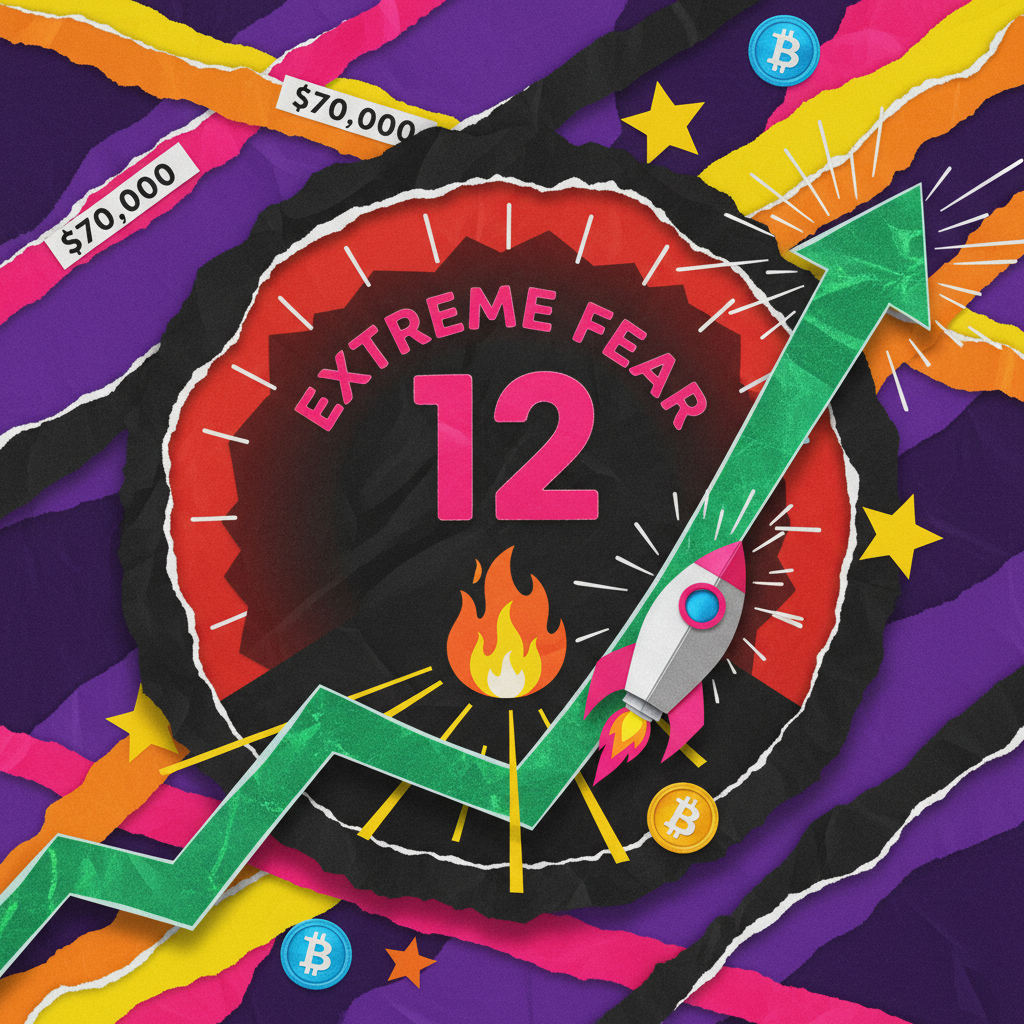
The Fear & Greed Index is a composite indicator that aggregates volatility, market momentum and volume, social media sentiment, Bitcoin dominance, and Google Trends data into a single score between 0 (maximum fear) and 100 (maximum greed). A reading of 12 means the market is experiencing one of its most fearful periods in recent history — a level that, in isolation, would place it alongside the aftermath of major market crashes (Source: Alternative.me, March 8, 2026).
For context, the index hit an all-time low of 5 on February 6, 2026 — the lowest reading since the index launched in 2018 — before briefly recovering to the mid-20s and then sliding back into extreme fear territory. The current reading of 12 has held steady, unchanged from the previous day, indicating that sentiment has not yet found a stable floor (Source: Spoted Crypto).
The Altcoin Season Index adds another layer to the picture: at 35 out of 100, it sits well below the 75 threshold that would signal an "altcoin season." A full 38% of altcoins are currently trading near their all-time lows — the largest wave of altcoin weakness in the current cycle (Source: CoinMarketCap, March 2026). This risk-off rotation toward Bitcoin is a classic signature of a market under severe stress, where investors abandon higher-beta assets in favor of the perceived relative safety of BTC.
Binance and OKX Volume Rankings: Where Capital Is Flowing Right Now
In periods of extreme fear, tracking volume reveals where capital is concentrating and where it is fleeing. Volume shifts during panic episodes often provide the earliest clues about which assets will lead a recovery — or which will continue to bleed. As of March 8, 2026, Binance recorded $967.3 million in BTC spot trading volume over the past 24 hours, making Bitcoin by far the most actively traded asset on the world's largest exchange. ETH followed with $432 million, SOL with $127 million, and XRP with $70.1 million (Source: Binance, March 8, 2026).
| # | Coin | Price | 24h Change | Volume (24h) | High | Low |
|---|---|---|---|---|---|---|
| 1 | BTC | $67,291 | -0.73% | $967.3M | $68,232 | $66,547 |
| 2 | USDC | $1.00 | 0.00% | $478.3M | $1.00 | $1.00 |
| 3 | ETH | $1,953 | -1.50% | $432.0M | $1,995 | $1,930 |
| 4 | SOL | $83 | -1.67% | $127.0M | $84.91 | $81.74 |
| 5 | XRP | $1.36 | -0.58% | $70.1M | $1.37 | $1.34 |
| 6 | DOGE | $0.089 | -1.45% | $44.6M | $0.091 | $0.089 |
| 7 | USD1 | $1.00 | 0.00% | $44.4M | $1.00 | $1.00 |
| 8 | BNB | $619 | -1.35% | $41.9M | $630 | $614 |
| 9 | OPN | $0.31 | +2.28% | $31.1M | $0.34 | $0.30 |
| 10 | ZEC | $195 | -6.03% | $29.8M | $211 | $192 |
The most striking data points sit at the extremes of the table. Zcash (ZEC) suffered the heaviest single-day loss among volume leaders, plunging 6.03% from a 24-hour high of $211.09 to $195. Meanwhile, OPN was the only gainer in the Binance top 10, posting a 2.28% rise on $31.1 million in volume — a small but notable counter-trend move. USDC's position as the second-highest volume asset, at $478.3 million, underscores the degree to which traders are parking capital in stablecoins rather than deploying it into risk assets.
Over on OKX, the volume picture painted a similar story with two additional warning flags. PI Network (PI) collapsed 14.5% to $0.201 on $28.8 million in volume, continuing its accelerating post-listing decline. Conversely, Tether Gold (XAUT) traded at $5,142.80 with near-zero price change, its $24.3 million in volume reflecting demand for a tokenized safe-haven asset even within crypto markets (Source: OKX, March 8, 2026). The divergence — gold-backed tokens holding steady while altcoins crater — is a textbook flight-to-safety pattern.
For a detailed breakdown of which assets historically outperform during extreme fear episodes, see our recent analysis of the best cryptos to buy during extreme fear.
Why Every Major Crypto Has Negative Funding Rates Right Now
Funding rates are the periodic payments exchanged between long and short traders on perpetual futures contracts, serving as a real-time barometer of leveraged market positioning. When funding rates turn negative, short sellers are paying long holders — a structural signal that the majority of leveraged capital is betting on further price declines. As of March 8, 2026, every single major cryptocurrency tracked on Binance Futures carries a negative funding rate, a condition that is uncommon even in prolonged downtrends (Source: Binance Futures, March 8, 2026).
The most aggressively shorted asset by funding rate is Polkadot (DOT) at -0.0383%, followed by Cardano (ADA) at -0.0245%, Solana (SOL) at -0.0169%, and XRP at -0.0165%. Even Bitcoin, which typically maintains a near-neutral funding rate due to its deep liquidity and institutional market-making, has turned negative at -0.0011%. Ethereum's rate of -0.0088% further confirms that bearish positioning extends across the full market cap spectrum (Source: Binance Futures, March 8, 2026).
Rony Szuster, Head of Research at Mercado Bitcoin, offered context on the contrarian opportunity these conditions may present: "Buying during periods of fear has been more effective than buying during euphoria" (Source: Mercado Bitcoin Research, March 2026). This observation aligns with the historical pattern: universally negative funding rates have frequently coincided with local price bottoms, because the overcrowded short trade becomes vulnerable to a violent squeeze whenever even a modest bullish catalyst appears.
The pain is quantifiable. Across the derivatives market, $334 million in positions were liquidated in the past 24 hours, with the overwhelming majority being long positions that were stopped out as prices slid lower (Source: CoinGlass, March 8, 2026). Compounding the pressure, spot BTC ETF outflows have now reached $7.8 billion since November 2025 — approximately 12% of total AUM — creating persistent, structural selling pressure that has reinforced the negative sentiment loop. For a deeper look at how whale activity is diverging from retail sentiment, see our coverage of whale accumulation during the extreme fear period.
Open Interest and Long/Short Ratios Reveal a Contrarian Divergence
While negative funding rates signal bearish consensus among leveraged traders, the long/short ratios on Binance Futures tell a more nuanced and potentially contradictory story. Retail traders, as measured by the top trader long/short ratio, remain disproportionately long on every major asset — creating a notable divergence with the funding rate data that historically has preceded sharp, directional moves (Source: Binance Futures, March 8, 2026).
| Coin | Funding Rate | Open Interest | Long / Short |
|---|---|---|---|
| BTC | -0.0011% | $5.7B | 66.0% / 34.0% |
| ETH | -0.0088% | $3.9B | 70.5% / 29.5% |
| SOL | -0.0169% | $789.0M | 74.6% / 25.4% |
| XRP | -0.0165% | $366.0M | 72.0% / 28.0% |
| DOGE | -0.0136% | $188.1M | 71.0% / 29.0% |
| BNB | 0.0000% | $314.8M | N/A |
| ADA | -0.0245% | $82.1M | N/A |
| AVAX | -0.0142% | $73.5M | N/A |
| DOT | -0.0383% | $42.6M | N/A |
| LINK | -0.0035% | $74.3M | N/A |
BTC open interest on Binance stands at $5.7 billion across 84,592 BTC in notional value, while ETH open interest totals $3.9 billion and SOL holds $789 million. These are elevated figures relative to current depressed price levels, suggesting that leverage has not been fully unwound despite the extreme fear reading — a condition that leaves the market vulnerable to cascading liquidations in either direction (Source: Binance Futures, March 8, 2026).
The divergence between funding rates and long/short positioning is the most important signal in the data right now. Institutional and algorithmic traders — whose activity is more directly reflected in funding rates — are positioned bearish. But retail traders — reflected in the long/short ratios — remain stubbornly bullish, with SOL showing the most extreme imbalance at 74.6% long versus 25.4% short, a ratio of 2.94:1. ETH's long ratio of 70.5% and XRP's 72.0% tell the same story across the board.
This gap historically resolves in one of two ways: either a sharp liquidation cascade forces retail longs to capitulate — which would push BTC below the $66,547 24-hour low and potentially toward the $65,000 level — or a short squeeze punishes the institutional short consensus and triggers a rapid recovery. With the Federal Reserve's FOMC meeting scheduled for March 17–18 (rates currently at 3.5%–3.75%, with markets pricing approximately 2.5% in total cuts for 2026) and 92 crypto ETF applications awaiting SEC decisions with a final deadline of March 27, the catalyst for resolution may arrive within weeks (Source: CME FedWatch, March 2026; Spoted Crypto).