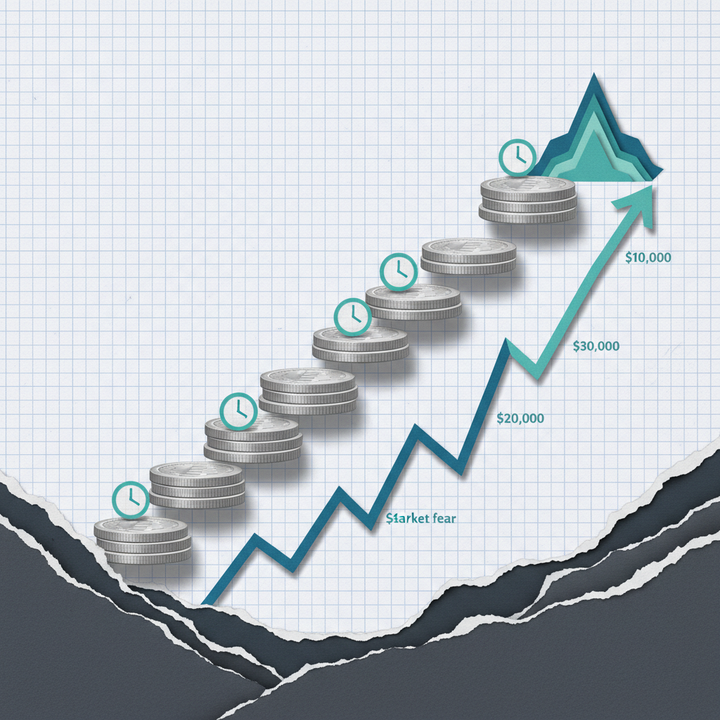
Fear & Greed Index Hits 10 as Bitcoin Surges 7% to $73,000 — Is the $1.7B ETF Inflow a Bottom Signal?
The Fear & Greed Index plunged to 10 — extreme fear — yet Bitcoin surged 7% to $73,000 as institutional investors poured $1.7 billion into spot ETFs. With KOSPI crashing 18% and capital rotating into crypto, is this the capitulation bottom traders have been waiting for?
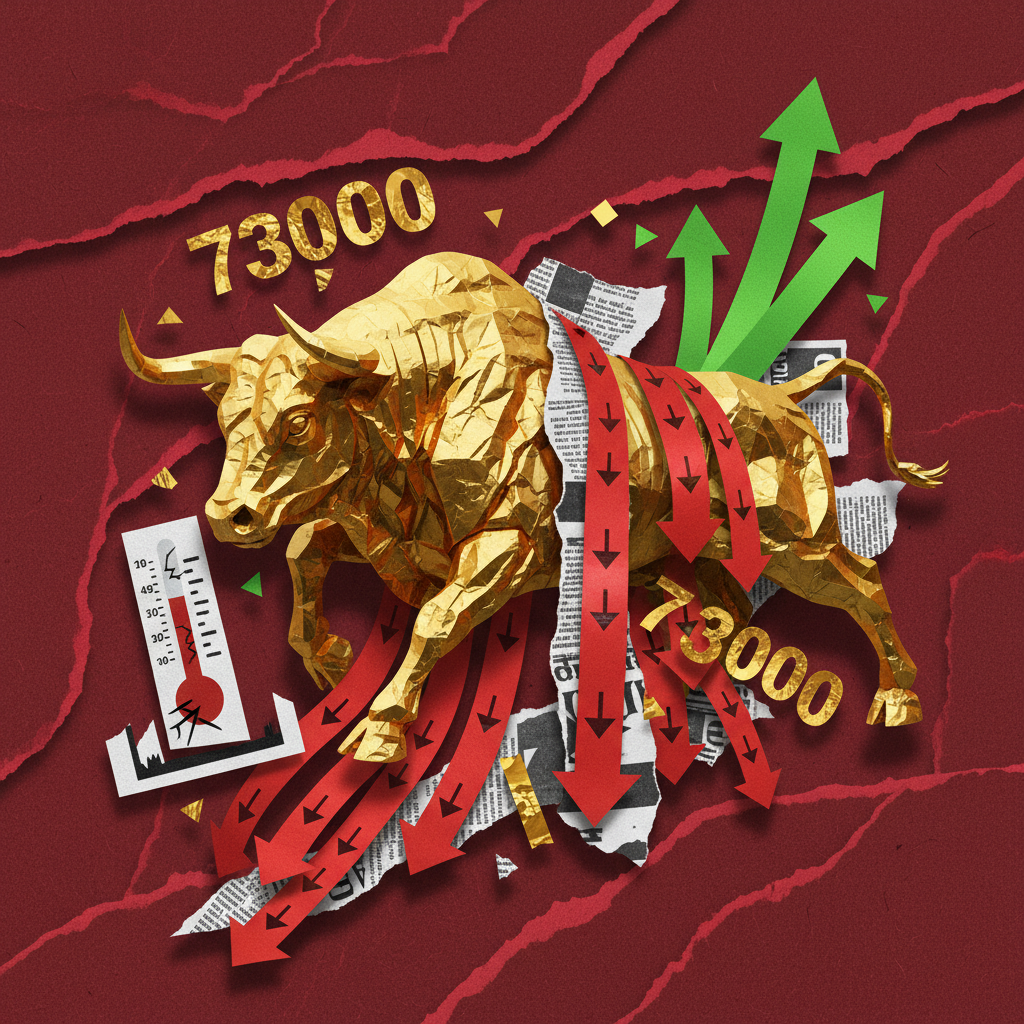
The crypto market just delivered one of its most paradoxical sessions of 2026. While the Fear & Greed Index plunged to 10 — deep into "Extreme Fear" territory — Bitcoin defied the panic with a sharp 7% rally, reclaiming the $73,000 level. Meanwhile, institutional investors poured a staggering $1.7 billion into spot Bitcoin ETFs in a single day, raising a critical question: is this the capitulation bottom that seasoned traders have been waiting for?
Extreme Fear Meets Explosive Rally
The Fear & Greed Index, a widely tracked sentiment gauge that aggregates volatility, volume, social media momentum, and market surveys, dropped to 10 out of 100 on March 5, 2026. That marks a 4-point decline from the previous day and places current sentiment in rarified territory — levels historically associated with major market bottoms.
Yet Bitcoin did the opposite of what fearful sentiment would suggest. BTC surged 6.49% to trade at $72,736 during the Asian session, briefly touching $73,000 before pulling back slightly. Ethereum followed with an even stronger 7.54% gain to $2,133, while Solana and XRP climbed 5.91% and 5.08% respectively.
This divergence between extreme fear in sentiment and aggressive buying in price action is a pattern that crypto veterans recognize. When retail investors panic and institutions step in, it often marks inflection points in market cycles.
Market Snapshot: March 5, 2026
| Asset | Price (USD) | 24h Change | Funding Rate |
|---|---|---|---|
| BTC | $72,736 | +6.49% | 0.0047% |
| ETH | $2,133 | +7.54% | 0.0066% |
| SOL | $91 | +5.91% | 0.0024% |
| XRP | $1.43 | +5.08% | 0.0048% |
| DOGE | — | — | 0.0085% |
The total crypto market capitalization stands at $2.54 trillion, with Bitcoin dominance at 57.4% and Ethereum dominance at 10.1%. The relatively muted funding rates across the board suggest this rally is being driven more by spot buying than leveraged speculation — a healthier foundation for sustained upward movement.
$1.7 Billion ETF Inflow: Institutions Are Buying the Fear
Perhaps the most significant data point of the day is the $1.7 billion in net inflows into U.S. spot Bitcoin ETFs. This is one of the largest single-day inflows recorded since these products launched, and it sends an unmistakable message: institutional money is treating this fear-driven dip as a buying opportunity.
The ETF inflow data contrasts sharply with on-chain metrics showing elevated retail selling. Addresses holding less than 1 BTC have been net distributors for the past two weeks, while whale wallets and ETF custodial addresses have been steadily accumulating. This classic "weak hands to strong hands" transfer is a textbook accumulation pattern.
The timing also coincides with turmoil in traditional markets. The Korean KOSPI index suffered an 18% crash, its worst decline in years, triggering a flight of capital from Asian equities. Some of that displaced capital appears to be rotating into crypto as a non-correlated hedge — a thesis that Bitcoin maximalists have long advocated.
Historical Precedents: What Happens After Fear & Greed Hits 10?
| Date | F&G Score | BTC Price | 30-Day Return | 90-Day Return |
|---|---|---|---|---|
| Jun 2022 | 6 | $17,600 | +18% | -5% |
| Sep 2023 | 11 | $26,200 | +24% | +62% |
| Aug 2024 | 12 | $49,800 | +15% | +41% |
| Mar 2026 | 10 | $72,736 | ? | ? |
History shows a mixed but generally bullish picture. When the Fear & Greed Index has dipped below 12 in previous cycles, Bitcoin has delivered positive 30-day returns in three out of four instances. The September 2023 reading of 11, which preceded a massive rally into the 2024 bull market, is a particularly compelling parallel. However, the June 2022 instance serves as a reminder that extreme fear readings can also occur within prolonged downtrends, where bounces prove temporary.
The key differentiator this time is the presence of institutional ETF demand, which did not exist in 2022 or early 2023. The structural bid from regulated investment products fundamentally changes the supply-demand equation at these price levels.
Funding Rates Signal Spot-Driven Move
One of the healthiest aspects of today's rally is the funding rate picture. Across major perpetual futures contracts on Binance, funding rates remain near neutral: BTC at 0.0047%, ETH at 0.0066%, SOL at 0.0024%. These low positive rates indicate that the rally is not being fueled by aggressive leveraged longs, which tend to create fragile price structures vulnerable to liquidation cascades.
Instead, the combination of spot ETF inflows and moderate funding rates suggests genuine demand is absorbing sell pressure. If funding rates remain subdued while prices continue higher, it would strengthen the case that this is an accumulation-driven bottom rather than a dead cat bounce.
KOSPI Crash and Capital Rotation
The 18% collapse in the Korean KOSPI index has sent shockwaves through Asian financial markets. The crash — triggered by a combination of geopolitical tensions and disappointing corporate earnings — has displaced billions in capital seeking alternative havens. While traditional safe havens like gold and U.S. Treasuries have absorbed some of this flow, the simultaneous spike in crypto buying from Asian time zones suggests a portion of panicked equity investors are diversifying into digital assets.
South Korea has long been one of the most active crypto trading markets in the world, and the "kimchi premium" — the price difference between Korean and global exchanges — has re-emerged at modest levels, indicating fresh domestic demand.
What Traders Should Watch Next
The $75,000 level represents the next major resistance for Bitcoin. A sustained break above this zone with continued ETF inflows would confirm a trend reversal. On the downside, the $68,000–$70,000 range now serves as critical support, with the 200-day moving average providing additional technical backing.
For altcoins, Ethereum's relative outperformance (+7.54% vs BTC's +6.49%) hints at potential rotation into the broader market if risk appetite continues to recover. However, traders should remain cautious — extreme fear readings can persist for days or weeks, and a single green day does not guarantee the bottom is in.
FAQ
What does a Fear & Greed Index score of 10 mean?
A score of 10 out of 100 indicates "Extreme Fear" in the crypto market. The index aggregates data from volatility, trading volume, social media sentiment, market surveys, Bitcoin dominance, and Google Trends. Historically, scores below 15 have often coincided with significant market bottoms, though not always. It signals that the majority of market participants are in panic mode, which contrarian investors view as a potential buying opportunity.
Why did Bitcoin surge despite extreme fear sentiment?
The divergence between bearish sentiment and bullish price action is driven by institutional buying. While retail traders were panic selling, spot Bitcoin ETFs recorded $1.7 billion in net inflows, and large whale addresses were accumulating. This pattern — retail fear combined with institutional buying — is a classic sign of a market bottom forming as assets transfer from weak hands to strong hands.
How do spot Bitcoin ETF inflows affect the price?
Spot Bitcoin ETFs must purchase actual Bitcoin to back their shares. When $1.7 billion flows into these funds, the ETF issuers buy an equivalent amount of BTC on the open market, creating direct buying pressure. Unlike futures-based ETFs, spot products remove real supply from circulation, which can have a magnified effect on price, especially during periods of low liquidity and elevated selling by retail participants.
Is this a good time to buy Bitcoin?
Historical data shows that buying during extreme fear (scores below 15) has generally yielded positive 30- to 90-day returns. However, past performance does not guarantee future results. The presence of $1.7 billion in institutional ETF demand strengthens the bullish case, but macroeconomic risks — including the KOSPI crash and potential contagion — mean volatility could remain elevated. Investors should consider their risk tolerance and avoid investing more than they can afford to lose.