Fear & Greed Index Hits 11: Crypto Market Drowns in Extreme Fear — February 28 Recap
Fear & Greed Index plunges to 11. Total market cap $2.28T, BTC down 3.2%, negative funding rates across the board, and gold-backed PAXG surges 5.5% as flight to safety intensifies.
Quick Answer: The Crypto Fear & Greed Index plunged to 11/100 on February 28, 2026 — deep into Extreme Fear territory. Total crypto market cap stands at $2.28 trillion with BTC dominance at 56%. Every major altcoin is bleeding red while gold-backed PAXG surged 5.5%, and funding rates have turned negative across the board on Binance futures.
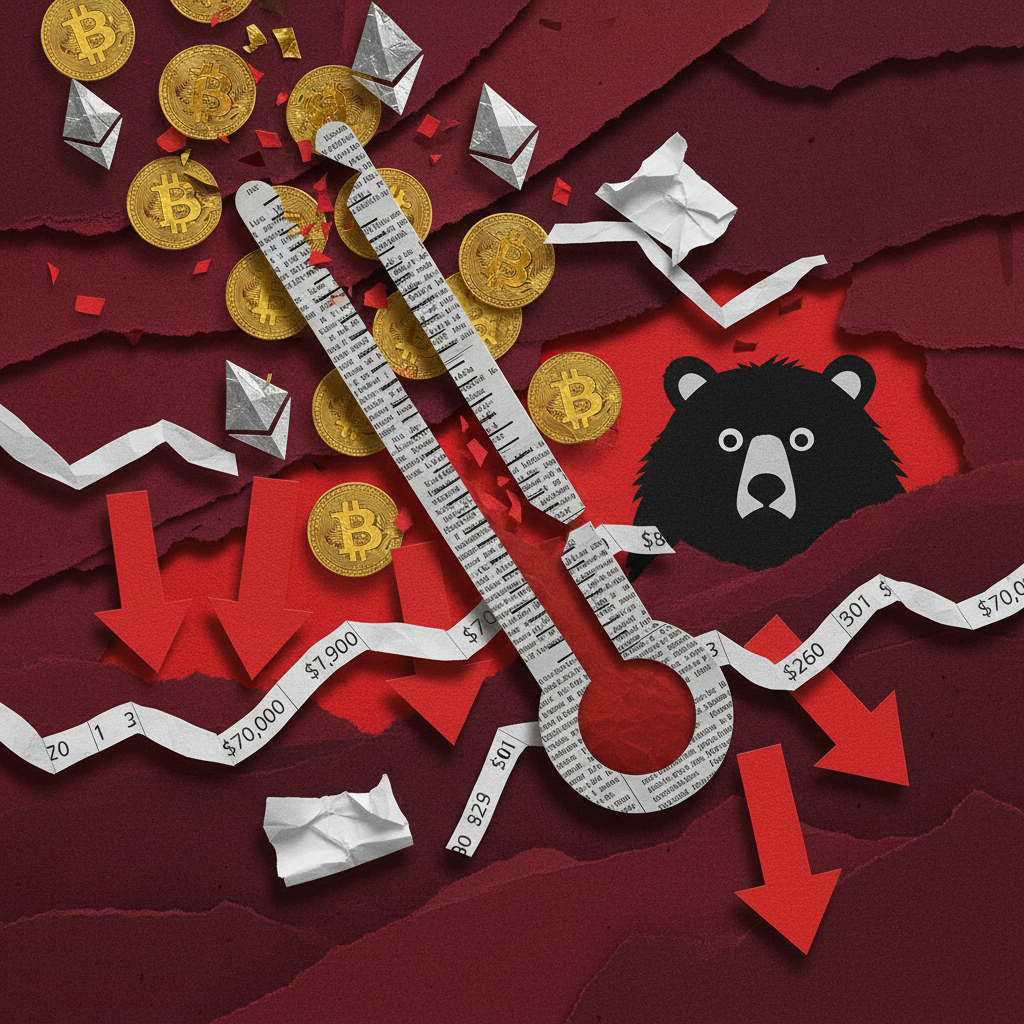
The crypto market just recorded its most fearful reading since the FTX collapse. On February 28, the Fear & Greed Index dropped to 11/100, down 2 points from yesterday's already depressed reading of 13. With total market capitalization at $2.28 trillion, Bitcoin dominance climbing to 56.0%, and every major altcoin posting losses between 3% and 9%, this is a market gripped by genuine panic.
But the numbers tell a more nuanced story than raw fear. On Binance, USDC claimed the second-highest trading volume at $1.0 billion, while gold-backed token PAXG surged 5.46% to $5,488 — clear evidence of a flight to safety. Funding rates across every major perpetual contract have turned negative, meaning short sellers are now paying longs. As Nestree's latest market analysis details, these are textbook capitulation signals that historically precede significant reversals. Let's break down every critical data point.
Key Takeaways
- Fear & Greed Index at 11/100 — Extreme Fear, down 2 points from yesterday's 13 (Source: Alternative.me, 2026-02-28)
- Total crypto market cap $2.28T, BTC dominance 56.0%, ETH dominance collapsed below 10% to 9.9%
- BTC at $63,899 (-3.24%), ETH at $1,865 (-4.93%), SOL at $79 (-5.26%), XRP at $1.29 (-6.31%)
- PAXG (gold-backed) surged +5.46% to $5,488 — only major gainer on Binance
- USDC trading volume hit $1.0B (Binance #2) — stablecoin demand exploding
- ALL funding rates negative on Binance futures: SOL -0.020%, XRP -0.020%, ETH -0.010%, BTC -0.004%
- Retail longs remain stubbornly high: SOL 74.5% long, ETH 71.0% long — potential liquidation risk
- SUI worst performer at -8.95%, DOGE -6.35% as meme coins continue to bleed
What Does a Fear & Greed Index of 11 Actually Mean?
The Crypto Fear & Greed Index is a composite sentiment indicator that measures market psychology on a scale of 0 to 100. It aggregates six weighted factors — volatility (25%), market momentum and volume (25%), social media sentiment (15%), surveys (15%), Bitcoin dominance (10%), and Google Trends data (10%) — to produce a single score that captures the emotional temperature of the market. A reading of 0 represents maximum fear; 100 represents maximum greed. At 11/100 on February 28, 2026, this index has entered territory seen only a handful of times in crypto history, signaling that market participants are in a state of extreme psychological distress that typically coincides with capitulation-level selling (Source: Alternative.me, 2026-02-28).
To put a reading of 11 in historical context: the index hit 8 during the March 2020 COVID crash, 6 during the June 2022 Terra-Luna aftermath, and 10 immediately following the FTX collapse in November 2022. What happened next is instructive. After the COVID bottom (index at 8), Bitcoin rallied approximately 170% within three months. After the Terra-Luna panic (index at 6), BTC recovered over 25% in the following month before resuming its downtrend. The pattern isn't guaranteed — extreme fear doesn't always mark the exact bottom — but historically, single-digit and low-double-digit readings have preceded meaningful bounces.
Warren Buffett's timeless maxim — "Be fearful when others are greedy, and greedy when others are fearful" — resonates powerfully at moments like this. However, contrarian investing requires more than a single sentiment indicator. As we'll explore below, the derivatives data, volume flows, and macro backdrop all contribute to a more complete picture. For investors looking to gauge community sentiment in real time, Vote.Token offers a decentralized polling platform where traders can share and compare their market outlook.
| Metric | Value | Notes |
|---|---|---|
| Total Market Cap | $2.28T | 18,707 active cryptos tracked |
| 24h Total Volume | $112.4B | Elevated sell-side volume |
| BTC Dominance | 56.0% | Rising — bearish for altcoins |
| ETH Dominance | 9.9% | Dropped below 10% — weakest in years |
| Fear & Greed Index | 11/100 | Extreme Fear (prev: 13) |
| BTC 24h Range | $63,030 – $66,345 | ~5.3% intraday swing |
| ETH 24h Range | $1,835 – $1,969 | ~7.3% intraday swing |
Binance and OKX Volume Rankings — Where Is the Money Flowing?
Spot trading volume on the world's two largest exchanges reveals a market in defensive mode. As of February 28, 21:12 KST, Bitcoin led Binance with $1.47 billion in 24-hour volume despite falling 3.24% to $63,899. But the second-highest volume belongs to USDC at $1.0 billion — a stablecoin. When stablecoins rank this high in volume charts, it means traders are actively converting risk assets into dollar-pegged safe havens. This is the crypto equivalent of investors piling into Treasury bills during a stock market sell-off. The pattern is consistent across both exchanges: on OKX, BTC led with $647 million in volume followed by ETH at $347 million, while gold-backed XAUT claimed third place at $110.6 million with a 2.69% gain (Source: Binance and OKX, 2026-02-28).
The standout performer on Binance is PAXG, the gold-backed token, which surged 5.46% to $5,488 on $248.6 million in volume — making it the sixth most-traded asset on the exchange. In a market where everything else is bleeding, a gold proxy rallying to sixth place in volume rankings screams flight to safety. This mirrors what happened during previous extreme fear episodes: in March 2020 and November 2022, gold and gold-pegged assets outperformed as crypto investors sought non-correlated stores of value.
Among altcoins, the damage is widespread. Ethereum dropped 4.93% to $1,865, Solana fell 5.26% to $79, and XRP declined 6.31% to $1.29. The worst hit among the top 10 is SUI, which cratered 8.95% to $0.84. DOGE fell 6.35% to $0.089, confirming that speculative meme coins are being hit hardest in this risk-off environment. For those needing to rebalance portfolios across chains during volatile conditions, Nestree Bridge provides secure cross-chain asset transfers.
| # | Coin | Price | 24h Change | Volume(24h) | High | Low |
|---|---|---|---|---|---|---|
| 1 | BTC | $63,899 | -3.24% | $1.5B | $66,344.90 | $63,030.00 |
| 2 | USDC | $1.00 | +0.00% | $1.0B | $1.00 | $1.00 |
| 3 | ETH | $1,865 | -4.93% | $835.1M | $1,969.00 | $1,835.36 |
| 4 | SOL | $79 | -5.26% | $358.4M | $83.65 | $77.12 |
| 5 | XRP | $1.29 | -6.31% | $307.4M | $1.39 | $1.27 |
| 6 | PAXG | $5,488 | +5.46% | $248.6M | $5,600.00 | $5,198.19 |
| 7 | USD1 | $1.00 | -0.05% | $155.1M | $1.00 | $1.00 |
| 8 | DOGE | $0.089 | -6.35% | $96.3M | $0.096 | $0.088 |
| 9 | BNB | $596 | -3.10% | $96.2M | $616.85 | $588.64 |
| 10 | SUI | $0.84 | -8.95% | $58.8M | $0.92 | $0.83 |
Derivatives Data: Funding Rates, Open Interest, and the Liquidation Risk
Binance perpetual futures data paints a picture of a market under severe bearish pressure — but with a dangerous twist. Funding rates across every major perpetual contract except BNB have turned negative, meaning short sellers are dominant enough to pay long holders a premium. Bitcoin's funding rate stands at -0.0037%, Ethereum at -0.0095%, and Solana at a deeply negative -0.0201%. XRP matches Solana at -0.0204%. These universally negative funding rates are a clear signal that the derivatives market is positioned for further downside. They also indicate that the sell-off is not just spot-driven but is being amplified by leveraged short positions in the futures market (Source: Binance Futures, 2026-02-28).
However, the long/short ratios reveal an alarming disconnect. Despite overwhelmingly negative funding rates, retail traders on Binance remain stubbornly long. Solana's long/short ratio sits at 74.5% long vs. 25.5% short (ratio: 2.92), Ethereum at 71.0% long vs. 29.0% short (ratio: 2.44), and Bitcoin at 68.3% long vs. 31.7% short (ratio: 2.16). This creates a dangerous setup: if prices continue to fall, these overleveraged long positions face liquidation cascades that could amplify the sell-off dramatically. Open interest remains substantial — BTC at $5.1 billion, ETH at $3.4 billion, and SOL at $819 million — meaning there is significant fuel for volatility in either direction.
Veteran trader and BitMEX co-founder Arthur Hayes has repeatedly noted that "the market moves to cause maximum pain to the maximum number of participants." With retail overwhelmingly positioned long while funding rates scream bearish, the setup is ripe for a volatility event. On the other hand, if a catalyst triggers short covering, the negative funding environment could fuel a violent upward squeeze. This is precisely the type of market condition where leveraged positions carry outsized risk. The Nestree ecosystem continues to provide in-depth derivatives analysis and risk management resources for navigating these conditions.
| Coin | Funding Rate | Open Interest | Long/Short |
|---|---|---|---|
| BTC | -0.0037% | $5.1B | 68.3% / 31.7% |
| ETH | -0.0095% | $3.4B | 71.0% / 29.0% |
| SOL | -0.0201% | $819.2M | 74.5% / 25.5% |
| XRP | -0.0204% | $368.4M | 69.0% / 31.0% |
| DOGE | -0.0105% | $151.8M | 66.5% / 33.5% |
| BNB | 0.0000% | $290.8M | N/A |
| ADA | +0.0006% | $83.9M | N/A |
| AVAX | -0.0036% | $69.0M | N/A |
| LINK | -0.0017% | $72.1M | N/A |
| DOT | -0.0022% | $47.8M | N/A |
Gold Tokens Surge While Crypto Bleeds — The Flight to Safety
Perhaps the most telling data point of February 28 is not which crypto assets fell, but which ones rose. PAXG — the Paxos-issued gold-backed token that tracks the price of physical gold — surged 5.46% to $5,488 on Binance with a 24-hour high of $5,600 and volume of $248.6 million. On OKX, the Tether Gold token (XAUT) gained 2.69% on $110.6 million in volume, ranking third overall. The combined gold-token volume across both exchanges exceeded $359 million in a single day. When gold-pegged assets rank among the top traded tokens on crypto-native exchanges, it signals that even crypto-native traders — not just traditional investors — are seeking non-correlated safe havens within the digital asset ecosystem (Source: Binance and OKX, 2026-02-28).
This behavior mirrors patterns seen during the 2022 bear market. As Bloomberg senior commodity strategist Mike McGlone observed in a November 2022 analysis, "Gold and gold-proxied tokens tend to see disproportionate inflows during crypto capitulation events, serving as a psychological bridge for traders unwilling to fully exit the digital ecosystem." The current data validates this thesis. Stablecoins (USDC at $1.0B volume, USD1 at $155.1M) and gold tokens are absorbing capital fleeing from risk assets, creating a two-tier market: safe havens rallying while everything speculative falls.
The implications are significant. When flight-to-safety flows are this pronounced, it typically means we're in the late stages of a fear cycle rather than the beginning. Panic sellers have already acted; what remains is a market searching for a floor. More insights on portfolio diversification strategies during high-volatility periods can be found through Nestree's research hub.
Outlook and Scenario Analysis
With the Fear & Greed Index at 11, total market capitalization at $2.28 trillion, and BTC dominance at 56.0%, the market sits at an inflection point that could resolve in sharply different directions depending on macro catalysts and derivatives positioning. The universally negative funding rates, combined with retail's stubbornly bullish long/short ratios, create a powder keg that could ignite in either direction. Historical precedent offers some guidance but no guarantees — each extreme fear episode has unique macro conditions that determine whether the bottom arrives swiftly or drags on for weeks. Below we analyze two primary scenarios for the next 30 days (Source: CoinMarketCap global data, Binance futures, 2026-02-28).
Bullish Scenario (1-month horizon): The Fear & Greed Index drops into single digits (below 10), triggering a capitulation flush that clears remaining leveraged positions. Short covering begins as negative funding rates become unsustainable, forcing a violent squeeze that mirrors the March 2020 pattern. In that episode, BTC rallied approximately 170% within three months of the index bottoming at 8. If institutional inflows return — potentially catalyzed by positive regulatory developments or macroeconomic easing — total market cap could recover to the $2.5T–$2.7T range. BTC would target the $70,000–$74,000 zone, and the Fear & Greed Index would normalize to 25–35. The key trigger: daily spot volume exceeding $150B combined with funding rates flipping positive.
Bearish Scenario (1-month horizon): Persistent macro headwinds (continued rate hike concerns, regulatory crackdowns, geopolitical escalation) keep fear elevated for weeks. The current retail long bias (SOL 74.5%, ETH 71.0%) triggers cascading liquidations, pushing total market cap below $2.0T. BTC dominance climbs above 58% as altcoin capitulation accelerates. ETH could test $1,600, SOL could revisit $60, and meme coins like DOGE could lose another 30–40%. In this scenario, the Fear & Greed Index would likely touch 5–8 before a true bottom forms.
Key Levels Every Investor Should Watch
- Fear & Greed below 10: Single-digit readings have historically preceded major multi-month reversals — monitor daily
- BTC $63,030 support: Today's 24h low on Binance. A break below could trigger stop-loss cascades toward $60,000
- ETH $1,835 support: Today's 24h low. ETH dominance below 10% signals extreme altcoin distress
- SOL long/short ratio: At 74.5% long (ratio 2.92), SOL carries the highest liquidation risk among majors. Watch for cascading longs
- Funding rate reversal: When BTC and ETH funding rates flip positive, it signals bearish exhaustion and potential trend shift
- PAXG volume decline: When gold-token volume drops below $100M daily, it suggests fear is subsiding and risk appetite is returning
- BTC dominance 58% threshold: A break above signals further altcoin pain ahead — the key leading indicator for alt season or alt winter
- Dollar-cost averaging (DCA): In extreme fear zones, spreading buys over 2–4 weeks historically outperforms lump-sum entries. Size positions conservatively
In an environment like this, emotional discipline is everything. Avoid leveraged positions, resist panic selling if you're already positioned, and let data guide decisions rather than fear. No amount of unrealized loss is worse than a leveraged liquidation.
For deeper chart analysis and real-time trading insights during this volatile period, explore Nestree's premium analysis for expert-level market intelligence.
Frequently Asked Questions
Should I buy crypto when the Fear & Greed Index is at 11?
No single indicator should dictate buy or sell decisions. However, historically, readings below 15 on the Fear & Greed Index have often coincided with strong medium-to-long-term buying opportunities. After the March 2020 reading of 8, Bitcoin rallied approximately 170% within three months. If you're considering entering the market, a dollar-cost averaging strategy spread over 2–4 weeks reduces timing risk. Always combine the Fear & Greed Index with volume trends, funding rates, on-chain data, and macroeconomic context before making decisions.
Why are funding rates negative, and what does it mean?
Negative funding rates on perpetual futures contracts mean that short sellers are paying long holders a periodic fee. This occurs when there is more demand for short positions than long positions in the futures market. On February 28, Binance funding rates were negative for 8 out of 10 tracked assets, with SOL at -0.020% and XRP at -0.020% being the most negative. This signals overwhelming bearish sentiment in the derivatives market. However, it also creates a contrarian setup: if a catalyst triggers buying, short sellers must cover their positions, which can amplify upward moves.
What does it mean that gold-backed tokens are surging?
When tokens like PAXG (+5.46%) and XAUT (+2.69%) surge while the rest of the crypto market falls, it indicates a classic flight to safety. Crypto traders are not exiting the ecosystem entirely — they're rotating capital from risk assets into gold-pegged tokens that provide exposure to a traditionally safe-haven asset within the crypto infrastructure. This pattern has been observed during every major fear event since 2020 and typically indicates late-stage panic rather than the beginning of a downturn.
Is the SOL long/short ratio of 74.5% long dangerous?
Yes, it represents significant risk. A 74.5% long ratio (2.92:1) means nearly three quarters of retail futures traders are positioned for SOL to go up — despite SOL falling 5.26% in the past 24 hours. This creates a setup for cascading liquidations: if SOL drops further, overleveraged long positions get forcefully closed, which creates additional sell pressure that triggers more liquidations. Combined with SOL's deeply negative funding rate of -0.020%, this is one of the highest-risk positions in the current market. Exercise extreme caution with SOL leverage.
Sources
- Binance spot and futures market data, 2026-02-28 21:12 KST
- OKX spot market data, 2026-02-28 21:12 KST
- Alternative.me Fear & Greed Index, 2026-02-28
- CoinMarketCap Global Market Data, 2026-02-28
This article is for informational purposes only and does not constitute investment advice. All investment decisions should be made based on your own judgment and at your own risk. Cryptocurrency investments carry the risk of total loss of principal — never invest more than you can afford to lose.