Crypto DCA Strategy Guide 2026 — Why a Fear Index of 11 Could Be the Best Time to Start Buying
With the Fear & Greed Index at 11 and Bitcoin's weekly RSI at its most oversold level in history, historical data shows DCA entries during extreme fear have returned 150–200% within 12 months. A complete 5-step DCA framework for 2026.

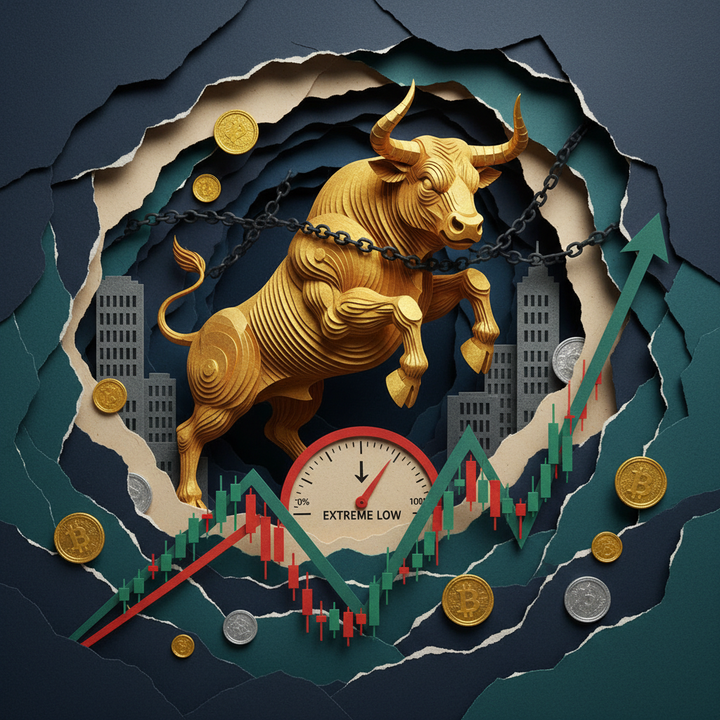
Every crypto investor knows the feeling: the market is in freefall, the Fear & Greed Index is deep in "Extreme Fear" territory, and every instinct screams to either panic sell or stay frozen on the sidelines.
The problem with both reactions is identical — they guarantee you miss the recovery. Investors who sold in fear during the FTX collapse in November 2022 watched from the sidelines as Bitcoin rallied approximately 597% from its $15,500 low to $108,000 by January 2025. As of February 26, 2026, at 10:00 KST, the Fear & Greed Index sits at 11 — deep in Extreme Fear — while Bitcoin's weekly RSI has plunged to 25.7, the most oversold reading in the asset's entire history (source: CoinTelegraph, 2026-02-25). The question isn't whether this fear is justified. The question is whether there's a strategy that turns panic into profit without requiring you to time the exact bottom.
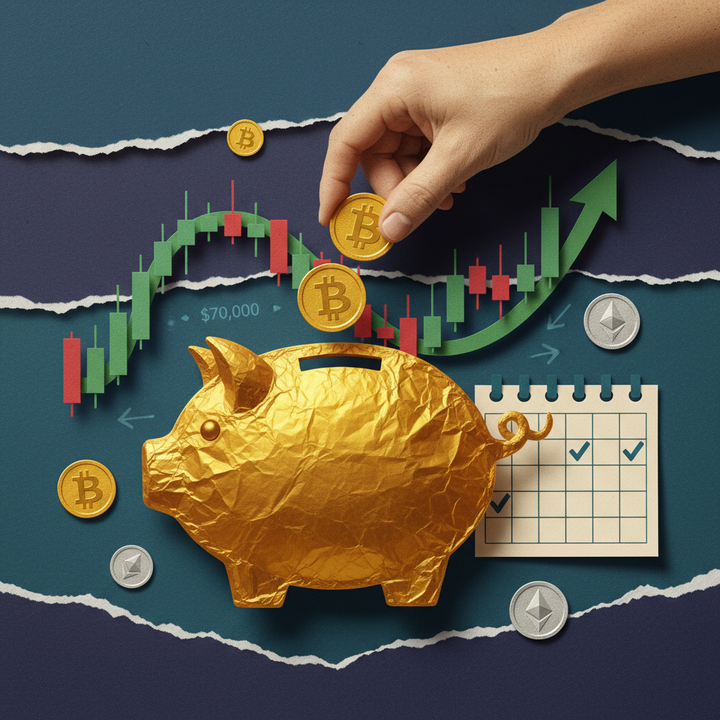
That strategy is DCA — Dollar Cost Averaging. By investing a fixed amount at regular intervals regardless of price, you systematically buy more when prices are low and less when prices are high, automatically driving your average cost below the market average. In this guide, we'll break down the historical evidence, walk through a 5-step DCA framework, compare exchange fees, and build an optimal portfolio allocation — all backed by real data from what may be the single best DCA entry point in Bitcoin's history.
What Is DCA and Why Does It Work Best in Crypto?
Quick Answer: Dollar Cost Averaging (DCA) means investing a fixed dollar amount into crypto on a regular schedule — weekly, biweekly, or monthly — regardless of price. During extreme fear periods (index below 10), investors who started DCA historically earned 150–200% returns within 12 months, outperforming lump-sum investing by 33 percentage points.
Dollar Cost Averaging is an investment strategy where you commit a fixed dollar amount to purchasing a cryptocurrency at regular, predetermined intervals — whether daily, weekly, or monthly. For example, you might buy $100 worth of Bitcoin every Monday morning, automatically, without checking the price. The core mechanism is elegantly simple: when prices are high, your fixed dollar amount buys fewer coins; when prices crash, that same amount buys significantly more. Over time, this mathematically pulls your average purchase price below the market's average price. According to backtesting data from dcabtc.com, an investor who DCA'd $100 weekly into Bitcoin from 2018 through 2025 accumulated 14.36% more BTC by executing purchases on Mondays compared to other days of the week. This isn't theory — it's empirical evidence spanning seven years of the most volatile asset class in modern finance.
While DCA is a time-tested strategy in traditional stock markets, it carries a unique advantage in crypto for three specific reasons. First, annual volatility in crypto markets ranges from 50% to 80%, making lump-sum timing risk extraordinarily high. Second, crypto markets trade 24/7/365, making the idea of finding the "perfect entry" functionally impossible. Third, DCA automates the buying process, eliminating emotional decisions driven by FOMO during rallies or panic during crashes. Warren Buffett's famous maxim — "Be greedy when others are fearful" — perfectly describes what a DCA investor does automatically. While others freeze or flee during extreme fear, the DCA investor's system keeps buying, week after week, at lower and lower prices.
What Happens When You Start DCA During Extreme Fear? — Historical Returns
Quick Answer: Every time the Fear & Greed Index has dropped below 10, Bitcoin subsequently rallied over 500% from its low. DCA investors during the 2022 extreme fear period earned 192.47% returns — beating lump-sum investors by 33 percentage points (source: dcabtc.com).
The historical returns from starting DCA during extreme fear are among the most compelling data points in all of crypto investing. According to historical analysis from Alternative.me, investors who began DCA when the Fear & Greed Index fell below 10 earned average returns of 150–200% over the subsequent 12 months. The 2022 extreme fear window provides the most recent case study: investors who executed a $100 monthly DCA through the Luna/3AC collapse (June 2022) and FTX bankruptcy (November 2022) achieved a 192.47% return, with their average cost basis landing 15.2% below the market average (source: dcabtc.com). In contrast, investors who deployed the same total amount as a lump sum during that same period earned 33 percentage points less. This performance gap isn't marginal — it represents a fundamental structural advantage of DCA in high-volatility, fear-driven environments where prices remain depressed over extended periods.
| Period | Event | Fear Index Level | BTC Low | Subsequent High | Max Rally from Low |
|---|---|---|---|---|---|
| December 2018 | Crypto Winter | Extreme Fear (<10) | ~$3,200 | $69,000 (Nov 2021) | +2,056% |
| March 2020 | COVID-19 Crash | Extreme Fear (<10) | ~$3,800 | $69,000 (Nov 2021) | +1,716% |
| June 2022 | Luna/3AC Collapse | 6 (Extreme Fear) | ~$17,600 | $108,000 (Jan 2025) | +514% |
| November 2022 | FTX Bankruptcy | Extreme Fear (<15) | ~$15,500 | $108,000 (Jan 2025) | +597% |
| February 2026 | Market Correction | 11 (Extreme Fear) | ~$63,000 | Ongoing | — |
The pattern across every extreme fear episode is unmistakable: after the Fear & Greed Index hit single digits, Bitcoin rallied at least 500% from its low — every single time. The timelines varied — 24 months after the 2018 Crypto Winter, 18 months after the 2022 bear market — but the eventual recovery was absolute. This is precisely where DCA earns its edge. You don't need to call the exact bottom. By accumulating consistently throughout the entire fear window, your average cost naturally gravitates toward the low end of the range.
Galaxy Digital's Head of Research, Alex Thorn, noted in his February 2026 analysis that "Bitcoin's weekly RSI has fallen to approximately 15.6 — this is the most oversold level in Bitcoin's entire history" (source: CoinTelegraph, February 2026). CoinDesk separately reported that Bitcoin's 14-day RSI falling below 30 has only occurred three times in history — and the previous two instances (2015 and 2018) both preceded months of consolidation followed by powerful bull runs (source: CoinDesk, 2026-02-19).
February 2026 Market Snapshot — Are Conditions Optimal for Starting DCA?
Quick Answer: As of February 26, 2026, BTC trades at $68,324 on Binance with a Fear & Greed Index of 11, a weekly RSI of 25.7 (all-time record oversold), and SOPR below 1 — signaling capitulation selling. These indicators collectively match every previous optimal DCA entry point in Bitcoin's history.
As of February 26, 2026, at 10:00 KST, the global crypto market has a total capitalization of $2.43 trillion, with BTC dominance at 56.2% and ETH dominance at 10.2% (source: CoinGecko). The Fear & Greed Index sits at 11 — deep within Extreme Fear territory — and briefly plunged to an all-time low of 5 on February 6, 2026 (source: Alternative.me). Bitcoin's weekly RSI stands at 25.7, the most oversold weekly reading in the asset's history, while the Spent Output Profit Ratio (SOPR) has dropped below 1.0, indicating that the majority of on-chain sellers are realizing losses — a classic capitulation signal (source: The Coin Republic, 2026-02-25). Despite the fear, Bitcoin is showing signs of recovery with a +6.33% move in the last 24 hours on Binance, and Ethereum has surged +11.35%. The combination of these technical indicators aligns precisely with every prior optimal DCA entry window.
| Indicator | Current Value | Interpretation | Historical Context |
|---|---|---|---|
| Fear & Greed Index | 11/100 | Extreme Fear | Sub-10 readings have preceded 150–200% 12-month returns |
| BTC Weekly RSI | 25.7 | Record Oversold | Every prior comparable level was followed by a strong reversal |
| BTC SOPR | <1.0 | Capitulation Zone | Typical signal of a selling climax near market bottoms |
| BTC Dominance | 56.2% | Capital Flight to BTC | Classic late-bear-market pattern |
| BTC Funding Rate | -0.0020% | Slight Short Bias | Negative funding often precedes short squeezes |
| Total Market Cap | $2.43T | Correction Phase | Still 3x above the 2022 bear market low of $0.8T |
Here's a snapshot of the top assets by volume across Binance and OKX, showing the current state of the market:
| # | Coin | Price | 24h Change | Volume(24h) | High | Low |
|---|---|---|---|---|---|---|
| 1 | BTC | $68,324 | +6.33% | $2.1B | $69,988.83 | $64,145.20 |
| 2 | USDC | $1.00 | -0.02% | $1.8B | $1.00 | $1.00 |
| 3 | ETH | $2,062 | +11.35% | $1.4B | $2,148.39 | $1,850.49 |
| 4 | SOL | $89 | +11.87% | $511.2M | $92.10 | $79.11 |
| 5 | XRP | $1.44 | +6.81% | $358.2M | $1.49 | $1.35 |
| 6 | USD1 | $1.00 | -0.02% | $157.9M | $1.00 | $1.00 |
| 7 | DOGE | $0.10 | +10.19% | $153.0M | $0.11 | $0.09 |
| 8 | BNB | $630 | +7.79% | $138.5M | $640.55 | $583.82 |
| 9 | ADA | $0.30 | +14.09% | $98.0M | $0.31 | $0.26 |
| 10 | AVAX | $9.52 | +14.29% | $80.7M | $9.84 | $8.32 |
The derivatives market reveals additional context. On Binance Futures, BTC's funding rate is -0.0020%, reflecting a slight bearish lean among leveraged traders — a condition that often precedes short squeezes. Total BTC open interest stands at $5.5 billion, with longs holding 60.5% versus 39.5% shorts (ratio: 1.53). Ethereum futures show $3.9 billion in open interest with a 58.7%/41.3% long-short split. Notably, XRP traders are the most aggressively long at 68.3%, while SOL longs sit at 66.2% — suggesting that leveraged traders are already positioning for a recovery.
| Coin | Funding Rate | Open Interest | Long/Short |
|---|---|---|---|
| BTC | -0.0020% | $5.5B | 60.5% / 39.5% |
| ETH | 0.0078% | $3.9B | 58.7% / 41.3% |
| SOL | 0.0100% | $911.0M | 66.2% / 33.8% |
| XRP | 0.0100% | $405.4M | 68.3% / 31.7% |
| DOGE | 0.0100% | $168.2M | 66.4% / 33.6% |
| BNB | 0.0000% | $319.7M | N/A |
| ADA | 0.0100% | $102.6M | N/A |
| AVAX | 0.0100% | $84.8M | N/A |
On OKX, BTC trades at $68,332 with $922M in 24-hour volume, while ETH commands $733M in volume at $2,062.61. Solana is the standout mover at $88.63 on OKX, closely tracking Binance's $88.61 price. The cross-exchange price convergence across Binance and OKX confirms strong, consistent global pricing — a healthy sign during periods of market stress, and one that benefits DCA investors by ensuring reliable execution regardless of which platform they use.
The 5-Step DCA Playbook: A Practical Framework for 2026
Quick Answer: The optimal DCA setup in extreme fear involves five steps: set your budget (never more than you can afford to lose), choose a weekly schedule (Mondays are statistically best), allocate 60% BTC / 25% ETH / 15% large-cap alts, automate your buys on an exchange, and rebalance quarterly.
Executing a DCA strategy is far simpler than the theory behind it. The key is to set up a system that removes emotion from the equation entirely — your buys happen automatically, on schedule, regardless of whether Bitcoin just dropped 10% or rallied 15%. Below is a 5-step framework designed for the current extreme fear environment, applicable to investors using any major global exchange. During periods of extreme fear like the current market, the single most important principle is this: commit only 30–50% of your total investable capital to DCA. Keep the remainder in cash reserves. If the market falls further, you'll have dry powder to increase your DCA amount or deploy lump-sum buys at even lower prices. Here's the step-by-step process.
Step 1: Define Your Budget
Calculate your monthly disposable income after all essential expenses — rent, food, debt payments, and a 3–6 month emergency fund — are covered. Allocate only 10–30% of your remaining investable capital to crypto DCA. For example, if you have $1,000 per month available for investing, commit $100–$300 to your crypto DCA. During extreme fear periods, you can modestly increase this allocation, but never invest funds you might need within the next 12 months. If $68,324 Bitcoin drops to $50,000, you need to be financially comfortable continuing your DCA — not forced to sell at a loss.
Step 2: Choose Your Frequency
DCA frequency options are daily, weekly, biweekly, or monthly. Backtesting data from dcabtc.com across 2018–2025 reveals that weekly DCA executed on Mondays produced 14.36% more BTC accumulation than other intervals and days. During extreme fear conditions, weekly or biweekly DCA is optimal: the wider price swings create greater cost-averaging benefits as you capture more variation in purchase prices. Monthly DCA works but is less effective at exploiting volatility.
Step 3: Select Your Assets and Allocation
During extreme fear, portfolio construction differs from normal market conditions. The rule is simple: maximize your allocation to the assets most likely to survive and recover. Historically, during extreme bear markets, over 80% of small-cap altcoins never reclaimed their previous all-time highs — while Bitcoin and Ethereum recovered to set new records without exception. Keep BTC and ETH at 85%+ of your DCA allocation. We detail exact percentages in the portfolio section below.
Step 4: Automate Your Purchases
Most major exchanges — Binance, Coinbase, Kraken, OKX, and Bybit — offer recurring buy features. Set your chosen coin, amount, and frequency, and the exchange executes market-price purchases automatically. The goal is zero manual intervention. If you're checking prices before each scheduled buy and debating whether to skip a week, you're doing DCA wrong. The power of the strategy lies in its consistency.
Step 5: Set a Rebalancing Schedule
Every three months, review your portfolio allocation. If any asset deviates more than 5 percentage points from your target — for example, BTC's weight grew from 60% to 70% due to price appreciation — rebalance by shifting the excess into underweight positions. Do not rebalance more frequently than quarterly; transaction costs and tax events add up. Mark your calendar for four specific dates per year and stick to them.
DCA Portfolio Allocation by Market Sentiment
Quick Answer: At a Fear & Greed Index of 11, the recommended DCA allocation is 60% Bitcoin, 25% Ethereum, 15% large-cap altcoins, with 50% of total investable capital held in cash. As the market recovers toward neutral (40–60), gradually increase altcoin exposure to 30% and reduce cash reserves to 20%.
Portfolio allocation during extreme fear must be fundamentally more conservative than during normal markets. With the Fear & Greed Index at 11 as of February 26, 2026, the priority is capital preservation combined with systematic accumulation of the highest-conviction assets. The reasoning is backed by historical survival data: during the 2018 and 2022 bear markets, over 80% of altcoins outside the top 20 by market capitalization failed to recover their previous highs, while Bitcoin and Ethereum both went on to set new all-time records. Your DCA portfolio should reflect this survivorship asymmetry. In the current environment, a 60% BTC / 25% ETH / 15% large-cap altcoin split minimizes downside risk while maintaining exposure to the assets most likely to lead the eventual recovery. Equally important is the cash reserve: keeping 50% of your total investable funds in stablecoins or fiat ensures you can increase DCA amounts if the market drops further.
| Market Sentiment | Fear & Greed Range | BTC Allocation | ETH Allocation | Altcoin Allocation | Cash Reserve |
|---|---|---|---|---|---|
| Extreme Fear | 0–20 | 60% | 25% | 15% | 50% of investable capital |
| Fear | 21–40 | 50% | 25% | 25% | 30% of investable capital |
| Neutral | 41–60 | 40% | 30% | 30% | 20% of investable capital |
| Greed | 61–80 | 50% | 30% | 20% | 40% of investable capital |
| Extreme Greed | 81–100 | Consider pausing DCA | Consider pausing DCA | Consider full exit | 70%+ of investable capital |
At the current Fear & Greed level of 11, a $200/week DCA budget would break down as: $120 in BTC (60%), $50 in ETH (25%), and $30 in a large-cap altcoin such as SOL at $88.61 or ADA at $0.30 (15%). The altcoin slice should target assets with strong fundamentals, active development, and top-20 market-cap status. Based on today's Binance volume data, SOL ($511.2M daily volume, +11.87%) and ADA ($98.0M, +14.09%) meet these criteria.
DCA vs. Lump-Sum: A Direct Comparison
The DCA-versus-lump-sum debate has a clear, data-driven answer in volatile markets. While academic research (notably Vanguard's 2012 study) shows that lump-sum investing outperforms DCA roughly two-thirds of the time in steadily rising stock markets, crypto is not a steadily rising market. The 50–80% annual volatility that characterizes crypto creates an environment where DCA's risk-reduction properties dominate.
| Metric | DCA (Systematic) | Lump Sum |
|---|---|---|
| Return During 2022 Extreme Fear | +192.47% | +159% (33pp lower) |
| Average Cost vs. Market Average | -15.2% below market avg. | Equal to market avg. |
| Psychological Burden | Low (automated) | Very high (timing pressure) |
| Worst-Case Loss | Limited (distributed buys) | Maximum (entire sum at peak) |
| Best Market Fit | Volatile / declining / sideways | Clear sustained uptrend |
The 33 percentage-point advantage DCA held over lump-sum during 2022's extreme fear is not a marginal difference — it's transformative. On a $10,000 total investment, that gap represents $3,300 in additional returns. In the current environment — Fear & Greed at 11, weekly RSI at record lows, SOPR below 1 — the conditions structurally favor DCA over lump-sum.
Strategy (Formerly MicroStrategy): Institutional Proof That DCA Works at Scale
Quick Answer: Strategy (formerly MicroStrategy) has accumulated 717,722 BTC — roughly 3.4% of all Bitcoin ever mined — at an average cost of $66,385 per coin through systematic, repeated purchases since August 2020. It is the largest corporate Bitcoin DCA operation in history.
Strategy, formerly known as MicroStrategy, operates the largest corporate Bitcoin accumulation program ever executed — and it is, at its core, a DCA strategy deployed at institutional scale. Since its first purchase in August 2020, the company has steadily acquired Bitcoin through repeated buys regardless of price, accumulating 717,722 BTC at an average cost basis of approximately $66,385 as of February 23, 2026 (source: strategy.com). This holding represents roughly 3.4% of Bitcoin's total circulating supply. At today's Binance price of $68,324, Strategy's position sits at a modest profit, but the trajectory of the strategy illustrates the DCA principle perfectly: they bought at $10,000, at $30,000, at $60,000, at $100,000, and at every level in between. Michael Saylor, the company's Executive Chairman, has repeatedly stated that "Bitcoin is the ultimate long-term store of value, and we will not stop accumulating" (source: Blockonomi, 2026).
Three lessons from Strategy's approach translate directly to individual investors. First, consistency matters more than timing. Strategy bought Bitcoin at $15,000 and at $100,000 — their average cost of $66,385 reflects the cumulative power of buying at every level. Second, conviction enables patience. The company didn't waver during the 2022 bear market, when its unrealized losses exceeded $1 billion; today those same coins are in profit. Third, systematic funding is non-negotiable. Strategy finances its purchases through equity offerings, convertible notes, and preferred stock — a disciplined capital allocation pipeline. Individual investors must replicate this discipline by earmarking a fixed percentage of income for DCA, treating it as a recurring expense rather than a discretionary decision. In 2025 alone, Strategy deployed $22.4 billion into Bitcoin purchases — proving that DCA is not just a retail strategy, but one that the most aggressive institutional buyer in crypto history has chosen as its primary methodology.
Key Takeaways for Investors
- A Fear Index of 11 is a historical buy signal — but the index briefly hit 5 on February 6, so further downside is possible. This is exactly why systematic DCA — not an all-in lump sum — is the appropriate response.
- BTC weekly RSI at 25.7 is the lowest ever recorded — CoinDesk analysis suggests months of consolidation may follow before a sustained rally, so plan your DCA horizon for a minimum of 6–12 months.
- Weekly DCA on Mondays is statistically optimal — dcabtc.com backtesting across 2018–2025 shows a 14.36% edge in BTC accumulation over other frequencies and days.
- BTC's negative funding rate (-0.0020%) signals caution among leveraged traders — negative funding has historically preceded short squeezes, which can accelerate recoveries and benefit DCA accumulators.
- ETH at $2,062 with +11.35% in 24 hours is showing relative strength — the ETH/BTC ratio is near multi-year lows, making Ethereum DCA particularly attractive on a long-term risk/reward basis.
- Keep 50% of investable capital in cash reserves — if the market drops further, you want the flexibility to increase DCA amounts or make opportunistic additional purchases.
- Cap altcoin exposure at 15% during extreme fear — over 80% of small-cap altcoins fail to recover previous highs after major bear markets, making BTC and ETH the highest-probability DCA targets.
On the risk side, DCA is not a magic shield. If the market enters a prolonged structural decline driven by regulatory crackdowns or systemic failures, DCA will spread your losses over time but won't prevent them. Exchange hacks, stablecoin depegging events, and smart contract exploits remain risks that no buying strategy can mitigate — which is why you should always distribute holdings between exchange accounts and self-custody hardware wallets. Never invest more than you can afford to lose entirely, and never DCA with funds you might need within the next year.
This article is for informational purposes only and does not constitute investment advice. All investment decisions should be made based on your own judgment and risk tolerance. Cryptocurrency investing carries the risk of total capital loss, and past performance does not guarantee future results.
Frequently Asked Questions
What is DCA (Dollar Cost Averaging) in crypto?
DCA is an investment strategy where you buy a fixed dollar amount of cryptocurrency at regular intervals — daily, weekly, or monthly — regardless of the current price. Instead of trying to time the market, you accumulate consistently over time. When prices are low, your fixed amount buys more coins; when prices are high, it buys fewer. Over time, this automatically pulls your average purchase price below the market average, which is especially powerful in crypto's highly volatile environment.
Does starting DCA during extreme fear actually produce positive returns?
Historical data strongly supports this. According to Alternative.me, investors who began DCA when the Fear & Greed Index dropped below 10 earned average returns of 150–200% over the following 12 months. During the 2022 extreme fear period (Luna/3AC collapse and FTX bankruptcy), DCA investors earned 192.47% — outperforming lump-sum investors by 33 percentage points (source: dcabtc.com). However, past performance is not a guarantee of future results, and further downside is always possible before a recovery materializes.
What is the best DCA portfolio allocation during extreme fear?
During extreme fear (Fear & Greed Index 0–20), a conservative allocation of 60% Bitcoin, 25% Ethereum, and 15% large-cap altcoins is recommended. Equally important: reserve 50% of your total investable funds in cash or stablecoins. This dual approach ensures you're accumulating quality assets at depressed prices while maintaining the flexibility to increase purchases if the market drops further. As sentiment recovers to neutral (40–60), you can gradually shift to 40% BTC, 30% ETH, 30% altcoins with a 20% cash reserve.
How often should I DCA into crypto?
Backtesting data from dcabtc.com spanning 2018–2025 shows that weekly DCA on Mondays produced 14.36% higher BTC accumulation compared to daily, biweekly, or monthly schedules. During extreme fear conditions specifically, weekly or biweekly frequency is optimal because wider price swings create greater cost-averaging benefits. Monthly DCA still works but captures less intra-month volatility, reducing the mathematical advantage of the strategy.
Sources
- Crypto Fear & Greed Index, Alternative.me, accessed 2026-02-26
- Bitcoin's most oversold weekly RSI hints at BTC price rebound, CoinTelegraph, 2026-02-25
- Bitcoin's 14-Day RSI Falls Below 30 for Third Time Ever, CoinDesk, 2026-02-19
- SOPR Drops Below 1 as RSI Hits Record Low, The Coin Republic, 2026-02-25
- Bitcoin DCA Calculator, dcabtc.com
- Bitcoin Purchases, Strategy (formerly MicroStrategy)
- How Michael Saylor Turned Strategy Into the Largest Corporate Bitcoin DCA Operation, Blockonomi, 2026