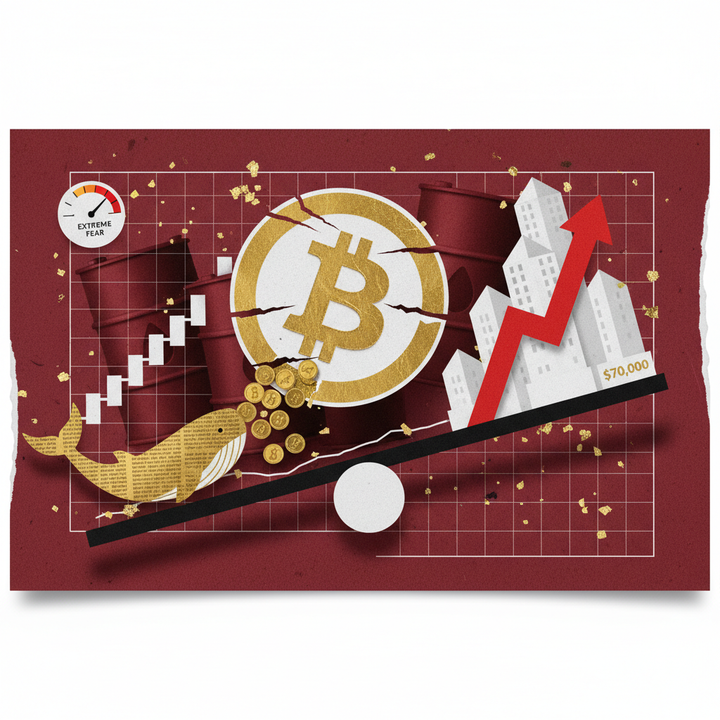
Fear & Greed Index Hits 18: Why Institutions Are Buying $986M in BTC ETFs During Extreme Fear
BTC ETFs pull in $986M despite extreme fear at 18. SEC-CFTC MOU, whale sell-offs, and liquidation data analyzed.
The crypto market is flashing extreme fear signals not seen since the FTX collapse — yet institutional capital continues to pour into Bitcoin ETFs at a remarkable pace. This paradox between retail panic and institutional accumulation defines the March 12, 2026 trading session, and the data below reveals exactly where smart money is positioning.
March 12 Crypto Market Overview: Why Are Institutions Buying During Extreme Fear?
Quick Answer: The Fear & Greed Index reads 18 (Extreme Fear) while Bitcoin trades at $69,407 — a 44.5% drawdown from its $126,210 all-time high. Yet Bitcoin spot ETFs have absorbed $986 million in net inflows this March, the first back-to-back two-week inflow streak in five months, signaling decisive institutional accumulation against prevailing market panic.
The cryptocurrency market on March 12, 2026 sits at a critical inflection point where sentiment and institutional behavior are moving in opposite directions. The Fear & Greed Index reads 18 out of 100 — firmly in “Extreme Fear” territory — while the total crypto market capitalization holds at $2.45 trillion with Bitcoin dominance at 56.8%, according to Alternative.me. Bitcoin trades near $69,407, down 44.5% from its all-time high of $126,210. Yet against this backdrop of widespread panic, Bitcoin spot ETFs have recorded $986 million in net inflows during March, marking the first back-to-back weekly positive flows in five months, per TradingNews. This divergence between retail fear and institutional conviction creates what veteran traders recognize as a classic accumulation pattern — and three key developments from the past 24 hours explain why the smart money is leaning in.
Three Catalysts Behind Institutional Confidence
1. Regulatory Clarity Breakthrough. The SEC and CFTC signed a historic Memorandum of Understanding on March 11, ending decades of jurisdictional turf wars over crypto oversight. The newly launched Joint Harmonization Initiative — co-led by the SEC’s Robert Teply and CFTC’s Meghan Tente — aims to streamline unified crypto regulation in the United States, as reported by CoinDesk. This removes one of the largest structural barriers to institutional entry and could accelerate the regulatory pathway for new crypto investment products across the world’s largest capital market.
2. ETF Inflows Defy the Fear. BlackRock’s IBIT alone captured $185.8 million on March 10, accounting for 75.2% of that session’s total $246.9 million single-day inflow. These are not speculative retail positions — they represent calculated allocations by pension funds, family offices, and wealth managers. Historically, every prior dip below 15 on the Fear & Greed Index has produced positive 90-day returns roughly 80% of the time, as detailed in our analysis of extreme fear as a crypto buy signal.
3. Whale Sell Pressure Tests Support. A single whale deposited 2,500 BTC ($172.6 million) to Binance — coins originally accumulated near $81,000 — triggering a flash dip to $66,975, per AMBCrypto. The Exchange Whale Ratio has surged to 0.64, the highest since 2015, meaning 64% of all exchange BTC inflows come from the top-10 largest deposits, according to AInvest. BTC’s negative funding rate of −0.0078% on Binance confirms that shorts currently dominate the derivatives market, adding further near-term downside pressure.
| Metric | Value | Context |
|---|---|---|
| Total Market Cap | $2.45T | Down from Dec 2025 cycle peak |
| BTC Price | $69,407 | ATH $126,210 (−44.5%) |
| BTC Dominance | 56.8% | Flight-to-quality within crypto |
| Fear & Greed Index | 18 / 100 | Extreme Fear (+3 vs prior day) |
| BTC Spot ETF (Mar) | +$986M net | First 2-week inflow streak in 5 months |
| BTC Funding Rate | −0.0078% | Shorts dominant (bearish positioning) |
| Exchange Whale Ratio | 0.64 | Highest since 2015 — heavy sell-side pressure |
The data paints a clear picture: institutions are buying what retail is selling. Whether this divergence resolves with a sharp recovery — as it has after every previous extreme fear episode, where 12-month returns ranged from +158% to +1,400% — or extends into a prolonged bottoming phase, the next two to four weeks of ETF flow data and on-chain whale activity will prove decisive for Bitcoin’s trajectory.
Exchange Volume Trends and Key Altcoin Movers for March 12
Exchange volume data provides a real-time pulse on market sentiment, and the March 12 session reveals a market firmly in defensive mode. Binance, the world’s largest crypto exchange by volume, recorded $1.81 billion in 24-hour BTC trading volume, while USDC volume surged to $1.53 billion — clear evidence of capital rotating into stablecoins as a risk-off hedge, according to Binance market data. Ethereum posted a modest 0.44% gain to $2,029, while Solana slipped 0.40% to $85 and XRP declined 0.39% to $1.37. The dominance of stablecoin volume, with USDC ranking second overall, signals traders parking capital on the sidelines rather than making directional bets. Total centralized exchange volume fell to $5.61 trillion in February — a 16-month low — with Binance’s market share dropping to 22%, its lowest since 2020, per CoinDesk Research. This contraction reflects broad-based disengagement rather than isolated regional weakness.
| Rank | Asset | Price (USD) | 24h Change | Funding Rate | Signal |
|---|---|---|---|---|---|
| 1 | BTC | $69,407 | −0.17% | −0.0078% | Shorts dominant |
| 2 | USDC | $1.00 | 0.00% | — | Risk-off haven |
| 3 | ETH | $2,029 | +0.44% | +0.0009% | Neutral positioning |
| 4 | SOL | $85 | −0.40% | +0.0046% | Mild long bias |
| 5 | XRP | $1.37 | −0.39% | −0.0012% | Slightly bearish |
Stablecoin Surge and Derivatives Signal Risk-Off Mode
USDC’s position as the second-highest volume asset on Binance is a textbook risk-off signal. When traders rotate out of volatile assets into dollar-pegged stablecoins, it reflects a capital preservation mindset that typically precedes either capitulation selling or a genuine bottoming process. BTC’s 24-hour trading range of $68,978 to $71,321 — a 3.4% spread — shows the market testing support levels without conviction in either direction. ETH’s even tighter range of roughly $2,019 to $2,054, a sub-2% band, further confirms the wait-and-see positioning across altcoins. The derivatives market reinforces this defensive narrative: BTC’s funding rate at −0.0078% indicates short positions are dominant and willing to pay a premium to maintain bearish exposure. ETH’s funding rate is nearly flat at +0.0009%, while SOL’s positive +0.0046% rate suggests mild long positioning — a potential early divergence signal. DOGE’s funding rate of −0.0007% reflects similarly cautious sentiment across the meme coin sector. For traders tracking momentum shifts, these funding rate differentials often provide the earliest reversal clues before spot prices follow.
Regional Market Dynamics: What the Premium Reversal Reveals
One of the most telling structural signals is the reversal of the so-called “Kimchi premium” — the historical price gap between Asian exchanges and global platforms. Bitcoin currently trades at a −0.47% discount on Korean exchanges relative to Binance, with Ethereum showing a similar −0.48% discount, per CryptoSlate. During previous bull markets, this premium routinely reached +5% to +50%, reflecting frenzied retail demand across Asia. The current negative premium mirrors the pattern observed at the 2022 bear market bottom and signals that Asian retail investors remain deeply cautious despite improving institutional fundamentals. Meanwhile, the exchange landscape itself is fragmenting: Bullish exchange surged 62.6% month-over-month to $76 billion in February spot volume, overtaking Coinbase to claim the world’s third-largest position, according to CoinDesk. This redistribution away from Binance’s former 50%+ market dominance toward a more fragmented structure may ultimately prove healthier for the broader ecosystem.
The combination of falling volumes, stablecoin dominance, negative funding rates, and reversed regional premiums builds a consistent picture of a market locked in wait-and-see mode. Bitwise CIO Matt Hougan’s characterization of 2026 as “a U-shaped bottoming year rather than a sharp V-shaped recovery,” per CCN, aligns closely with what the volume and positioning data reveals — patience, not panic, may be the optimal strategy for navigating the months ahead.
Fear & Greed Index at 18 — How Does It Compare to Historic Extreme Fear Levels?
The Crypto Fear & Greed Index currently sits at 18 out of 100, firmly entrenched in “Extreme Fear” territory after plunging to a record low of 5 in February 2026. This metric — which aggregates volatility, market momentum, social media sentiment, and trading volume — reflects a market gripped by the kind of panic rarely seen outside of systemic crises. According to data compiled by Alternative.me, the index has only dipped below 15 on three prior occasions, each time marking a generational buying opportunity. Bitcoin currently trades near $69,400, representing a 44.5% decline from its all-time high of $126,210, per CoinDesk. The total crypto market capitalization has contracted to $2.45 trillion, with BTC dominance holding at 56.8%. While fear dominates retail sentiment, the divergence between emotional extremes and institutional capital flows tells a far more nuanced story worth examining.
Historical Extreme Fear Events and Subsequent Returns
Every instance of the Fear & Greed Index dropping below 15 has produced extraordinary returns for investors willing to buy during peak pessimism. The pattern is remarkably consistent across three distinct market crises spanning six years, as the following table illustrates.
| Event | Date | F&G Index Low | BTC Price at Low | Subsequent Peak | Return | Recovery Period |
|---|---|---|---|---|---|---|
| COVID Black Thursday | March 2020 | 8 | $3,800 | $60,000 | +1,400% | 13 months |
| FTX Collapse | November 2022 | 12 | $15,600 | $126,210 | +710% | ~27 months |
| 2026 Drawdown | February 2026 | 5 | $66,975 | TBD | TBD | Ongoing |
The data reveals a striking probability: when the index has fallen below 15, Bitcoin has delivered positive returns within 90 days approximately 80% of the time, according to analysis by Spoted Crypto. Over a 12-month horizon, the three prior extreme fear episodes produced gains ranging from +158% to +1,400%. The current reading of 18 — while elevated from February’s nadir of 5 — remains firmly within the historical zone that has preceded asymmetric upside. Crucially, the gradual recovery from 5 to 18 mirrors the bottoming pattern observed in both 2020 and 2022, where the index oscillated within extreme fear territory for weeks before a decisive sentiment shift triggered sustained price appreciation. Investors who waited for sentiment to normalize before entering during past cycles consistently captured smaller portions of the subsequent rally.
Expert Outlook: U-Shaped Bottom or Rapid Rebound?
Not all recoveries follow the same trajectory, and leading analysts are split on the pace of the potential rebound. Matt Hougan, Chief Investment Officer at Bitwise Asset Management, urges caution against expecting a swift reversal. “2026 is shaping up to be a U-shaped bottoming year rather than a sharp V-shaped recovery,” Hougan stated, projecting Bitcoin to trade within a $75,000 to $100,000 range through the first half of the year, according to CCN. His view implies months of consolidation before any meaningful breakout — a scenario that favors dollar-cost averaging over aggressive lump-sum entries.
Macroeconomist Henrik Zeberg presents a far more aggressive thesis. He assigns a 75% probability to Bitcoin reaching $110,000 to $120,000 by the end of March, with a 25% chance of an overshoot to $140,000–$150,000. Zeberg cites sustained ETF inflows, deepening institutional demand, and a potential rotation back into risk-on sentiment as primary catalysts, according to BingX News. If correct, his timeline would represent one of the fastest recoveries from extreme fear in Bitcoin’s history.
The gap between Hougan’s cautious $75K–$100K consolidation range and Zeberg’s aggressive $110K–$120K target underscores the deep uncertainty embedded in the current market structure. What both analysts implicitly agree on, however, is that the extreme fear reading itself is not a sell signal — it is a historically proven data point that has consistently rewarded patient, contrarian capital. With BTC funding rates on Binance sitting at -0.0078% and the derivatives market skewing decisively bearish, the sentiment washout appears far from over. For investors tracking market analysis and sentiment indicators, the current setup offers a rare alignment of deeply negative sentiment with accelerating institutional accumulation.
24-Hour Liquidation Data and Whale Movements: What Does the $172M Dump Signal?
Over the past 24 hours, $131.42 million in crypto positions were forcibly liquidated across major derivatives exchanges, with the single largest liquidation — a $2.6 million BTC-USDT short on Bybit — highlighting the violent price swings that continue to whipsaw leveraged traders on both sides of the market. Simultaneously, on-chain data revealed that a whale entity deposited 2,500 BTC worth approximately $172.6 million to Binance for immediate sale, according to AMBCrypto. This whale had originally accumulated the position near $81,000 but capitulated after Bitcoin breached the critical $70,000 support level, crystallizing losses exceeding $27 million on the trade. The Exchange Whale Ratio — which measures the proportion of large deposits relative to total exchange inflows — has surged to 0.64, its highest reading since 2015, per AInvest. This means 64% of all Bitcoin flowing into exchanges now originates from the top 10 largest depositors, a concentrated selling pressure signal that warrants close attention from market participants.
Whale Capitulation Meets Institutional Accumulation
The $172.6 million whale dump represents a textbook case of capitulation — a large holder who built conviction at $81,000 only to panic-sell after an extended drawdown pushed Bitcoin to lows near $66,975. This behavior contrasts sharply with institutional flows, where BTC ETFs absorbed $986 million in cumulative net inflows through March, with BlackRock’s IBIT alone accounting for $185.8 million in a single day on March 10, according to TradingNews. The divergence between whale capitulation and institutional accumulation defines the current market’s central paradox: the biggest individual holders are selling into the very fear that the biggest institutional buyers are exploiting.
The Exchange Whale Ratio at 0.64 deserves particular scrutiny. This metric, which tracks the share of exchange inflows attributable to the top 10 deposits, has not been this elevated since the early days of Bitcoin’s exchange-traded history. When 64% of incoming exchange volume comes from a handful of massive transfers, it indicates that selling pressure is concentrated rather than broadly distributed — a pattern that historically resolves relatively quickly once the largest sellers exhaust their available supply. In previous cycles, whale ratio spikes above 0.50 preceded local price bottoms within two to four weeks.
Han Tan, Chief Market Analyst at Bybit, offered perspective on the broader structural picture. “The drawdown in the hashrate is only to be expected in light of Bitcoin’s price plummet, but does not imply structural capitulation,” Tan stated, according to BeInCrypto. His assessment draws a critical distinction between price-driven operational adjustments among miners and fundamental deterioration of the network’s security infrastructure.
The Dual Structure: Diverging Market Signals
The current market presents a rare dual structure: whale entities and short-term holders are liquidating positions in panic while institutional capital — channeled through regulated ETF products — systematically accumulates on every dip. BTC funding rates on Binance sit at -0.0078%, confirming that the derivatives market is skewed bearish as short sellers pay to maintain positions. This negative funding environment, combined with the extreme fear reading of 18, creates the kind of comprehensive sentiment washout that has historically preceded major trend reversals. The $131.42 million in 24-hour liquidations further underscores how aggressively leveraged positions are being flushed from the system.
For investors monitoring Bitcoin on-chain and derivatives data, the divergence between whale selling and ETF buying represents the defining tension of March 2026. Whether institutional demand can absorb concentrated whale supply will likely determine Bitcoin’s near-term trajectory. The resolution of this tug-of-war — playing out in real time across derivatives, spot markets, and on-chain flows — will set the tone for the remainder of the quarter and could establish the foundation for the next major directional move.
BTC ETF March Net Inflows Hit $986 Million — Where Is Institutional Capital Flowing?
Bitcoin spot ETFs recorded $986 million in net inflows during the first two weeks of March 2026, marking the first back-to-back weekly inflows in five months amid a Fear & Greed Index reading of just 18. This counter-intuitive institutional buying pattern — loading up while retail investors panic — echoes historical accumulation cycles observed during the COVID crash of March 2020 and the FTX collapse of November 2022. On March 10 alone, U.S. spot BTC ETFs absorbed $246.9 million in a single day, with BlackRock's IBIT commanding a dominant 75.2% share at $185.8 million, according to TradingNews. With BTC trading near $69,407 — roughly 44.5% below its all-time high of $126,210 — institutional players appear to be treating the current extreme fear zone as a generational entry point rather than a signal to retreat.
BlackRock IBIT Dominates the ETF Landscape
BlackRock's iShares Bitcoin Trust (IBIT) has cemented its position as the undisputed leader among U.S. spot Bitcoin ETFs. With cumulative net inflows reaching $62.5 billion, IBIT alone accounts for the lion's share of total U.S. spot BTC ETF assets under management, which now stand at $87.07 billion. The fund's single-day inflow of $185.8 million on March 10 represented 75.2% of all ETF inflows that day, underscoring the concentration of institutional demand in a single product. This dominance reflects BlackRock's brand trust among institutional allocators — pension funds, endowments, and registered investment advisors who prefer the liquidity and regulatory clarity of the world's largest asset manager. For investors tracking Bitcoin ETF fund flows, the IBIT concentration signals that institutional capital is not broadly diversifying across ETF issuers but rather consolidating into the most trusted vehicle.
March 9–10 ETF Fund Flow Breakdown
| ETF Ticker | Issuer | Mar 10 Flow (USD) | Share of Daily Inflow | Cumulative AUM |
|---|---|---|---|---|
| IBIT | BlackRock | +$185.8M | 75.2% | $62.5B |
| FBTC | Fidelity | +$34.7M | 14.1% | $12.8B |
| HODL | VanEck | +$14.8M | 6.0% | $1.4B |
| BITB | Bitwise | +$11.6M | 4.7% | $2.1B |
| Total (All U.S. Spot BTC ETFs) | +$246.9M | 100% | $87.07B | |
Source: TradingNews, compiled March 10, 2026
Ripple's $750 Million Buyback and the Institutional XRP Signal
Beyond Bitcoin, institutional appetite is extending into the broader digital asset ecosystem. Ripple launched a $750 million share buyback program at a $50 billion valuation — a 25% increase from its $40 billion valuation just four months prior, according to Bloomberg via Benzinga. Notably, Goldman Sachs now holds $153.8 million in XRP ETF positions, representing 73% of holdings among the top 30 institutional holders. This dual signal — a corporate buyback alongside major bank accumulation — suggests that institutional conviction in digital assets is broadening well beyond Bitcoin during periods of extreme market fear.
Contrarian Institutional Positioning: Fear as Fuel
The current dynamic reveals a stark divergence between retail sentiment and institutional action. While the Fear & Greed Index sits at 18 — a level historically associated with market bottoms — institutions are aggressively deploying capital. BTC funding rates on Binance are negative at -0.0078%, indicating that short sellers are paying longs, a classic sign of over-leveraged bearish positioning. Historically, extreme fear readings below 15 have preceded 90-day positive returns roughly 80% of the time. During the three prior extreme fear episodes — December 2018 (index: 10), March 2020 (index: 8), and November 2022 (index: 12) — BTC delivered returns ranging from +158% to +1,400% within 12 months, according to Spoted Crypto research. Institutions are not ignoring the fear — they are weaponizing it.
SEC and CFTC Sign Historic MOU — How Will U.S. Crypto Regulation Transform?
The U.S. Securities and Exchange Commission (SEC) and the Commodity Futures Trading Commission (CFTC) signed a landmark Memorandum of Understanding on March 11, 2026, ending decades of jurisdictional rivalry over digital asset oversight. The agreement establishes a Joint Harmonization Initiative co-led by SEC's Robert Teply and CFTC's Meghan Tente, creating a unified regulatory framework that could reshape how crypto businesses operate in the world's largest financial market. According to CoinDesk, the initiative aims to eliminate duplicative registration requirements, harmonize enforcement actions, and establish clear classification guidelines for digital assets — a structural shift that institutional investors have demanded as a prerequisite for deeper capital deployment into crypto markets.
Ending Decades of Regulatory Turf Wars
The SEC-CFTC jurisdictional battle has long been the single greatest source of regulatory uncertainty in U.S. crypto markets. Whether a token constitutes a security (SEC jurisdiction) or a commodity (CFTC jurisdiction) has been adjudicated through costly, contradictory enforcement actions rather than clear legislation. SEC Chairman Paul S. Atkins acknowledged this failure directly:
"For decades, regulatory turf wars, duplicative agency registrations, and different sets of regulations between the SEC and CFTC have stifled innovation and pushed market participants to other jurisdictions."
— Paul S. Atkins, SEC Chairman (CoinDesk)
This acknowledgment from the SEC's own chairman represents a tectonic shift in tone. Previous SEC leadership under Gary Gensler pursued an aggressive enforcement-first approach, filing lawsuits against major exchanges and token issuers. The MOU signals a deliberate pivot from regulation-by-enforcement toward a principles-based framework that provides the clarity institutional capital requires.
CFTC's Vision: A "Golden Age" for U.S. Finance
CFTC Chairman Michael S. Selig matched the SEC's conciliatory tone, framing the MOU as a foundational step toward American financial leadership in digital assets. Selig described the agreement as "a commitment to harmonize regulatory frameworks for comprehensive financial market oversight," adding that the initiative could usher in a "Golden Age" for U.S. financial markets, according to CryptoTimes. The Joint Harmonization Initiative will focus on three priorities: establishing a shared token classification taxonomy, creating a single registration portal for crypto businesses operating across both agencies' jurisdictions, and coordinating enforcement to prevent conflicting legal actions against the same entities.
Global Regulatory Momentum Accelerates
The U.S. regulatory breakthrough does not exist in isolation. Across the Atlantic, crypto-friendly fintech Revolut secured a full UK banking license, enabling it to offer FSCS-protected deposits (up to £120,000) to its 13 million UK customers while maintaining crypto trading through a separate entity, according to CoinDesk. Revolut also announced a £3 billion investment in the UK and plans to hire 1,000 new employees. In Europe, the Markets in Crypto-Assets (MiCA) regulation has been fully operational since mid-2025, providing the most comprehensive crypto regulatory framework globally. These parallel developments — the SEC-CFTC MOU, Revolut's UK license, and MiCA's maturation — collectively represent a global convergence toward regulatory clarity. For crypto regulation watchers, this convergence directly addresses the primary barrier institutional allocators have cited for limited exposure: the absence of predictable, transparent rules. With the three largest Western financial markets now moving toward harmonized frameworks, the regulatory prerequisite for the next wave of institutional capital deployment is falling into place.
Exchange Landscape Shift: How Bullish Overtook Coinbase for Third Place
The centralized exchange (CEX) hierarchy is undergoing its most dramatic reshuffling since 2020, with Bullish surging past Coinbase to claim the third-largest spot exchange position globally. Bullish posted $76 billion in spot trading volume for February 2026, a staggering 62.6% month-over-month increase that pushed its market share to 5.06%, eclipsing Coinbase's 4.59%, according to CoinDesk. This shift is occurring against a backdrop of shrinking overall CEX volumes — February's total hit $5.61 trillion, a 16-month low — suggesting that market share gains are being carved from a shrinking pie rather than organic growth. For investors, this fragmentation of exchange dominance signals a maturing market structure where no single platform controls pricing power, potentially improving execution quality and reducing systemic risk across the ecosystem.
Binance's Dominance Erosion: From 50% to 22%
Perhaps the most telling indicator of this structural transformation is Binance's declining grip on the market. The world's largest exchange saw its market share fall to 22% in February, its lowest level since 2020, according to CoinDesk Research. This marks a dramatic retreat from the 50%-plus dominance Binance maintained during the 2021–2023 cycle. Total spot volume across all CEXs fell to $1.50 trillion (down 3.01%), while derivatives volume declined to $4.11 trillion (down 2.41%). The volume contraction is a direct consequence of the extreme fear environment gripping markets, with the Fear & Greed Index sitting at 18/100.
| Exchange | Feb 2026 Spot Volume | Market Share | MoM Change |
|---|---|---|---|
| Binance | $330B (est.) | 22.00% | Lowest since 2020 |
| OKX | — | ~8% | — |
| Bullish | $76B | 5.06% | +62.6% |
| Coinbase | $69B (est.) | 4.59% | Overtaken |
What Exchange Fragmentation Means for Investors
The decentralization of exchange market share carries significant implications for both retail and institutional traders. When Binance commanded over half of global volume, its order books effectively set global prices, creating single-point-of-failure risk — a concern painfully illustrated during past exchange-specific crises. With volume now distributed across Binance (22%), OKX, Bullish (5.06%), Coinbase (4.59%), and rising platforms like Gate, price discovery is becoming more resilient. However, fragmented liquidity can also widen spreads during volatile periods. For traders navigating the current Bitcoin price uncertainty around $69,400, selecting an exchange with deep liquidity and competitive fees is more critical than ever. Bullish's rapid ascent — backed by institutional-grade infrastructure and its EOS-era treasury — suggests that compliance-first platforms are capturing flow that once defaulted to Binance.
Market Outlook: Where Do Markets Head After Extreme Fear?
History offers a compelling — if imperfect — answer to the question every investor is asking: does an extreme fear reading of 18 on the Crypto Fear & Greed Index signal a generational buying opportunity or a warning of deeper capitulation ahead? The statistical record is unambiguous in its directional bias: every time the index has plunged below 15, Bitcoin has delivered positive returns within 90 days roughly 80% of the time, according to Spoted Crypto analysis. Across three prior extreme fear episodes — December 2018 (index: 10), March 2020 (index: 8), and November 2022 (index: 12) — BTC generated returns ranging from +158% to +1,400% within twelve months. Yet the path from capitulation to recovery has never been a straight line, and current market conditions present a uniquely bifurcated set of catalysts.
The Bull Case: Regulatory Clarity and Institutional Momentum
The most powerful catalyst supporting a recovery thesis landed on March 11, when the SEC and CFTC signed a historic Memorandum of Understanding ending decades of jurisdictional rivalry over digital asset oversight, as reported by CoinDesk. SEC Chairman Paul S. Atkins stated that "regulatory turf wars, duplicative agency registrations, and different sets of regulations between the SEC and CFTC have stifled innovation and pushed market participants to other jurisdictions." This regulatory détente, combined with the EU's fully operational MiCA framework and Asia's evolving licensing regimes, is removing the single largest overhang that has historically suppressed institutional capital allocation to crypto. The BTC ETF complex has already responded: March has seen $986 million in cumulative net inflows — the first two consecutive weeks of inflows in five months — with BlackRock's IBIT accounting for 75.2% of daily flows, per TradingNews. Ripple's $750 million share buyback at a $50 billion valuation, alongside Goldman Sachs loading $153.8 million into XRP ETFs, further underscores that institutional conviction is strengthening even as retail sentiment collapses.
The Bear Case: Whale Pressure and Fragile Sentiment
Counterbalancing the bullish catalysts is a set of on-chain warning signals that cannot be ignored. The Exchange Whale Ratio has surged to 0.64 — its highest reading since 2015 — meaning 64% of all BTC flowing into exchanges originates from the top 10 largest depositors, according to AInvest. This metric has historically preceded significant downside pressure from large holders. A recent case in point: a whale deposited 2,500 BTC ($172.6 million) to Binance at the $70,000 level, having originally accumulated at $81,000, crystallizing a panic-driven loss, per AMBCrypto. BTC's negative funding rate of -0.0078% on Binance confirms that short positioning remains dominant, adding fuel to any sharp upward move but also reflecting persistent bearish conviction among derivatives traders.
Two Expert Scenarios: U-Shaped Bottom vs. Sharp Rebound
The market's trajectory likely follows one of two frameworks currently debated among top analysts. Matt Hougan, CIO of Bitwise Asset Management, argues that "2026 is shaping up to be a U-shaped bottoming year rather than a sharp V-shaped recovery," projecting BTC to trade within a $75,000–$100,000 range through the first half of the year, as cited by CCN. In this scenario, the current $69,400 level sits near the bottom of the range, with gradual recovery driven by sustained ETF inflows and regulatory tailwinds. Macroeconomist Henrik Zeberg offers a more aggressive thesis: a 75% probability of BTC reaching $110,000–$120,000 by late March, with a 25% chance of overshooting to $140,000–$150,000, driven by ETF demand and a risk-on sentiment reversal, per BingX News. With BTC at $69,407 — down 44.5% from its all-time high of $126,210 — the current price level sits at a historical inflection point.
Key Indicators to Watch
Investors should monitor five critical signposts to determine which scenario unfolds: first, whether the Fear & Greed Index stabilizes above 20 and sustains that level for a full week, signaling a shift from capitulation to cautious accumulation. Second, the persistence of BTC ETF net inflows — the current $986 million monthly run rate must hold or accelerate. Third, the Exchange Whale Ratio trending below 0.55 would indicate reduced large-holder selling pressure. Fourth, BTC funding rates returning to neutral or positive territory would confirm a derivatives market reset. Finally, follow-through from the SEC-CFTC MOU — specifically, the Joint Harmonization Initiative's first regulatory guidance — will determine whether institutional capital currently on the sidelines begins moving in size. History suggests patience pays: the March 2020 extreme fear reading of 8 preceded a 1,400% rally, but it took 13 months to unfold.
Frequently Asked Questions
Is a Fear and Greed Index Reading of 18 a Buy Signal?
A Fear and Greed Index score of 18 places the market firmly in "extreme fear" territory — a zone that has historically preceded positive returns roughly 80% of the time over a 90-day horizon when readings dip below 15. According to Spoted Crypto's analysis, the index plunged as low as 8 in early March 2026, rivaling the COVID-19 crash low of 8 in March 2020 and the FTX collapse reading of 12 in November 2022. However, extreme fear is not an automatic buy signal — the post-FTX recovery, for instance, took more than two years to reclaim prior highs. Rather than attempting to time a precise bottom, a dollar-cost averaging (DCA) strategy has proven more effective during prolonged fear cycles, allowing investors to accumulate positions while mitigating the risk of catching a falling knife. The current recovery to 18 suggests sentiment is stabilizing, but ongoing market monitoring remains essential before committing significant capital.
Will Continued BTC ETF Inflows Drive Bitcoin's Price Higher?
March 2026 has delivered an encouraging $986 million in cumulative net inflows into spot Bitcoin ETFs — the first back-to-back weeks of positive flows in five months, according to TradingNews. BlackRock's IBIT alone accounted for $185.8 million (75.2%) of the $246.9 million single-day inflow recorded on March 10. Yet ETF demand alone cannot guarantee a price reversal. On-chain data from AInvest shows the Exchange Whale Ratio has surged to 0.64 — the highest since 2015 — meaning 64% of all BTC flowing into exchanges originates from the top 10 largest depositors. A single whale recently dumped 2,500 BTC ($172.6 million) on Binance, contributing to BTC's slide to $66,975 as reported by AMBCrypto. Until on-chain selling pressure subsides, ETF inflows function as a counterweight rather than a catalyst — learn more about these dynamics in our BTC ETF flow tracker.
How Will the SEC-CFTC MOU Impact the Crypto Market?
On March 11, 2026, the SEC and CFTC signed a landmark Memorandum of Understanding that formally ends decades of jurisdictional rivalry over digital assets, establishing the Joint Harmonization Initiative co-led by SEC's Robert Teply and CFTC's Meghan Tente, as reported by CoinDesk. SEC Chairman Paul S. Atkins stated: "For decades, regulatory turf wars, duplicative agency registrations, and different sets of regulations between the SEC and CFTC have stifled innovation and pushed market participants to other jurisdictions." This clarity is expected to accelerate institutional capital deployment into U.S.-based crypto ventures over the medium to long term, complementing the EU's MiCA framework that took full effect in late 2024. However, market participants should temper expectations — translating an MOU into detailed rulemaking typically requires months to years of public comment periods and legislative coordination. For a deeper dive into how U.S. regulatory shifts affect crypto prices, see our dedicated analysis.
Why Are Regional Crypto Price Premiums Turning Negative?
One of the most closely watched indicators of retail sentiment across Asian markets is the so-called "Kimchi premium" — the price difference between Bitcoin on Korean exchanges versus global platforms like Binance and OKX. Historically, this premium surged to +5% to +50% during bull markets as Korean retail investors piled in aggressively. As of March 2026, however, the premium has flipped to approximately -0.47%, signaling that domestic prices are trading below global benchmarks. This reversal reflects a convergence of factors: tightened regulatory oversight across Asia (including South Korea's Virtual Asset User Protection Act), the extreme fear environment captured by an index reading as low as 8 in early March per Spoted Crypto, and increased migration to offshore exchanges. Negative regional premiums are not unique to Korea — similar discount patterns have been observed during capitulation phases in other markets. Combined with CEX total volumes hitting a 16-month low of $5.61 trillion in February according to CoinDesk Research, the data paints a picture of broadly suppressed retail participation worldwide.
Data Sources
- CoinDesk — SEC-CFTC MOU Coverage (March 11, 2026)
- TradingNews — BTC ETF Daily Inflow Data
- AMBCrypto — Whale Dump Analysis
- AInvest — Exchange Whale Ratio Data
- CoinDesk Research — February 2026 Exchange Review
- Spoted Crypto — Fear & Greed Index Analysis
This article is for informational purposes only and does not constitute investment advice. All investment decisions should be made based on your own judgment and responsibility.
Related Articles
- Fear & Greed Index Hits 18: Crypto Market Briefing for March 12, 2026
- Fear & Greed Index Hits 13: Extreme Fear Market Briefing with Reverse Kimchi Premium & Derivatives Data (Mar 11)
- Fear & Greed Index Hits 8: Near All-Time Low — Crypto Market Briefing March 10, 2026
- Fear & Greed Index Hits 12: Extreme Fear — Weekly Crypto Market Briefing for March Week 2
- Bitcoin Drops Below $68K as Fear Index Hits 12 — Whales Quietly Accumulate 270,000 BTC