A cryptocurrency chart is stuck in a boring sideways movement. Let's remember that boredom is always an opportunity. We share a chart with two opposing views.
Crypto investor Axel shared a chart with BTC Squeeze Detector data, stating that the market is currently experiencing the biggest squeeze of the year. According to the chart, we can see the squeeze at the January 21, 2021 level, and there are predictable areas where we can see which direction the...

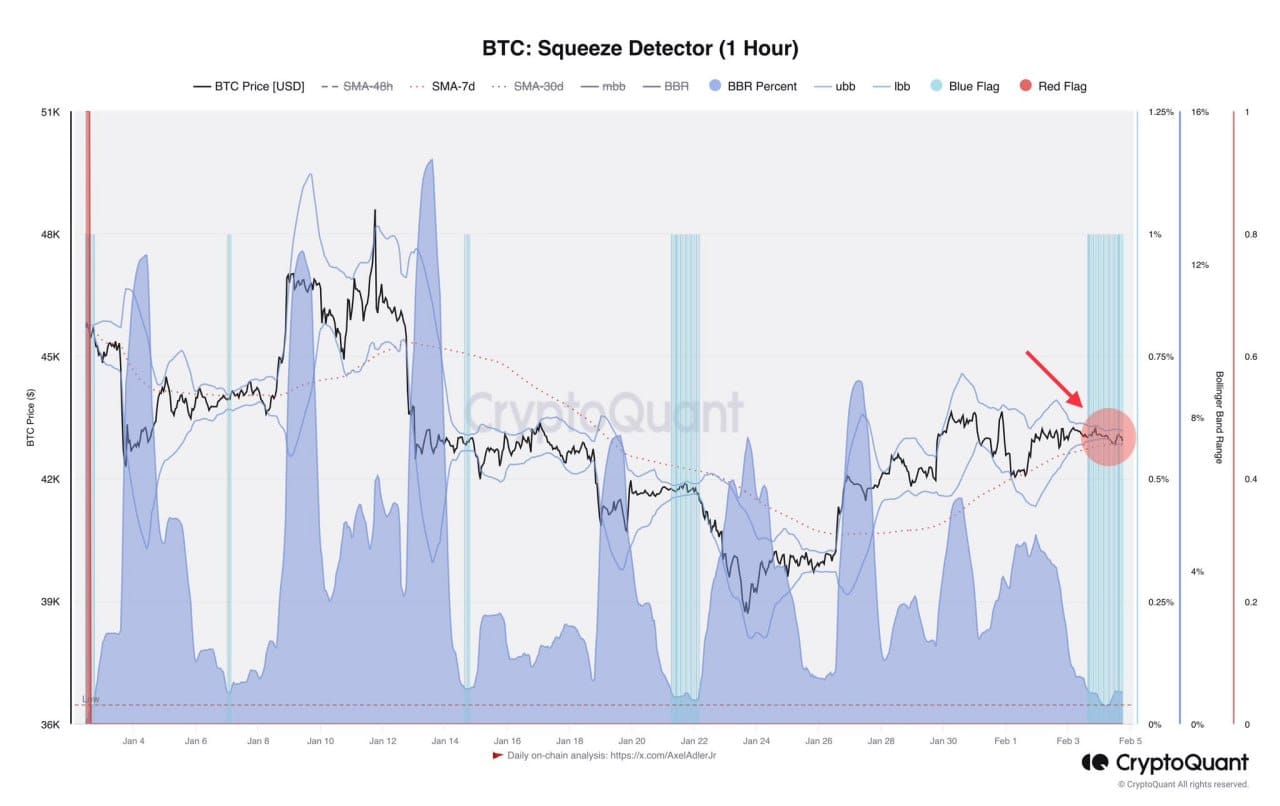
Crypto investor Axel shared a chart with BTC Squeeze Detector data, stating that the market is currently experiencing the biggest squeeze of the year. According to the chart, we can see the squeeze at the January 21, 2021 level, and there are predictable areas where we can see which direction the market will move after that squeeze.
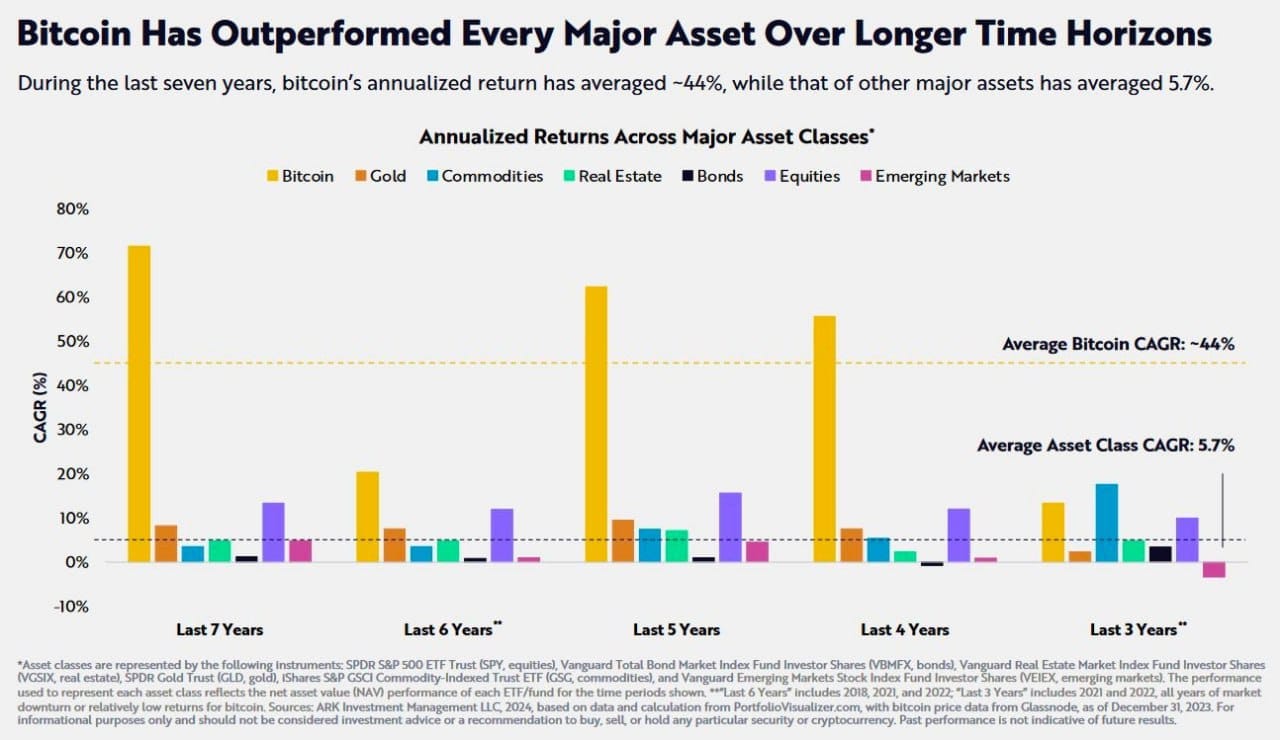
Another crypto analyst shared a chart of bitcoin's intrinsic value over the past seven years. The chart shows that bitcoin has outperformed other major investment assets. The chart shows how bitcoin has outperformed gold and commodities, real estate, bonds and commodities, and emerging markets. It is not impossible to predict the value of bitcoin after the halving that is coming soon, as it has already been recognized and is waiting for more investors to invest in it through spot ETFs.
Related Articles
- Ethereum vs Solana March 2025: Exchange Reserves Hit All-Time Low as Alpenglow Promises 150ms Finality
- Solana (SOL) Price Outlook March 2026 — 46% Below 200-Day MA, Can Firedancer & Alpenglow Spark a Reversal?
- DeFi Governance Crisis — Aave's Core Power Broker Exits as SUI TVL Crashes 78% and $95.7B Ecosystem Polarizes
- DeFi TVL Hits $95.4B as Aave Crosses $1 Trillion in Loans — Staking & Airdrop Guide March 2026
- Ethereum (ETH) Price Analysis March 2026: Fear & Greed at 12 — Are We at a Historical Bottom?