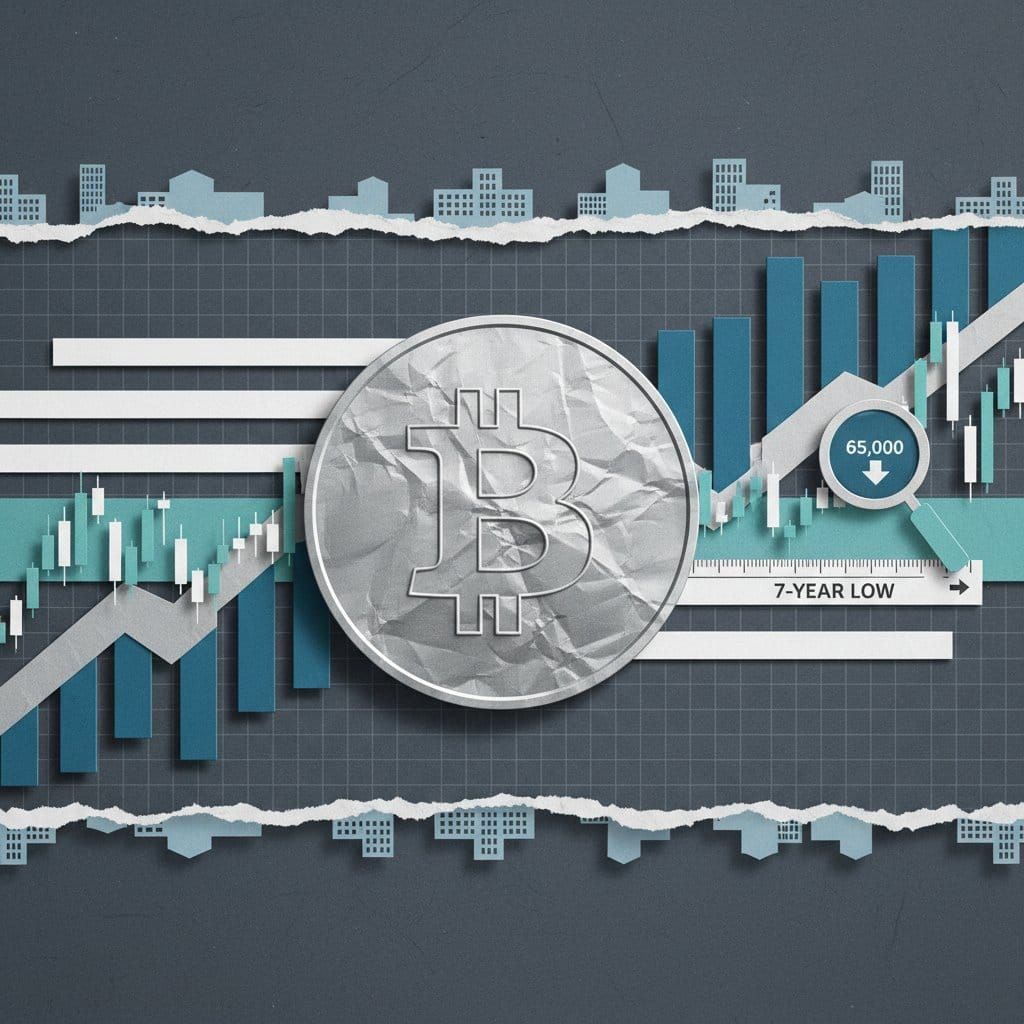
Bitcoin (BTC) is closing the week of April 17, 2026 in the $74,290–$75,412 range, with Binance reporting $74,729 (+0.13%) at 11:00 KST on 24-hour volume of $1.3 billion. Total crypto market cap stands at $2.62 trillion; BTC dominance is 57.0%. The setup is genuinely contradictory: exchange reserves have just hit a 7-year low while the Fear & Greed Index has been locked at extreme fear for 60+ consecutive days — the longest such streak ever recorded. Something has to give.
Bitcoin Weekly Snapshot: April 17, 2026
Quick Answer: Bitcoin is trading at $74,729 on Binance (April 17, 11:00 KST) as exchange reserves fall to a 7-year low of 2.21M BTC. Cumulative spot ETF inflows have surpassed $53 billion while the Fear & Greed Index reads 21 — extreme fear for 60+ straight days. The $75,000 weekly close is the line in the sand.
As of April 17 at 11:00 KST, Binance volume data shows BTC leading spot trading at $1.3 billion in 24-hour volume, followed by ETH ($2,335, -0.74%) and a notable outlier: ORDI surged +144.46% to $9.08 on $246 million in volume, ranking #7 by volume on the exchange. XRP trades at $1.43 (+2.03%) and SOL at $88 (+3.95%), both showing relative strength against BTC's flat session. Below is the full Binance top 10 by 24-hour trading volume:
| # | Coin | Price | 24h Change | Volume(24h) | High | Low |
|---|---|---|---|---|---|---|
| 1 | USDC | $1.00 | +0.00% | $3.1B | $1.00 | $1.00 |
| 2 | BTC | $74,729 | +0.13% | $1.3B | $75,534.76 | $73,309.85 |
| 3 | ETH | $2,335 | -0.74% | $775.5M | $2,369.59 | $2,285.10 |
| 4 | BARD | $0.34 | +4.49% | $613.3M | $0.34 | $0.31 |
| 5 | SOL | $88 | +3.95% | $350.8M | $90.53 | $83.80 |
| 6 | USD1 | $1.00 | +0.01% | $250.3M | $1.00 | $1.00 |
| 7 | ORDI | $9.08 | +144.46% | $246.4M | $10.71 | $3.68 |
| 8 | XRP | $1.43 | +2.03% | $222.4M | $1.47 | $1.39 |
| 9 | DOGE | $0.10 | +3.65% | $163.5M | $0.10 | $0.09 |
| 10 | XAUT | $4,770 | -0.58% | $144.7M | $4,815.59 | $4,751.83 |
Technical Analysis: RSI 42, MACD -894, and the Bollinger Band Test
Bitcoin's indicators maintain a bearish lean heading into the weekend close. RSI stood at 42 as of April 4 — approaching neutral but not yet at the oversold threshold of 30, leaving room for further downside (source: BingX). MACD is deeply negative at -894, with the signal line spread failing to narrow, confirming sustained bearish momentum. On Bollinger Bands, BTC is testing the lower band for support; a successful hold targets the mid-band near $77,000–$78,000, while a breakdown opens room toward $73,000 and the critical $70,000 demand zone.
Live Binance futures data as of April 17 adds further nuance. BTC's funding rate is 0.0033% — near neutral, indicating neither side is dangerously overcrowded. Open interest stands at $7.3 billion. The long/short ratio is a notable 42% long vs. 58% short — a bearish positioning tilt consistent with extreme-fear regimes. Historically, heavy short positioning during fear peaks has set up short squeezes when price reclaims key resistance. The April 2 "Liberation Day" tariff shock that briefly drove BTC below $82,000 (source: KuCoin Blog) triggered the risk-off liquidation wave that drove prices to current levels.
| Coin | Funding Rate | Open Interest | Long/Short |
|---|---|---|---|
| BTC | 0.0033% | $7.3B | 42.0% / 58.0% |
| ETH | 0.0009% | $4.9B | 60.0% / 40.0% |
| SOL | 0.0100% | $931.4M | 60.2% / 39.8% |
| XRP | 0.0031% | $421.4M | 66.4% / 33.6% |
| DOGE | 0.0100% | $258.1M | 70.9% / 29.1% |
| BNB | 0.0098% | $351.8M | N/A |
| ADA | 0.0100% | $95.9M | N/A |
| AVAX | 0.0100% | $90.9M | N/A |
| LINK | 0.0100% | $88.9M | N/A |
| DOT | 0.0100% | $50.1M | N/A |
Exchange Reserves at 2.21M BTC: The Supply Story
The most structurally significant data point of the week comes from on-chain analytics. Bitcoin exchange reserves have fallen to 2.21M BTC — the lowest level since 2019 (source: SpotedCrypto). Net 48,200 BTC exited exchanges over the past 30 days; on March 7 alone, 32,000 BTC ($2.26 billion) were withdrawn in a single session — the largest single-day exchange outflow on record, surpassing the pace of the entire 2020–2021 bull market accumulation phase.
Whale wallets holding 1,000+ BTC grew from 2,082 in December 2025 to 2,140 by April 2026, accumulating 270,000 BTC in 30 days — the largest monthly whale buy since 2013 (source: SpotedCrypto). The historical parallel is instructive: the last time reserves were at this level (mid-2019), BTC rallied approximately 180% over the following 12 months, from $5,000 to $14,000.
The bearish caveat: daily active addresses stand at 623,382, below the six-month average and in a declining trend (source: The Block). Retail is absent. Supply is compressing, but without a demand-side recovery catalyst, near-term upside remains constrained. Both signals can coexist — and that tension defines this week.
| On-Chain / Institutional Metric | Value | Source |
|---|---|---|
| Exchange Reserves | 2.21M BTC (7-yr low) | SpotedCrypto |
| 30-Day Net Exchange Outflow | 48,200 BTC | SpotedCrypto |
| Record Single-Day Outflow (Mar 7) | 32,000 BTC ($2.26B) | SpotedCrypto |
| Whale Addresses (1,000+ BTC) | 2,140 (+58 since Dec 2025) | SpotedCrypto |
| Whale 30-Day Accumulation | 270,000 BTC (largest since 2013) | SpotedCrypto |
| Daily Active Addresses | 623,382 (below 6-mo avg) | The Block |
| BlackRock IBIT Holdings | 788,927 BTC | StockTwits |
| IBIT 2-Day Inflows (Apr 14–15) | $505.7M | GuruFocus |
| Cumulative Spot ETF Inflows | $53B+ | Intellectia AI |
| Total Spot ETF Net Assets | ~$96.5B | Bitcoin Ethereum News |
Institutional Demand: Why BlackRock Keeps Buying
While the Fear & Greed Index reads 21, institutional money flows are telling the opposite story. BlackRock IBIT pulled in $505.7M in net inflows over just two days (April 14–15), following a $269.3M single-day inflow on April 10. Fidelity FBTC added $53.3M on the same day. Total cumulative U.S. spot BTC ETF inflows now exceed $53 billion, with total net assets approaching $96.5 billion (source: Intellectia AI). BlackRock alone holds 788,927 BTC — closing in on the 800,000 threshold.
Jurrien Timmer, Director of Global Macro at Fidelity Investments, stated: "Subsequent bear markets typically last about one year, making 2026 an expected 'off year' with support forming in the $65,000–$75,000 range." (source: CoinGecko)
Larry Fink, CEO of BlackRock, described IBIT's early 2026 performance as delivering "one of the strongest starts to the year ever" in terms of ETF inflows. (source: DL News)
Both executives frame the $70,000–$75,000 zone as a strategic accumulation window, not a danger zone. Our earlier coverage of institutional behavior during the extreme fear period shows this divergence between smart money and retail sentiment is consistent with prior cycle bottoms. For a broader look at which assets are drawing institutional interest, see our top crypto picks under extreme fear conditions.
Bullish vs. Bearish Scenarios for Next Week
Q1 2026 is now Bitcoin history — for the first time ever, January, February, and March all closed in the red. The two closest precedents, Q1 2018 and Q1 2022, both produced major cycle lows within 3–6 months followed by sustained recoveries (source: SpotedCrypto). If the pattern holds, Q2–Q3 2026 may mark the medium-term floor. Additionally, when Fear & Greed has been this depressed historically — the March 2020 COVID crash and May 2021 China mining ban — average 90-day returns came in at +48% (source: Techi).
Bullish scenario: BTC posts a weekly close above $75,000 and holds the level. ETF daily inflows stay above $300M. Progress on U.S.-China trade negotiations or a Fed dovish signal acts as the macro catalyst. Near-term targets: $78,000–$82,000; extended target: $90,000+.
Bearish scenario: $72,000 support fails, triggering a test of the $70,000–$70,540 demand zone. If that breaks, Timmer's $65,000 lower bound enters the picture. Primary risk factors: continued retail disengagement and renewed trade policy escalation.
Five Things to Watch Next Week
- $75,000 weekly close — a confirmed close above this level is the first signal of a short-term trend reversal.
- $70,000 support — a breakdown here risks triggering stop-loss cascades and deeper selling pressure.
- ETF daily inflows — IBIT daily inflows above $200M signal that sustained institutional demand remains intact.
- Fear & Greed reclaiming 30 — the minimum threshold for a technical bounce to qualify as a trend shift.
- U.S.-China trade headlines — any tariff de-escalation or negotiation resumption signal could serve as BTC's macro catalyst.
FAQ
What does Bitcoin's exchange reserve hitting a 7-year low mean for price?
Exchange reserves at 2.21M BTC — the lowest since 2019 — mean fewer coins are available for immediate sale on exchanges. When available supply falls this low and demand returns, price moves can be disproportionately sharp. The last comparable period (mid-2019) preceded a ~180% rally over 12 months. The key risk is that retail demand has not yet recovered: supply tightness alone may not ignite a breakout without an external catalyst, whether macro or regulatory.
Does Q1 2026's three consecutive red months signal prolonged downside for Bitcoin?
Historically, no. The two closest precedents — Q1 2018 and Q1 2022 — both produced major cycle lows within 3–6 months, followed by strong recoveries. While Q1 2026 marks the first time in Bitcoin's history that all three Q1 months closed red, the on-chain and institutional data (record whale accumulation, declining exchange reserves, ETF inflows above $53B) collectively suggest an accumulation phase — which historically precedes recovery rather than prolonged decline.
This article is for informational purposes only and does not constitute investment or financial advice. All investment decisions are made at your own risk and responsibility.
Related Articles
- Axelar (AXL) Surges +23.57% as Cross-Chain Security Narrative Gains Momentum
- 2026's Three Crypto Mega Narratives: RWA Hits $27.6B, AI Tokens Rebuild, Hyperliquid Dominates Derivatives
- Bitcoin Exchange Reserves Hit 7-Year Low as Whales Accumulate 270K BTC
- Bitcoin Exchange Reserves Hit 7-Year Low as Whales Stack 270K BTC
- ETH, SOL & AVAX: Are L1 Altcoins Signaling an April 2026 Bottom?