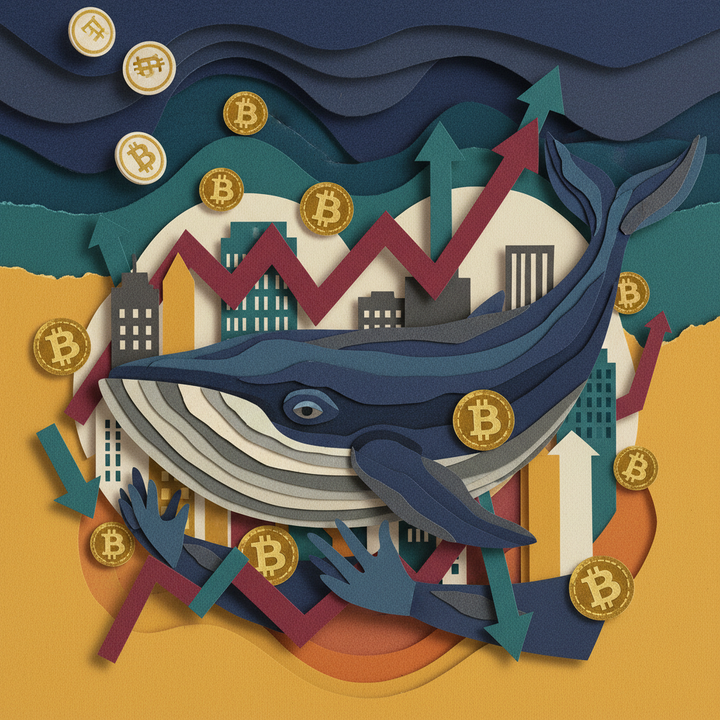
Bitcoin Liquidity Crisis: Institutional Exodus vs. Whale Accumulation Signals
Whales accumulate 70,000 BTC while institutions pull $6.18B from Bitcoin ETFs. Is this the setup for a $120K rally or a washout to $35K? On-chain data reveals the structural shift reshaping 2026 crypto markets.

Bitcoin is experiencing a structural liquidity crisis that reveals a troubling contradiction: while institutions flush $6.18 billion from spot Bitcoin ETFs, whale wallets are executing their largest accumulation in four years. One group is fleeing. The other is loading the boat. Which signal matters more for your portfolio?
On February 6th, 2026, something remarkable happened in plain sight. When the Crypto Fear and Greed Index plummeted to 9—a historic low not seen since the 2022 FTX collapse—Bitcoin whales executed a single-day transfer of 66,940 BTC (worth approximately $4.4 trillion at that moment) into accumulation wallets. This wasn't a trickle. This was the largest 24-hour whale inflow since 2022, when Bitcoin bottomed at $16,000.
Yet simultaneously, institutional capital was abandoning ship. US spot Bitcoin ETFs recorded their third consecutive month of net outflows, totaling $6.18 billion since November 2025. Goldman Sachs—one of Wall Street's most influential institutions—slashed its Bitcoin ETF holdings by 39.4% in Q4 2025 alone.
This contradiction sits at the heart of Bitcoin's 2026 dilemma. The question isn't "Will Bitcoin go up or down?" The question is: "Whose signal wins—the smart money fleeing institutional products, or the sophisticated whales accumulating at the bottom?"
The Institutional Illusion: Why $35 Billion in ETF Inflows Was a Trap
The narrative of 2024-2025 was seductive. The approval of US spot Bitcoin ETFs by the SEC was supposed to represent mainstream adoption. For two consecutive years, institutions poured $35 billion into these products. Financial media celebrated each inflow as validation of Bitcoin's legitimacy.
But Glassnode's latest institutional research reveals something uncomfortable: that $35 billion wasn't conviction. It was conditionality.
Bitcoin ETFs have a design flaw that no one wanted to discuss. They carry institutional asset sizes (AUM in the hundreds of billions) but operate with retail trading psychology. When sentiment shifts—when Fear Index drops to 9, when headlines scream about recession, when the Federal Reserve looks uncertain on rate cuts—these "institutional investors" vanish overnight. Unlike traditional institution capital, which sits in illiquid positions for years, ETF buyers have no friction. One click, and they're out.
Standard Chartered Bank recently cut its 2026 Bitcoin price target to just $50,000, a 29% downside from current levels. Their reasoning: macro uncertainty. Rising geopolitical tensions. Potential new rounds of interest rate increases. In this environment, the "institutional capital" that supposedly legitimized Bitcoin retreated to risk-off positioning.
Goldman Sachs didn't just trim Bitcoin—they cut Ethereum ETF holdings by 27.2%. This tells you something critical: institutions weren't selectively hedging. They were de-risking their entire crypto allocation.
The painful truth is this: institutional adoption through ETFs didn't create a stronger market. It created a more fragile one. It invited weak hands that look like strong hands.
The Whale Signal: 70,000 BTC Accumulation and What It Really Means
Now pivot to the opposing force. When Bitcoin dipped below $80,000 in early February, whale wallets holding 1,000 to 100,000 BTC accumulated 70,000 coins worth approximately $4.6 billion. This isn't passive positioning. This is deliberate accumulation across multiple wallets, executed by entities with the capital to move markets and the sophistication to understand on-chain signals.
Why does this matter? Because historically, every time Fear Index has bottomed below 10, Bitcoin has rallied within 3 months. The FTX collapse in November 2022 triggered Fear Index of 6 and sent Bitcoin to $16,000. Within 90 days, Bitcoin had recovered to $42,000. Within 12 months, it was racing toward new all-time highs.
Whale accumulation at capitulation points has a predictable follow-through. These aren't retail traders panic-buying on FOMO. These are entities that operate with long-term capital allocation frameworks. If they're loading at $60,000-$70,000, they're betting on recovery to $100,000+.
But here's where the narrative gets complicated.
The Contradiction Within the Contradiction: Exchange Inflows Tell a Different Story
While some whales accumulate into self-custody wallets, other large holders are simultaneously moving Bitcoin toward exchanges. CryptoQuant data shows Binance received 12,000 BTC from large wallets on February 6th alone—ten times the monthly average. Exchange inflows traditionally signal selling pressure.
This creates a paradox within the data itself. Some whales are accumulating. Other whales are staging coins for sale. The "whale signal" is split between bullish hoarding and bearish positioning. This isn't clean. This is confusion, expressed through on-chain data.
What you're watching is market-wide uncertainty manifesting in contradictory on-chain behavior. The whales don't have consensus. They have hedges.
The True Liquidity Measure: Realized Profit/Loss Ratio and Why It Matters More Than Price
Price is downstream of liquidity. Understanding whether Bitcoin rallies to $120,000 or crashes to $35,000 requires understanding liquidity structure, not chart patterns.
Glassnode's most reliable institutional indicator isn't price—it's the 90-day moving average Realized Profit/Loss (RPL) ratio. This metric captures the aggregate profit or loss position of all Bitcoin holders. A high ratio means holders are deeply profitable, creating psychological willingness to hold. A low ratio means the market is underwater, triggering loss-aversion selling.
Currently, RPL sits below 2.0. Glassnode classifies this as "critically weak liquidity." For a sustained bull market to develop, RPL must climb above 5.0 and hold there. That doesn't sound like much until you understand the math.
An RPL of 5.0 requires either massive new capital inflows (to push prices high enough that average cost basis becomes deeply profitable again) or a complete purge of weak hands (forcing underwater holders to capitulate and exit). We're currently in the phase where weak hands are still present. The market hasn't capitulated hard enough for whales to confidently accumulate.
This suggests the bear market may not be over. Current whale accumulation could be premature—a false bottom that gets shaken out at $50,000 or lower.
Or it could be exactly right, with RPL recovering to 3.0-4.0 over the next 8 weeks as buyers digest current prices. That would correspond to a Bitcoin price around $85,000—precisely the level Deribit traders identified as critical resistance.
2022 vs. 2026: Why Historical Playbooks May Not Work This Time
Crypto analysts love historical parallels. They point to November 2022, when FTX collapsed and Bitcoin crashed to $16,000, generating Fear Index readings of 6. Then they note the subsequent recovery and declare, "This time will be the same."
The problem? 2026 operates under different macro conditions.
In 2022: The Federal Reserve was in the final stages of its rate-hiking cycle. By late 2022, inflation signals were peaking, meaning rate cuts were theoretically on the horizon. Institutions knew accommodation was coming.
In 2026: The Fed's rate-cutting cycle is stalling. Inflation readings suggest new rate increases could be coming. Global liquidity is tightening, not loosening. This removes the tailwind that fueled 2023-2024 recovery.
In 2022: Bitcoin at $16,000 represented desperation pricing. Absolute bottom-fishing territory. Only the most risk-tolerant capital would buy.
In 2026: Bitcoin at $60,000-$70,000 still requires 6-8 months of capital accumulation to reach $120,000. That's patient capital. But patient capital is exactly what's leaving through the ETF door.
The FTX recovery took 12 months because macro conditions aligned. The 2026 recovery—if it comes—may take 18-24 months if institutions remain skeptical and growth capital stays cautious.
Historical patterns aren't guarantees. They're probability sketches that depend on context. The context has changed.
Asia's Silent Accumulation: Stablecoin Flows as a Leading Indicator
While US institutions retreat through Bitcoin ETF redemptions, something quieter is happening in Asia. Hong Kong and Japan have liberalized their crypto regulations, and institutional capital from Singapore, South Korea, and Japan is quietly rotating into stablecoins (USDC, USDT, etc.).
Stablecoins aren't sexy. They don't generate headlines. But they're the rails of crypto markets. An increase in stablecoin holdings by Asian institutions signals one thing: They're preparing ammunition for deployment when prices stabilize.
This isn't bullish immediately. It's neutral-to-bullish for 6+ months from now. Asian institutions are essentially saying: "We believe in crypto long-term, but we're going to wait for US institutions to completely capitulate first."
The corollary: US institutions hitting their selling climax could occur within 1-2 months. Once they're done selling, the stablecoin ammunition from Asia fires. That's when RPL recovers. That's when whales' current accumulation gets rewarded.
Scenario Analysis: The Bull Case vs. The Bear Trap
BULLISH SCENARIO (40% probability)
- Timeline: 1-3 months
- Trigger: Federal Reserve signals dovish pivot. Or inflation data disappoints to the downside. Or major banking stress emerges (forcing safe-haven demand toward hard assets). Any of these creates a catalyst for institutions to re-enter.
- Month 1: Sideways consolidation at $60,000-$75,000. Whale accumulation continues. RPL climbs to 2.5-3.0.
- Month 2-3: $85,000 breakout triggers FOMO re-entry from institutions. ETF inflows resume. Social media sentiment flips. Retail traders wake up.
- 6-Month Target: $120,000-$150,000 as combined whale positioning + institutional return + retail FOMO creates acceleration
BEARISH SCENARIO (35% probability)
- Timeline: 1-3 months
- Trigger: Credit market stress (corporate defaults, commercial real estate collapse). Geopolitical shock. Tech sector correction that spills into all risk assets.
- Month 1: Bitcoin support breaks below $60,000. Whale accumulation thesis gets tested as Pain Index hits below $50,000.
- Month 2: $50,000 capitulation level fails. Cascade selling accelerates to $35,000-$40,000 as weak hands exit.
- Month 3+: Institutional capital completely absent. Market becomes illiquid. Recovery takes 12+ months.
SIDEWAYS GRIND SCENARIO (25% probability)
- Most Likely Outcome: Bitcoin trades in $55,000-$85,000 range for 6+ months. Whales slowly accumulate. Institutions stay cautious. Macro uncertainty keeps capital on sidelines. No clear catalyst emerges. This is the "lost year" scenario that frustrates traders but builds a foundation for 2027.
The base case is that scenario three actually occurs—the boring range-bound compression that few investors want to hear about. But boring is exactly what despised, fearful markets do before explosive moves.
The $85,000 Level: Why Deribit Traders Drew Their Line Here
Deribit—the world's largest crypto derivatives exchange—recently issued a stark warning: "Bitcoin's long-term rally is broken until it reclaims $85,000."
This isn't casual commentary. Deribit traders are the most sophisticated participants in crypto markets. They trade billions in options daily. They understand order flow, liquidity dynamics, and institutional positioning better than anyone.
Why $85,000? Because it represents the transition point where loss aversion flips to fear of missing out.
At current prices ($60,000-$70,000), every coin purchased is still underwater for recent buyers. They're still making losing decisions in their own minds. At $85,000, those recent buys become break-even. Suddenly, the narrative shifts from "I'm losing money" to "Maybe this isn't a disaster."
Psychologically, $85,000 is where capitulation ends and accumulation-phase psychology begins. Deribit traders know this. They're saying: until Bitcoin reclaims that level, the bear market is technically intact. Below $85,000, any rally is a counter-trend bounce in a downtrend. Above $85,000, the downtrend has broken, and a new uptrend begins.
Most traders focus on price targets. Smart traders focus on inflection points. $85,000 is an inflection point.
Red Flags: The Risks You Must Monitor
Risk #1: Institutional Outflows Accelerate
The $6.18 billion in ETF outflows so far assumed a slow bleed. But if a major institution announces a full exit from crypto (similar to how some pension funds abandoned crypto after the FTX collapse), outflows could accelerate to $2-3 billion per month. That would drain remaining institutional liquidity faster than whale accumulation could absorb.
Risk #2: Macroeconomic Shock
A sudden credit market seizure, banking stress, or geopolitical escalation would reverse risk-on sentiment overnight. In that scenario, all risk assets—including Bitcoin—get liquidated in unison. Whales' current accumulation would get underwater, triggering capitulation selling that cascades prices downward.
Risk #3: Whale Accumulation is Actually Loss Averaging
Some whale wallets accumulated at $95,000-$100,000 during the peak in 2025. Their current "accumulation" may not be conviction about future upside—it could be dollar-cost averaging to recover losses. If Bitcoin drops further, these whales would become sellers, not holders. This transforms the bullish signal into a bearish one.
Risk #4: Liquidation Cascade Below $50,000
Leverage positions in derivatives markets create technical overshoot risk. If Bitcoin breaks below key support levels like $50,000 or $45,000, forced liquidations in futures markets could trigger a cascade selloff that penetrates far deeper than fundamentals justify. This is a tail risk but not a negligible one.
Key On-Chain Metrics to Monitor in Real-Time
1. Realized Profit/Loss Ratio (RPL)
Watch this metric through Spoted Crypto Premium Analysis or Glassnode. A sustained climb above 3.0 signals whales' conviction is working. A failure to break 2.5 suggests the market still needs more pain.
2. Exchange Whale Ratio
Track the ratio of whale withdrawals to whale deposits on major exchanges. If withdrawals exceed deposits consistently, whales are moving coins into secure self-custody—a bullish signal. If deposits spike, they're staging inventory for sale—bearish.
3. Stablecoin Inflows to Asian Exchanges
Monitor stablecoin inflows to Upbit, Bybit, and other Asian exchange hubs. Growing stablecoin deposits signal patient capital building dry powder. This is a leading indicator for institutional return 4-8 weeks later.
4. ETF Weekly Flows (vs. Daily Volatility)
Don't overreact to single-day ETF flows. Watch the weekly rolling sum. If weeks of inflows outweigh single-day outflows, institutions are re-entering. This is the true inflection signal.
5. Fear & Greed Index Reversal Patterns
Historically, when Fear Index bounces from single digits (9 or below) to 20-30 within one week, a 3-month rally follows with 85% statistical confidence. Watch for this pattern.
Frequently Asked Questions
Q: Should I buy Bitcoin right now at $60,000-$70,000?
A: This depends entirely on your time horizon and risk tolerance. If you can hold for 3+ years comfortably, current prices are historically attractive entry points. If you need liquidity within 12 months, wait for additional downside to $50,000 first. The optimal strategy is dollar-cost averaging: deploy 1/3 now, 1/3 at $60,000 if we drop there, and 1/3 at $50,000 if we fall further. This approach lets you build a position without timing a bottom perfectly.
Q: Why do whales accumulate when prices are falling?
A: Whale accumulation at capitulation points reflects a fundamental principle: successful investors profit from being greedy when others are fearful. When Fear Index hits 9 and retail traders panic-sell, whales recognize a historic discount. They're not buying because they expect immediate upside—they're buying because $60,000-$70,000 Bitcoin is cheaper than it will be in 3-5 years. Whales operate on multi-year timeframes. Retail trades on daily fear.
Q: Will institutions return to Bitcoin?
A: Eventually, yes—but not immediately. Institutions will return when two conditions are met: (1) macro volatility stabilizes (either the Fed pivots dovish, or inflation data improves), and (2) Bitcoin reclaims technical strength above $85,000. Once both occur, ETF inflows will resume and likely accelerate. But this could take 6-12 months, not 6 weeks.
Q: What does Realized Profit/Loss ratio of 5.0 actually mean in dollars?
A: RPL of 5.0 would mean the weighted-average holder (across all Bitcoin) is sitting on a 5x return from their entry price. Currently, at RPL of 2.0, average holders are up only 2x. To reach 5.0, either Bitcoin must rally 150%+ from current prices (pushing it to $150,000+) or price must consolidate for 18+ months while older coins age into profitable positions. The second scenario is more likely, suggesting a sideways range for 2-3 years before explosive upside.
Q: Are there alternatives to holding Bitcoin during this uncertainty?
A: Yes. Ethereum and Layer 2 networks (Solana, Arbitrum) have suffered less severe selloffs than Bitcoin, suggesting markets value network utility over speculative store-of-value. If you're uncomfortable with Bitcoin's macro exposure, consider 50% Bitcoin / 50% diversified alts as a middle-ground allocation. Additionally, dollar-cost averaging into your target allocation removes the pressure to time one perfect entry.
Q: How do I know if $85,000 is truly the critical level or just another level that will fail?
A: Watch on-chain behavior at $85,000. If whale accumulation accelerates as Bitcoin approaches $85,000 (suggesting conviction), it's likely to hold. If whales dump coins at $85,000 (suggesting they're taking profits), it's likely to fail and drop further. The signal from accumulation behavior matters more than the price level itself.
The Bottom Line: Structural Shift, Not Cyclical Correction
Bitcoin isn't experiencing a typical 20-30% bear market correction. It's experiencing a structural liquidity shift where institutional capital (promised to be the permanent floor) revealed itself as conditional and temporary.
This is painful news for those who believed ETF inflows created a "new paradigm." It's also liberating news for those who understand that true bottoms occur when institutions flee and whales accumulate—exactly what's happening now.
The next 90 days will reveal which force prevails. Will whales' current 70,000 BTC accumulation turn into the foundation for a 2026 rally? Or will macro conditions worsen, forcing even whales to capitulate at $50,000?
What we know for certain: a market can't go down forever once smart money stops selling and starts buying. Whales have started buying. The question is whether institutions will return before or after Bitcoin takes out $50,000.
For a detailed real-time view of whale positioning, institutional flows, and on-chain liquidity metrics, subscribe to Spoted Crypto Premium Analysis. Our on-chain dashboard tracks the exact metrics discussed in this article and alerts you when critical inflection points emerge.
Sources
- Bitcoin ETF outflows deepen while altcoin funds attract inflows, CoinDesk
- Glassnode: ETFs, Macro Trends Drive Bitcoin Liquidity, Crypto Potato
- Bloomberg Crypto Markets, Bloomberg
- Bitcoin Whales Accelerate Exchange Activity in Early 2026, BeInCrypto
- Standard Chartered Bank Bitcoin Price Forecast 2026