Bitcoin DCA Strategy Guide: 202% Returns Over 5 Years, Best Frequency, and Auto-Invest Setup (2026)
Bitcoin weekly DCA returned 202% over 5 years. Backtesting by frequency, exchange auto-invest comparisons, and why Fear & Greed at 10 makes now a statistically optimal entry point.
Bitcoin dollar-cost averaging (DCA) returned 202% over a 5-year backtest period, while fear-based DCA over 7 years delivered 1,145% — establishing systematic, emotion-free buying as one of the most data-backed strategies in crypto investing.
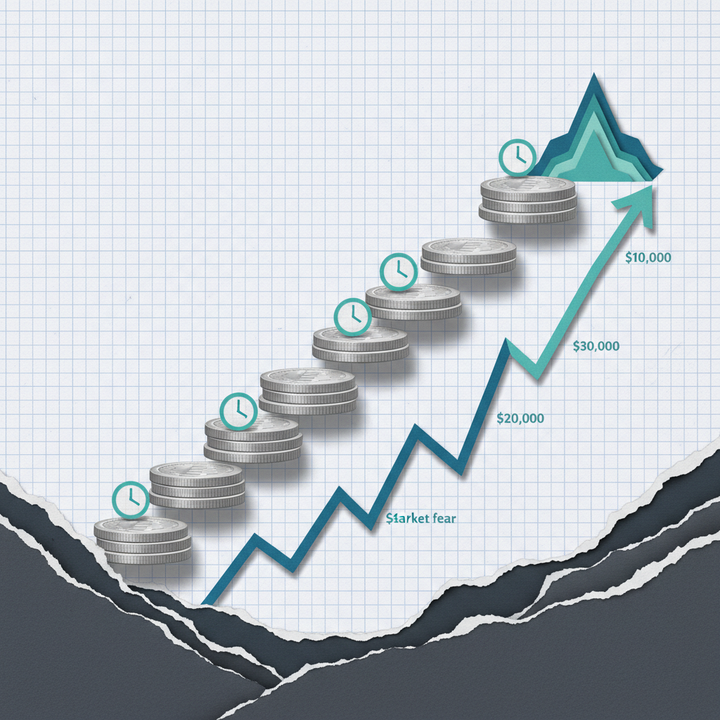
The single most common mistake in cryptocurrency investing is obsessing over entry timing. Buying at the top out of FOMO, selling at the bottom out of panic — and repeating this cycle endlessly. As of March 4, 2026 at 21:13 KST, the Fear & Greed Index sits at 10/100 — deep in Extreme Fear territory, down another 4 points from yesterday. BTC is trading at $70,870 on Binance (+4.59%), with total crypto market capitalization at $2.48 trillion and BTC dominance at 57.2%.
But history offers a clear signal. Every single time the Fear & Greed Index dropped to 10 or below — December 2018, March 2020, June 2022, November 2022 — Bitcoin staged a massive recovery without exception. Dollar-cost averaging, the strategy of investing a fixed amount at regular intervals regardless of price, is the most proven method to systematically capture these opportunities. This guide covers real backtesting data, frequency comparisons, exchange auto-invest setup instructions, and institutional DCA case studies — everything you need to build a disciplined accumulation strategy.
Key Takeaways
Quick Answer: Dollar-cost averaging (DCA) means buying a fixed dollar amount of Bitcoin at regular intervals. A weekly $10 DCA over 5 years turned $2,610 into $7,913 — a 202% return. Fear-based DCA over 7 years returned 1,145%, while a 10-year monthly DCA returned 1,648%. DCA reduces volatility risk by over 80% compared to lump-sum investing while delivering comparable long-term returns.
- 5-Year Weekly DCA: 202% Return — Investing $10/week in Bitcoin from 2019 to 2024, turning $2,610 into $7,913 (Source: Nasdaq)
- 7-Year Fear-Based DCA: 1,145% Return — Buying only when the Fear & Greed Index fell below 25 from 2018 to 2025, beating buy-and-hold (1,046%) by 99 percentage points (Source: dcabtc.com)
- 10-Year+ Monthly DCA: 1,648% Return — $100/month since 2014, turning $35,700 into ~$589,000 (Source: bitcoindollarcostaverage.com)
- Weekly DCA Is Optimal — Returned 202% vs. daily (195%) and monthly (170%), with one-seventh the transaction count of daily DCA (Source: Nasdaq, River Financial)
- Monday Buying Has a 14.36% Theoretical Edge — Though the actual 5-year cumulative difference was just $55.65 (1.2%), consistency matters far more than day selection (Source: River Financial)
- Binance Charges 0.10% per DCA Trade — Compared to Coinbase at 0.40–0.60% and Kraken at 0.25%, with Upbit offering the lowest at 0.05% (Source: Koinly)
- Strategy (Formerly MicroStrategy) Has DCA'd $54 Billion — Accumulating 717,131 BTC at an average cost of ~$76,000, never stopping purchases even during the 2022 bear market (Source: Blockonomi)
- Whales Are Accumulating — Wallets holding 1,000+ BTC have added 270,000 BTC (~$18.7 billion) in the past 30 days — the largest accumulation wave on record (Source: SpotedCrypto)
What Is DCA and Why Does It Work So Well in Crypto?
Dollar-cost averaging (DCA) is an investment strategy where you buy a fixed dollar amount of an asset at regular intervals, regardless of the current market price. For example, if you set up a $50 weekly Bitcoin purchase every Monday, you automatically buy fewer satoshis when the price is high and more when the price is low. Over time, this mechanically lowers your average cost basis. In a market where Bitcoin's daily volatility averages 3–5%, DCA is widely considered the most effective way to systematically spread out timing risk. While lump-sum investing wins 66% of the time in terms of raw returns, DCA reduces volatility risk by over 80% while delivering comparable long-term performance (Source: Bull Bitcoin). For most investors, the psychological benefit of not having to pick the "perfect" entry point makes DCA the more sustainable approach.
The case for DCA is especially compelling in cryptocurrency because the magnitude of drawdowns — and subsequent recoveries — far exceeds anything in traditional markets. Since 2013, every time Bitcoin has declined 70% or more from its peak, the average subsequent rally has been 3,485%, with a median of 1,692% (Source: Trade That Swing). In an asset class with this kind of extreme cyclicality, trying to time the exact bottom is nearly impossible — even for professional traders. DCA solves this by replacing emotion-driven decisions with system-driven execution. You never panic-sell at the bottom or FOMO-buy at the top, because the system doesn't care about sentiment.
Blockchain analytics platform Santiment has noted that "high negativity is often a bullish signal. When the crowd is convinced prices will go lower, it is often the time to start looking for long entries" (Source: SpotedCrypto). DCA is the automation of precisely this principle — buying consistently, especially when everyone else is too afraid to.
Bitcoin DCA Backtesting Returns: From 202% Over 5 Years to 1,648% Over a Decade
Real backtesting data shows that Bitcoin DCA returns range from 202% to 1,648% depending on the time horizon and strategy employed. The most widely cited case study comes from Nasdaq: an investor who put $10 into Bitcoin every week from 2019 to 2024 invested a total of $2,610 and ended with $7,913 — a return of 202.03% (Source: Nasdaq). For context, the S&P 500 returned roughly 80–90% cumulatively over the same period, meaning even a simple DCA approach in Bitcoin more than doubled the performance of traditional equity markets. An even more impressive variant — DCA executed only when the Fear & Greed Index dropped below 25 — returned 1,145% over 7 years (2018–2025), beating a pure buy-and-hold strategy (1,046%) by 99 percentage points (Source: dcabtc.com).
On the longest time horizon, the results become extraordinary. An investor who put $100 into Bitcoin every month starting in 2014 would have invested $35,700 total and accumulated approximately $589,000 — a 1,648% return (Source: bitcoindollarcostaverage.com). Time, combined with Bitcoin's long-term growth trajectory, amplifies DCA's compounding effect dramatically.
One particularly revealing data point comes from the 2022 extreme fear period (the Luna/FTX crisis). Investors who maintained their DCA through this period earned 192.47%, outperforming those who made a lump-sum investment at the same time (~160%) by 33 percentage points (Source: dcabtc.com). When the market was at its most terrifying, consistent DCA buyers were rewarded the most — exactly as the theory predicts.
| Time Period | Strategy | Total Invested | Final Value | Return | Source |
|---|---|---|---|---|---|
| 5 Years (2019–2024) | Weekly $10 DCA | $2,610 | $7,913 | 202% | Nasdaq |
| 7 Years (2018–2025) | Fear-Based DCA | — | — | 1,145% | dcabtc.com |
| 10+ Years (2014–) | Monthly $100 DCA | $35,700 | ~$589,000 | 1,648% | bitcoindollarcostaverage.com |
| 2022 Fear Period | DCA | — | — | 192% | dcabtc.com |
| 2022 Fear Period | Lump Sum | — | — | ~160% | Comparison baseline |
DCA Frequency Showdown: Daily vs. Weekly vs. Monthly
The frequency at which you execute DCA purchases has a measurable impact on returns. Analyzing 5-year backtesting data from 2019 to 2024, daily DCA returned approximately 195%, weekly DCA returned 202%, and monthly DCA returned roughly 170% (Source: Nasdaq, River Financial). Lump-sum investing posted the highest raw return at ~220%+, but this assumes perfect timing — an unrealistic condition for most investors. In practice, lump-sum investors face extreme variance depending on their entry point: buying at a cycle peak can mean years of underwater positions. Weekly DCA sits at the optimal intersection of return performance (202%) and low volatility exposure, making it the recommended frequency for most investors.
| Frequency | Total Invested ($10/unit) | Cumulative Return | vs. Lump Sum | Volatility Exposure | Transactions (5 Years) |
|---|---|---|---|---|---|
| Daily | ~$18,250 | ~195% | -1 to 3% lower | Lowest | ~1,825 |
| Weekly | ~$2,610 | 202% | -5 to 10% lower | Low | ~260 |
| Monthly | ~$600 | ~170% | -25 to 75% lower | Medium | ~60 |
| Lump Sum | 1 purchase | ~220%+ | Baseline | Highest | 1 |
Why does weekly DCA outperform daily despite having one-seventh the transaction count? Two factors. First, daily buying accumulates significantly more in fees over time. Second, intraday noise means daily DCA occasionally catches needless high-price buys driven by short-term spikes. Monthly DCA, on the other hand, concentrates all buying power into a single day per month, making the outcome heavily dependent on that particular day's price — essentially introducing a luck factor. Weekly DCA occupies the sweet spot: enough frequency to smooth out price volatility, but not so much that fee drag and noise erode the return advantage.
Optimal DCA Timing: Which Day, Date, and Hour Perform Best?
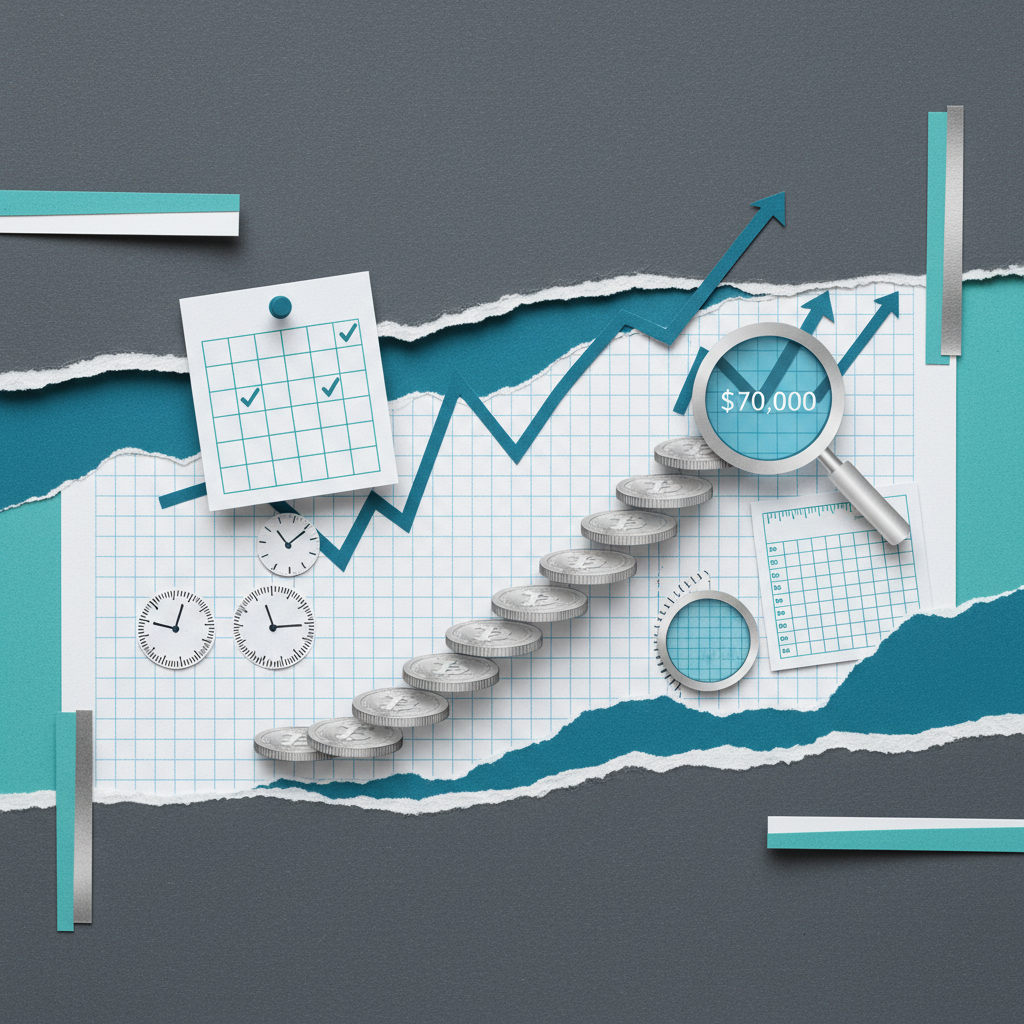
While the entire philosophy of DCA is about removing timing pressure, minor statistical edges do exist when choosing specific days and times for execution. According to River Financial's 5-year backtesting data, buying on Mondays showed a 14.36% theoretical edge compared to the weekly average (Source: River Financial). However, the actual cumulative difference over a full 5-year period amounted to just $55.65 — a 1.2% gap. The takeaway is clear: consistency of execution matters exponentially more than day selection. For monthly DCA, buying on the 1st or 2nd of each month showed theoretical advantages of 6.83% and 3.73% respectively versus the monthly average. The optimal time of day was 12–1 PM Eastern (approximately 2–3 AM KST), where the probability of buying at the daily low was 6.28% and the probability of buying at the daily high was just 1.91%.
These data points are interesting as a tiebreaker, but they should never be the primary decision factor. The single most important variable in DCA success is not stopping. Setting up a Monday auto-buy and forgetting about it will capture a near-optimal timing profile automatically, without any of the mental overhead of trying to pick the perfect moment each week.
Exchange Auto-Invest Comparison: Binance, Coinbase, Kraken, and Upbit
Effective DCA execution requires exchange-level automation. Manual buying introduces three problems that undermine the strategy: emotional interference, missed executions, and decision fatigue around timing. As of March 2026, all major exchanges offer auto-invest or recurring buy features, but they differ significantly in fees, minimum amounts, supported assets, and frequency options. Fee differences compound substantially over a long DCA horizon. For example, running a $50/week DCA over 5 years on a total investment of ~$13,000, a Binance user (0.10% fee) would pay approximately $13 in total fees, while a Coinbase user (0.50% fee) would pay approximately $65 — a 5x difference that only grows with larger investment amounts and longer time horizons (Source: Koinly).
| Exchange | Trading Fee | Minimum Amount | Frequency Options | Supported Coins | Auto-Invest Feature |
|---|---|---|---|---|---|
| Binance | 0.10% | ~$1 | Daily / Weekly / Bi-weekly / Monthly | 200+ coins | Auto-Invest |
| Coinbase | 0.40–0.60% | $1 | Daily / Weekly / Bi-weekly / Monthly | 200+ coins | Recurring Buy |
| Kraken | 0.25% / 0.40% | $10 | Weekly / Bi-weekly / Monthly | 100+ coins | Recurring Buy |
| Upbit | 0.05% | ₩5,000 (~$3.50) | Daily / Weekly / Monthly | BTC, ETH, XRP, SOL | Coin Collector |
Binance offers the strongest all-around package for global users: competitive 0.10% fees, the widest coin selection (200+), and flexible scheduling including bi-weekly options. Coinbase charges 4–6x more in fees but offers a cleaner user experience and is the default for many US-based investors. Kraken sits in the middle on fees but lacks daily frequency. Upbit offers the lowest fee at 0.05% but supports only four coins and is primarily used in the Korean market.
How to Set Up DCA Auto-Invest: Binance and Coinbase Step-by-Step
Setting up DCA automation is a one-time task that takes under five minutes on most exchanges. Once configured, your recurring purchases execute automatically as long as your account stays funded — removing the temptation to second-guess, delay, or abandon your strategy during volatile markets. Below are step-by-step instructions for the two most widely used platforms globally: Binance Auto-Invest and Coinbase Recurring Buy. The core principle is the same on both platforms: choose a coin, set a frequency, define an amount, and activate. After initial setup, no further action is required beyond maintaining your funding balance.
Binance Auto-Invest
Step 1: Open Binance (app or web) and navigate to Earn → Auto-Invest.
Step 2: Select your target coin. Over 200 assets are supported, including BTC, ETH, SOL, and most major altcoins.
Step 3: Choose your purchase frequency — Daily, Weekly, Bi-weekly, or Monthly — and set your preferred execution time.
Step 4: Enter your purchase amount in USDT. The minimum is approximately $1.
Step 5: Click Subscribe to activate. The fee is 0.10% per transaction (maker/taker identical).
Coinbase Recurring Buy
Step 1: Open Coinbase and navigate to the asset page for your target coin (e.g., Bitcoin).
Step 2: Tap Buy, then select Recurring Buy (or "Repeat this purchase").
Step 3: Set your purchase amount. The minimum is $1.
Step 4: Choose your frequency — Daily, Weekly, Bi-weekly, or Monthly — and select your preferred day.
Step 5: Confirm and activate. Fees range from 0.40–0.60% per transaction depending on payment method.
On both platforms, the only ongoing requirement is keeping your funding balance (USDT on Binance, USD on Coinbase) sufficient to cover each scheduled purchase. If the balance is insufficient at execution time, most exchanges will skip that purchase rather than generating an error — so setting up automatic deposits from your bank can eliminate this risk entirely.
Institutional DCA: Strategy's $54 Billion Bitcoin Accumulation
The most powerful validation that DCA works at any scale comes from Strategy (formerly MicroStrategy), which has invested a total of $54 billion to accumulate 717,131 BTC at an average cost of approximately $76,000 per coin (Source: Blockonomi). What makes Strategy's approach a textbook DCA case study is not just the total amount — it's the consistency. During the brutal 2022 bear market, when Bitcoin dropped below $16,000 and sentiment hit rock bottom, Strategy did not stop buying. The company invested $276 million that year, a sharp reduction from $2.57 billion in 2021 but critically not zero. Then as recovery took hold, purchases accelerated dramatically: $1.9 billion in 2023, $21.9 billion in 2024, $22.4 billion in 2025, and $4.1 billion year-to-date in 2026.
| Year | Amount Invested | Estimated BTC Acquired | Note |
|---|---|---|---|
| 2020 | $1.1B | ~70,000 BTC | First purchases |
| 2021 | $2.57B | ~54,000 BTC | Bull market buying |
| 2022 | $0.276B | ~8,500 BTC | Bear market — did not stop |
| 2023 | $1.9B | ~56,000 BTC | Recovery acceleration |
| 2024 | $21.9B | ~230,000 BTC | Record annual purchases |
| 2025 | $22.4B | ~230,000 BTC | New annual record |
| 2026 YTD | $4.1B | ~53,000 BTC | Buying through drawdown |
| Total | $54B | 717,131 BTC | Avg cost ~$76,000 |
Strategy's Executive Chairman Michael Saylor has stated: "We're not going to be selling, we're going to be buying bitcoin. I expect we'll be buying bitcoin every quarter forever" (Source: Blockonomi). The institutional lesson for individual investors is straightforward: the biggest regret in DCA is not starting, and the second biggest regret is stopping during a bear market. Strategy's 2022 purchases, made at an average price well below the current level, are now among the most profitable positions in the entire portfolio.
Starting DCA at Fear & Greed 10: Why Current Conditions Are Historically Favorable
As of March 4, 2026, the Fear & Greed Index stands at 10/100 — the Extreme Fear zone — and has remained below 25 for 22 consecutive days. This represents the third most extreme reading since 2018 (Source: BitDegree). Historically, initiating a DCA strategy when the index was at 10 or below has produced 12-month returns averaging 150–200%, with long-term upside reaching into the hundreds or thousands of percent (Source: SpotedCrypto). Meanwhile, whale wallets (holding 1,000+ BTC) have accumulated 270,000 BTC — approximately $18.7 billion — over the past 30 days, the largest accumulation wave ever recorded. The smart money appears to be treating this fear event as a buying opportunity of generational proportions.
| Date | Fear & Greed Index | BTC Price | 12-Month Return | Maximum Upside |
|---|---|---|---|---|
| December 2018 | ~8 | $3,200 | +95% | +2,056% (ATH) |
| March 2020 | ~10 | $3,800 | +900% | +1,716% (ATH) |
| June 2022 | ~6 | $17,600 | +58% | +514% ($108K) |
| November 2022 | ~10 | $15,476 | +125% | +597% ($108K) |
| March 2026 | 10 | ~$70,870 | ? | In progress |
Metaplanet CEO Simon Gerovich invoked Warren Buffett's famous maxim on February 7, 2026, when the Fear & Greed Index first plunged into extreme territory: "Be greedy when others are fearful, and be fearful when others are greedy" — and urged aggressive Bitcoin accumulation (Source: U.Today). The Fear & Greed Index remaining below 25 for 22 consecutive days has only occurred twice before in Bitcoin's history — and both instances were followed by major rallies.
BitMEX co-founder Arthur Hayes has projected that "Bitcoin will reach $200,000 in 2026... Dollar liquidity must expand for that to happen" (Source: Yahoo Finance). Whether or not that specific target materializes, the statistical pattern is clear: periods of maximum fear have historically been the most favorable entry points for DCA strategies.
Current Market Snapshot: Binance & OKX Data (March 4, 2026)
As of March 4, 2026 at 21:13 KST, the broader crypto market is showing a broad-based bounce from recent lows. BTC is trading at $70,870 on Binance (+4.59%), with a 24-hour range of $66,158–$71,893 and $2.3 billion in volume. ETH trades at $2,050 (+3.41%), SOL at $89.62 (+5.56%), and XRP at $1.39 (+1.95%). Total crypto market capitalization stands at $2.48 trillion, with BTC dominance at 57.2% and ETH dominance at 10.0%. The Fear & Greed Index remains at 10/100, firmly in Extreme Fear territory and down 4 points from yesterday. On OKX, prices are closely aligned — BTC at $70,881, ETH at $2,051, SOL at $89.64 — confirming tight cross-exchange pricing with minimal arbitrage spread.
Binance Volume Top 10
| # | Coin | Price | 24h Change | Volume (24h) | High | Low |
|---|---|---|---|---|---|---|
| 1 | BTC | $70,870 | +4.59% | $2.3B | $71,893.00 | $66,158.00 |
| 2 | USDC | $1.00 | -0.02% | $1.4B | $1.00 | $1.00 |
| 3 | ETH | $2,050 | +3.41% | $1.2B | $2,092.90 | $1,929.56 |
| 4 | SOL | $90 | +5.56% | $478.0M | $91.48 | $82.50 |
| 5 | XRP | $1.39 | +1.95% | $234.0M | $1.43 | $1.34 |
| 6 | PAXG | $5,212 | +0.22% | $208.0M | $5,236.85 | $5,027.33 |
| 7 | USD1 | $1.00 | -0.02% | $191.3M | $1.00 | $1.00 |
| 8 | DOGE | $0.09 | +1.88% | $112.5M | $0.09 | $0.09 |
| 9 | BNB | $651 | +3.22% | $98.6M | $654.83 | $621.00 |
| 10 | ENSO | $1.33 | -2.84% | $84.6M | $1.38 | $1.28 |
Binance Futures: Funding Rates, Open Interest, and Long/Short Ratios
Derivatives data reveals a mixed positioning landscape. BTC's funding rate is a neutral 0.0025%, while ETH funding is negative at -0.0071%, suggesting more short-heavy positioning on Ethereum. DOGE shows the most bearish skew with funding at -0.0088%. Open interest across the top contracts totals over $12.5 billion, with BTC alone accounting for $6.3 billion and ETH at $4.2 billion. Long/short ratios show BTC skewing slightly short (47.1% long / 52.9% short), while altcoins like DOGE (67.4% long) and XRP (65.2% long) show significant crowded-long positioning.
| Coin | Funding Rate | Open Interest | Long / Short |
|---|---|---|---|
| BTC | 0.0025% | $6.3B | 47.1% / 52.9% |
| ETH | -0.0071% | $4.2B | 53.7% / 46.3% |
| SOL | 0.0011% | $877.4M | 60.7% / 39.3% |
| XRP | -0.0019% | $384.1M | 65.2% / 34.8% |
| DOGE | -0.0088% | $187.6M | 67.4% / 32.6% |
| BNB | 0.0000% | $336.4M | N/A |
| ADA | -0.0070% | $81.4M | N/A |
| AVAX | 0.0083% | $77.2M | N/A |
| DOT | 0.0037% | $44.5M | N/A |
| LINK | 0.0038% | $78.8M | N/A |
DCA Action Plan: Key Principles for Execution
- Set Up Weekly (Monday) Auto-Invest — Monday purchases showed the strongest 5-year backtesting edge. Use Binance Auto-Invest or Coinbase Recurring Buy (Source: River Financial)
- Commit to a Minimum 3-Year Horizon — DCA returns scale dramatically with time: 202% at 5 years, 1,648% at 10+ years. Short-term DCA risks catching only one phase of the cycle (Source: Nasdaq)
- Consider Extra Buys During Extreme Fear — Adding supplemental purchases when the Fear & Greed Index drops below 25 boosted 7-year returns to 1,145% vs. 1,046% for plain buy-and-hold (Source: dcabtc.com)
- Minimize Fee Drag — Binance (0.10%) charges 4–6x less than Coinbase (0.40–0.60%). Over a 5-year weekly DCA, this difference compounds significantly
- Start with BTC — Bitcoin has the longest track record of DCA outperformance. Consider adding ETH or other assets only after establishing a consistent BTC DCA habit
- Never Emotionally Pause — Strategy continued buying through the 2022 bear market. Stopping DCA during drawdowns eliminates the primary mechanism through which DCA generates its edge: buying more units at lower prices
- Watch Whale Behavior — Wallets holding 1,000+ BTC accumulated 270,000 BTC in the past 30 days. Large capital is already in accumulation mode (Source: SpotedCrypto)
One important caveat: DCA is not a guarantee of profits. If applied to an asset in a permanent structural decline, DCA simply averages down into a losing position. The strategy requires conviction that the underlying asset will appreciate over the long term. Bitcoin's 16-year track record supports this thesis, but past performance is never a guarantee of future results. Only invest money you can afford to hold — and potentially lose — for multiple years.
Frequently Asked Questions
What is DCA (dollar-cost averaging) in crypto?
DCA (Dollar-Cost Averaging) is an investment strategy where you buy a fixed dollar amount of a cryptocurrency at regular intervals — daily, weekly, or monthly — regardless of the current price. When prices are high, your fixed amount buys fewer units; when prices are low, it buys more. This automatically lowers your average cost basis over time. Bitcoin weekly DCA returned 202% over a 5-year backtesting period (Source: Nasdaq).
What are the historical returns of Bitcoin DCA?
A weekly $10 DCA over 5 years (2019–2024) returned 202%, turning $2,610 into $7,913. Fear-based DCA — buying only when the Fear & Greed Index dropped below 25 — returned 1,145% over 7 years (2018–2025). A monthly $100 DCA since 2014 returned 1,648%, turning $35,700 into approximately $589,000. Results vary depending on the start date and market conditions, and past performance does not guarantee future returns.
Is daily, weekly, or monthly DCA best for Bitcoin?
Weekly DCA offers the best balance of return and efficiency. Over a 5-year backtest (2019–2024), weekly DCA returned 202% compared to 195% for daily and 170% for monthly. Weekly captures effective price averaging with roughly one-seventh the transaction count — and fee burden — of daily DCA. For investors with smaller budgets, monthly DCA is still effective; the most important factor is consistency, not frequency.
How do I set up auto-invest DCA on Binance?
On Binance, go to Earn → Auto-Invest. Select your target coin from 200+ supported assets. Choose your frequency (Daily, Weekly, Bi-weekly, or Monthly) and enter your purchase amount in USDT (minimum ~$1). Click Subscribe to activate. The fee is 0.10% per transaction. Keep your USDT balance funded to ensure uninterrupted execution.
Should I start DCA when the Fear & Greed Index is at extreme fear?
Historically, extreme fear has been the most favorable starting point for DCA. In December 2018 (index ~8), March 2020 (~10), June 2022 (~6), and November 2022 (~10), Bitcoin delivered 12-month returns ranging from +58% to +900%. All four instances of sub-10 readings preceded substantial long-term rallies. However, past patterns do not guarantee future outcomes, and investors should only use funds they can afford to hold for an extended period.
Sources
- $10 Weekly Bitcoin DCA Yields 202% Return, Nasdaq
- DCA BTC Calculator, dcabtc.com
- Bitcoin Dollar Cost Average, bitcoindollarcostaverage.com
- Best Time and Day to DCA Bitcoin, River Financial
- How Michael Saylor Turned Strategy Into the Largest Corporate Bitcoin DCA Operation, Blockonomi
- Whales 270K BTC Accumulation, Fear & Greed 10, SpotedCrypto
- Smash Buy vs DCA, Bull Bitcoin
- Crypto Fear and Greed Index, BitDegree
- Metaplanet CEO Quotes Buffett, U.Today
- Crypto Exchange With Lowest Fees, Koinly
- Bitcoin Rally and Pullback Statistics, Trade That Swing
This article is for informational purposes only and does not constitute investment advice. Cryptocurrency investments carry the risk of total loss of principal. All investment decisions should be made based on your own judgment and risk tolerance. Past performance does not guarantee future results.