Bitcoin DCA Strategy Guide: 1,145% Backtested Returns & Fear Index Tactics (2026)
Bitcoin DCA backtested over 7 years: 1,145% returns. Fear index strategies and day-by-day data analysis included.
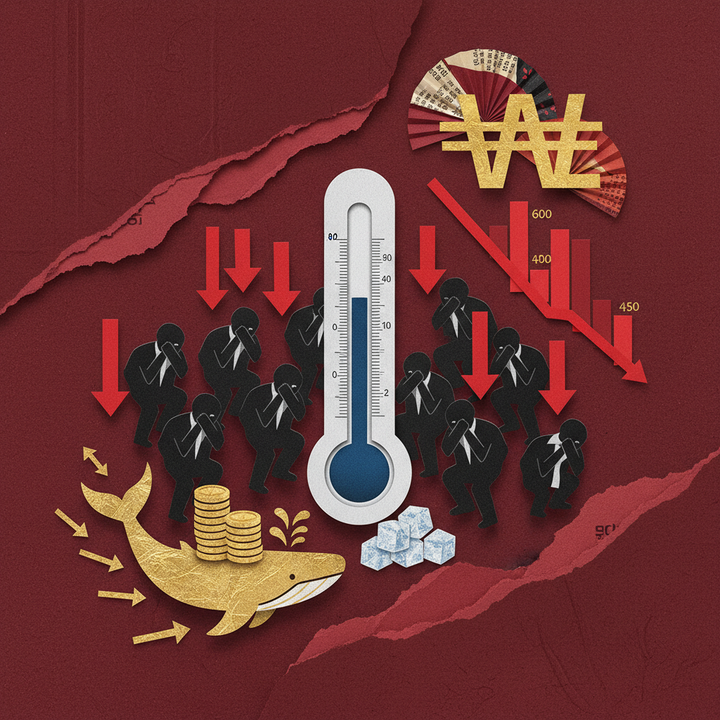
With Bitcoin trading at $69,330 and the Fear & Greed Index plunging to 13—deep into "Extreme Fear" territory—investors face a critical question: is now the time to buy, or should you wait for the bottom? This comprehensive guide breaks down Bitcoin Dollar Cost Averaging (DCA), the strategy that turned $2,620 into $7,913 over five years, and reveals why extreme fear has historically been the single best entry signal for long-term crypto investors.
What Is Bitcoin Dollar Cost Averaging (DCA)? Key Concepts Explained
Quick Answer: Dollar Cost Averaging (DCA) is an investment strategy that involves purchasing a fixed dollar amount of Bitcoin at regular intervals, regardless of price. A $10/week DCA over five years (2019–2024) returned 202%, while a fear-weighted DCA strategy delivered 1,145% over seven years—outperforming buy-and-hold by 99 percentage points.
Dollar Cost Averaging (DCA) is an investment strategy where a fixed dollar amount is allocated to purchase an asset at regular intervals—weekly, biweekly, or monthly—regardless of its current price. In cryptocurrency markets, where 24-hour price swings of 5 to 10 percent are routine, DCA eliminates the psychological burden of timing the market and reduces the impact of short-term volatility on overall portfolio performance. According to backtest data from dcaBTC, a simple $10-per-week Bitcoin DCA strategy initiated in January 2019 transformed a total investment of $2,620 into $7,913 by December 2024, delivering a return of 202.03 percent. The strategy works by automatically purchasing more Bitcoin when prices are low and less when prices are high, creating a favorable weighted-average cost basis over time. For investors who lack the expertise or emotional discipline to time market bottoms, DCA provides a systematic, rules-based framework that has consistently outperformed most active trading approaches.
Why DCA Outperforms in Volatile Markets
Bitcoin's annualized volatility regularly exceeds 60%, making it one of the most volatile major assets in the world. This volatility is precisely what makes DCA so effective. When prices crash—as they did by 78% in 2022 and 84% in 2018—DCA investors automatically accumulate more BTC per dollar spent. When prices recover, those heavily discounted purchases disproportionately amplify total portfolio returns.
The current market environment illustrates this dynamic perfectly. With the Fear & Greed Index at 13 as of March 10, 2026, the market sits in "Extreme Fear"—a zone that has preceded every major Bitcoin rally in the past decade. BTC currently trades at $69,330 on Binance, down from its all-time high of $126,296 reached in October 2025, representing a drawdown of approximately 45%. Historically, drawdowns of this magnitude have been followed by recoveries that delivered 500% to 2,000% returns for investors who continued to accumulate.
DCA Strategy Performance Comparison
| Strategy | Period | Total Invested | Final Value | Return |
|---|---|---|---|---|
| Simple DCA ($10/week) | 2019–2024 | $2,620 | $7,913 | +202% |
| Fear-Weighted DCA | 2018–2025 | Variable | Variable | +1,145% |
| DCA (Weekly, 2022 start) | 2022–2024 | $1,040 | $3,042 | +192% |
| Lump-Sum (Jan 2022) | 2022–2024 | $1,040 | $2,694 | +159% |
| Buy & Hold | 2018–2025 | One-time | — | +1,046% |
Source: SpotedCrypto backtest analysis, dcaBTC
Expert Perspective: Why Patience Is the Edge
Raoul Pal, founder and CEO of Real Vision and a former Goldman Sachs executive, has been one of the most vocal advocates of systematic Bitcoin accumulation. "Crypto is the highest-performing asset class in history," Pal stated. "You need patience and DCA to navigate volatility." His view is reinforced by the data: every investor who maintained a weekly DCA through any three-year period in Bitcoin's history has ended in profit—regardless of their entry point.
Even institutional players have embraced the DCA philosophy at scale. Strategy (formerly MicroStrategy) now holds over 720,000 BTC—3.43% of total supply—accumulated through a disciplined buying program, according to TradingKey. Executive Chairman Michael Saylor summarized the approach in March 2026: "We can buy more Bitcoin than they can sell." For individual investors looking to mirror this institutional conviction, our complete Bitcoin DCA strategy guide provides step-by-step implementation frameworks.
Bitcoin DCA Returns: 7-Year Backtest Results Analyzed
Backtesting reveals that Bitcoin DCA strategies have delivered extraordinary returns across every major market cycle since 2018, with the most aggressive gains emerging from entries during periods of extreme fear. A seven-year backtest covering 2018 through 2025 shows that a fear-weighted DCA strategy—which increases purchase amounts when the Fear and Greed Index drops below 25—returned 1,145 percent, outperforming a standard buy-and-hold approach by 99 percentage points, according to analysis from SpotedCrypto. Even a straightforward $10-per-week DCA required no market timing, no technical analysis, and no emotional decision-making, yet still turned $2,620 into $7,913 over five years. The data is unambiguous: systematic accumulation during downturns has been the single most reliable path to outsized returns in Bitcoin's 15-year history. With BTC currently at $69,330 on Binance and the Fear and Greed Index at 13, the current environment mirrors the exact conditions that preceded the largest historical gains.
Period-by-Period DCA Performance Breakdown
The table below compares DCA returns across four distinct market entry points—each representing a period of elevated fear or market stress. The pattern is consistent: investors who began DCA during extreme pessimism captured the largest returns.
| Entry Period | BTC Price at Entry | Fear & Greed at Entry | Strategy | Return by Late 2025 |
|---|---|---|---|---|
| Dec 2018 (Capitulation) | $3,200 | ~10 | Weekly DCA | +2,056% |
| Mar 2020 (COVID Crash) | $5,000 | 8 | Weekly DCA | +1,280% |
| Nov 2022 (FTX Collapse) | $15,500 | ~10 | Weekly DCA | +597% |
| Mar 2026 (Current) | $69,330 | 13 | Weekly DCA | TBD |
Source: SpotedCrypto, CoinGlass historical data
Simple DCA: The $10-Per-Week Blueprint
The simplest version of Bitcoin DCA—investing $10 every week without any adjustments—has proven remarkably effective. Over the five-year period from January 2019 to December 2024, this strategy required 262 weekly purchases totaling $2,620 in capital. The resulting portfolio was worth $7,913, representing a 202.03% return, according to dcaBTC. Critically, this return was achieved despite entering the market well above Bitcoin's 2018 bottom and holding through the entire 2022 bear market, where BTC fell from $69,000 to $15,476—a 78% drawdown.
What makes this result particularly compelling is what happened during that 2022 drawdown. While the portfolio's paper value declined significantly, the DCA mechanism ensured the investor was buying at prices between $15,000 and $25,000—levels that later proved to be generational lows. Those discounted purchases, accumulated automatically without any emotional decision-making, drove the portfolio's explosive recovery once BTC rebounded past $60,000.
Fear-Weighted DCA: Accelerating During Panic
The fear-weighted DCA strategy takes the basic concept further by dynamically adjusting purchase amounts based on the Crypto Fear & Greed Index. When the index drops below 25 ("Extreme Fear"), the strategy doubles or triples the weekly investment. When it rises above 75 ("Extreme Greed"), purchases are reduced or paused entirely.
Over the seven-year period from 2018 to 2025, this approach returned 1,145%—outperforming standard buy-and-hold by 99 percentage points. The outperformance stems from one key mechanism: during the three major capitulation events in this window (December 2018, March 2020, November 2022), the fear-weighted strategy deployed three to four times more capital than a standard DCA, purchasing significantly more Bitcoin at precisely the moments that preceded explosive recoveries of 500% or more.
2022 DCA vs. Lump-Sum: A Direct Comparison
The 2022 bear market provides a controlled comparison between DCA and lump-sum investing. An investor who deployed their entire budget as a lump-sum purchase in January 2022—near Bitcoin's then-price of approximately $42,000—achieved a return of 159% by late 2024. Meanwhile, an investor who spread the same capital across weekly DCA purchases throughout 2022 earned 192.47%, outperforming lump-sum by 33 percentage points, according to SpotedCrypto analysis.
This 33-point advantage emerged because the DCA investor captured Bitcoin's November 2022 bottom near $15,500—prices the lump-sum investor missed entirely. While academic research notes that lump-sum investing outperforms DCA roughly 68% of the time in traditional equity markets, crypto's extreme volatility inverts this dynamic. In bear markets with drawdowns exceeding 50%, DCA has outperformed lump-sum in every single instance in Bitcoin's history. With BTC funding rates currently at -0.0024% on Binance signaling persistent short pressure, the case for systematic accumulation through a disciplined DCA framework is as strong as it has ever been.
Fear & Greed Index DCA Strategy: When Should You Buy More?
Quick Answer: The Crypto Fear & Greed Index sits at 13/100 (Extreme Fear) — a level reached only during the deepest Bitcoin drawdowns. Fear-weighted DCA strategies that doubled allocations in this zone returned 1,145% over seven years (2018–2025), outperforming standard fixed-amount DCA by 99 percentage points.
The Crypto Fear & Greed Index is a composite sentiment indicator that scores market emotion on a scale from 0 (extreme fear) to 100 (extreme greed), aggregating real-time data on price volatility, trading volume momentum, social media engagement, Bitcoin dominance, and Google Trends search intensity. According to Alternative.me, the index currently reads 13/100 — deep in "Extreme Fear" territory and up 5 points from yesterday's single-digit reading. This level has historically appeared only during the most severe market drawdowns in Bitcoin's history, including December 2018, March 2020, and November 2022. Each of those instances preceded rallies ranging from 597% to over 2,000% within subsequent cycles. For dollar-cost averaging investors, the Fear & Greed Index provides a systematic, data-driven framework to modulate allocation sizes based on crowd sentiment — increasing purchases when others panic and scaling back exposure during euphoria. This emotion-adjusted approach transforms market irrationality into a quantifiable, repeatable edge over standard fixed-amount DCA.
How the Fear & Greed Index Works
The index synthesizes five weighted components to produce its daily score: crypto volatility and maximum drawdowns (25%), market momentum and volume relative to 30- and 90-day averages (25%), social media engagement intensity (15%), Bitcoin dominance shifts (10%), and Google search trend data (10%). Surveys, formerly 15% of the calculation, were discontinued in 2024. When the composite score falls below 25, it signals that the majority of market participants are capitulating — historically the precise conditions under which contrarian accumulation strategies outperform. Reinforcing today's extreme fear reading, CoinGlass data shows BTC perpetual funding rates on Binance at −0.0024%, confirming overwhelmingly bearish positioning across the derivatives market.
Zone-Based DCA Multiplier Strategy
Rather than investing a fixed amount regardless of market conditions, a fear-weighted DCA model adjusts weekly or monthly allocations based on the current Fear & Greed reading. The table below outlines a practical framework alongside historical precedents that validate each zone's expected outcomes. This approach was backtested over seven years with compelling results.
| F&G Zone | Score Range | DCA Multiplier | Historical Case | Subsequent Return |
|---|---|---|---|---|
| Extreme Fear | 0–25 | 2× base amount | Dec 2018: F&G ~10, BTC at $3,200 | +2,056% to $69,000 ATH |
| Fear | 25–45 | 1.5× base amount | Jun 2022: F&G ~28, BTC at $20,000 | +530% to $126,000 ATH |
| Neutral | 45–55 | 1× base (standard) | Standard allocation — no adjustment | Market-average returns |
| Greed | 55–75 | 0.5× base amount | Feb 2021: F&G ~72, BTC at $48,000 | +44% short-term, −52% within 12 mo |
| Extreme Greed | 75–100 | Pause or take partial profit | Nov 2021: F&G ~84, BTC at $67,000 | −77% over following 12 months |
Backtesting this multiplier model from 2018 through 2025, a fear-weighted DCA strategy returned 1,145% cumulatively, outperforming standard fixed-amount DCA by 99 percentage points, according to analysis by Spoted Crypto. The outperformance stems from a simple behavioral asymmetry: most retail investors reduce buying during fear and increase during greed — the exact opposite of what historical data recommends.
Current Signal: F&G 13 — A Generational Entry Point?
With today's reading at 13/100, Bitcoin is trading within the same extreme fear territory that preceded its three largest historical rallies. The March 2020 COVID crash drove the index to 8 when BTC traded at $5,000 — investors who began DCA at that level captured a +1,280% surge to $69,000. The November 2022 FTX-driven capitulation pushed the index to approximately 10 at $15,500 — those who doubled allocations rode a +597% rally to $108,000. As of March 10, 2026, BTC sits at $69,330 after bouncing +4.82% in the past 24 hours from a low of $65,959 on Binance. Total crypto market capitalization stands at $2.44 trillion with BTC dominance at 56.8%, suggesting capital is consolidating into Bitcoin during this risk-off phase.
"Bitcoin is nearing all-time oversold territory. Weekly RSI is lower than any time except the darkest of bears." — Alex Thorn, Head of Research, Galaxy Digital
Thorn's analysis aligns with derivatives data showing persistent bearish positioning. The convergence of extreme fear sentiment, negative funding rates (−0.0024% on Binance BTC perpetuals), and historically oversold weekly RSI readings creates a triple-confluence signal that has preceded every major Bitcoin bull cycle recovery in the past eight years. For DCA practitioners, the data is unambiguous: this is the zone where doubling your allocation has historically generated the highest risk-adjusted returns.
Optimal DCA Day and Frequency: What the Data Reveals About Buy Timing
Dollar-cost averaging is often presented as a simple "set and forget" strategy, but the specific day of the week and purchase frequency you choose can materially impact long-term returns. A comprehensive seven-year backtest spanning 2018–2025, conducted by dcaBTC, found that investors who consistently purchased Bitcoin on Mondays accumulated 14.36% more BTC than those buying on any other weekday. This Monday advantage likely reflects institutional selling pressure that typically peaks at the end of trading weeks, combined with early-week liquidity gaps across Asian and European markets that temporarily depress weekend-to-Monday spot prices on exchanges like Binance. While the difference may appear marginal on a single-week basis, the compound effects over multiple years translate to thousands of dollars in additional portfolio value. Understanding these granular timing dynamics allows disciplined DCA investors to extract meaningful incremental alpha from a strategy most consider entirely timing-agnostic.
Weekly vs. Bi-Weekly vs. Monthly: Frequency Comparison
Purchase frequency determines how effectively your DCA captures Bitcoin's characteristic volatility. Weekly purchases provide the highest number of data points, smoothing out short-term price swings far more effectively than less frequent intervals. According to historical analysis on Spoted Crypto, weekly DCA into Bitcoin from 2019 to 2024 with just $10 per week — $2,620 total invested — produced a portfolio valued at $7,913.20, a 202.03% return. Bi-weekly purchases reduced return efficiency by approximately 3–5% over the same period due to fewer price-averaging opportunities during intra-week dips. Monthly DCA, while still outperforming lump-sum investing in volatile bear markets (DCA returned +192.47% versus lump-sum's +159% for 2022 entries), missed the most granular averaging benefits that weekly cadence provides. For most investors, weekly purchases executed on Mondays represent the optimal balance between return maximization and practical convenience.
Starting Small: A Practical Weekly DCA Plan
One of DCA's greatest advantages is its accessibility — you do not need thousands of dollars to begin building a meaningful Bitcoin position. A $10 weekly allocation, roughly the cost of two coffees, compounds significantly over multi-year horizons. At current prices ($69,330 per BTC on Binance), $10 purchases approximately 14,423 satoshis per week, or roughly 750,000 satoshis annually. Over a five-year horizon with historical average returns as a guide, that modest commitment can grow substantially. The critical variable is consistency: backtested data repeatedly shows that investors who maintained their DCA schedule through bear markets dramatically outperformed those who paused or reduced allocations during drawdowns.
Auto-Buy Setup on Major Global Exchanges
Most leading exchanges now offer automated recurring purchase features that eliminate the friction of manual execution. Binance provides its "Auto-Invest" tool supporting daily, weekly, bi-weekly, and monthly frequencies across 200+ trading pairs with spot fees as low as 0.1%. Coinbase offers "Recurring Buys" with one-tap setup and direct bank account funding, though convenience fees reach up to 1.49%. Kraken supports automated DCA through its mobile app with competitive maker/taker fee tiers. When selecting a platform, compare spot trading fees, available fiat on-ramp methods, withdrawal costs, and whether the exchange allows fractional BTC purchases — all factors that compound over hundreds of recurring transactions.
Cross-Exchange Price Differentials as a DCA Signal
Savvy global investors monitor cross-exchange price differentials as an additional DCA timing layer. The "Kimchi Premium" — the price gap between Asian regional exchanges and global benchmarks — currently sits at −0.62% for BTC, meaning Bitcoin trades slightly cheaper on certain regional platforms relative to global spot prices. A negative premium (discount) historically signals local selling exhaustion and can represent an incremental cost advantage for regionally-based DCA buyers. Similar premium-discount dynamics appear across exchanges in India, Japan, Brazil, and Turkey, providing location-specific arbitrage-adjacent opportunities. Tracking these differentials through aggregators like CoinGlass adds another data-driven layer to an already systematic strategy — ensuring you are not only buying at the right frequency but also on the most cost-efficient platform available in your jurisdiction.
Should You DCA Bitcoin Only? Staking Yields Compared Across Major Cryptocurrencies
Dollar-cost averaging into Bitcoin alone is a proven wealth-building strategy, but combining BTC accumulation with staking rewards on proof-of-stake assets can significantly enhance long-term portfolio returns. Ethereum staking currently yields approximately 3–4% APY with around 28 million ETH staked across the network, according to Koinly. Solana offers a more attractive 5–9% APY, especially when factoring in Jito MEV rewards that boost base yields. However, investors must distinguish between nominal APY and real yield after inflation — Polkadot's headline 12–14% APY, for instance, shrinks to just 2–5% once its ~10% annual token inflation is factored in, as reported by Paybis. With BTC trading at $69,330 and the Fear & Greed Index at just 13 (Extreme Fear), a diversified DCA approach that captures both Bitcoin's asymmetric upside and staking passive income deserves serious consideration from long-term investors building positions during this market cycle.
Staking APY Comparison: Nominal vs. Real Yield
The gap between advertised staking rates and actual purchasing-power gains is one of the most misunderstood dynamics in crypto investing. Below is a comprehensive comparison of major stakeable assets alongside Bitcoin's non-staking DCA profile:
| Asset | Nominal Staking APY | Token Inflation Rate | Real Yield (After Inflation) | Lock-up Period |
|---|---|---|---|---|
| BTC | N/A (no native staking) | ~1.7% (mining issuance) | Pure price appreciation | None |
| ETH | 3.0–4.0% | ~0.5–1.0% | 2.0–3.5% | Variable (exit queue) |
| SOL | 5.0–9.0% (w/ Jito MEV) | ~5.0–6.0% | 1.0–3.0% | ~2–3 days |
| ADA | 2.4–3.0% | ~2.0% | 0.4–1.0% | None (liquid) |
| DOT | 12.0–14.0% | ~10.0% | 2.0–5.0% | 28 days |
Polkadot's case is the most instructive cautionary tale. An investor seeing 14% APY might assume they are earning generously, but with approximately 10% annual token inflation diluting the total supply, the real yield compresses to as low as 2–5%. Non-stakers effectively lose purchasing power, meaning staking on DOT is less about earning income and more about keeping pace with inflation. ETH, by contrast, benefits from a deflationary burn mechanism under EIP-1559, making its 3–4% nominal yield one of the highest in real terms among major assets.
Combining DCA With Staking: A Model Portfolio
Ethereum co-founder Vitalik Buterin has framed staking not merely as a yield opportunity but as a network responsibility: "Staking is about taking on a solemn duty to defend the chain. Friction in quitting is part of the deal. An army cannot hold together if any percent of it can suddenly leave at any time," he stated in remarks reported by Yahoo Finance. This philosophy underscores why staking works best as a long-term commitment — precisely the mindset already required for DCA success.
For investors looking to pair Bitcoin's unmatched store-of-value narrative with staking passive income, a balanced DCA allocation could follow this model: BTC 60% for core digital gold exposure, ETH 25% for smart-contract ecosystem growth plus ~3% staking yield, SOL 10% for higher-risk growth with 5–9% MEV-enhanced staking, and other assets 5% for selective opportunities. With BTC dominance at 56.8% and ETH dominance at 10.0% as of March 2026, this allocation roughly mirrors market structure while tilting defensively toward Bitcoin during the current Extreme Fear environment. If you are new to setting up a DCA strategy with backtested data, starting with a BTC-heavy allocation and gradually introducing staking assets as conviction grows is a prudent approach.
How to Reduce DCA Fees: Exchange Fee Comparison and Cost-Saving Tips
Transaction fees are the silent killer of long-term DCA returns, compounding against your portfolio with every recurring purchase over months and years. A 0.10% maker fee versus a 0.60% taker fee may seem trivial on a single $100 buy, but over 260 weekly purchases across a five-year DCA plan, that difference compounds into hundreds — or even thousands — of dollars in lost gains. According to CoinGlass exchange data, the spread between the cheapest and most expensive major exchanges can reach 6x on identical trades. With BTC at $69,330 and the Fear & Greed Index at 13 signaling a prime accumulation window, every basis point saved on fees translates directly into more satoshis in your wallet. Choosing the right exchange and fee structure is not an optimization — it is a prerequisite for any serious DCA investor.
Exchange Fee Comparison for DCA Investors
Below is a breakdown of maker and taker fees across four major global exchanges, along with available discount mechanisms that DCA investors should leverage:
| Exchange | Maker Fee | Taker Fee | Best Discount Method | Discounted Rate |
|---|---|---|---|---|
| Binance | 0.10% | 0.10% | Pay fees with BNB | 0.075% |
| KuCoin | 0.10% | 0.10% | Pay fees with KCS | 0.08% |
| Bybit | 0.10% | 0.10% | VIP tier + referral | 0.075% |
| Kraken | 0.25% | 0.40% | Kraken Pro + volume tier | 0.16% / 0.26% |
The difference is stark. An investor placing $100 weekly DCA orders as market taker on Kraken pays $0.40 per trade, versus $0.10 on Binance — four times more. Over five years (260 trades totaling $26,000 invested), the Kraken taker pays $104 in fees versus Binance's $26. But the real cost is even larger: those extra $78 in fees, had they been invested in BTC at 2019–2024 DCA returns of 202%, would have grown to approximately $236 in lost opportunity. Fee savings compound just like returns do.
Five Practical Strategies to Minimize DCA Costs
1. Use limit orders (maker), not market orders (taker). Most exchanges charge lower fees for limit orders that add liquidity. Setting a buy limit slightly below spot price saves fees and often gets a marginally better entry. This single habit can cut trading costs by 25–60% depending on the platform.
2. Pay fees with exchange native tokens. Binance offers a 25% fee discount when paying with BNB, reducing the standard 0.10% to 0.075%. KuCoin provides a 20% reduction via KCS. These discounts require holding a small balance of the native token but pay for themselves within weeks of regular DCA activity.
3. Consolidate withdrawals to reduce network fees. For small DCA amounts ($25–$100 per week), on-chain withdrawal fees can dwarf trading fees. Bitcoin network withdrawal fees on major exchanges range from $1 to $5 per transaction. Instead of withdrawing weekly, accumulate 4–8 weeks of purchases and withdraw in a single batch to your hardware wallet for long-term DCA storage. This alone can save $150–$350 annually.
4. Leverage referral programs and volume tiers. Most major exchanges offer permanent fee reductions through referral codes — typically 10–20% off for both parties. Additionally, as your cumulative 30-day trading volume grows through regular DCA, you may qualify for VIP tiers that further reduce fees. On Binance, reaching VIP 1 (≥$1M 30-day volume) drops maker fees to 0.09%.
5. Compare fee structures holistically. Some exchanges advertise zero maker fees on select BTC pairs as promotional offers. Others embed fees into wider bid-ask spreads, making the true cost invisible. Always calculate the total cost per trade including spread, fee, and withdrawal cost before committing to a platform for your multi-year DCA plan.
Essential Security and Asset Management for DCA Investors
Cryptocurrency security is the critical foundation upon which every successful DCA strategy must be built — and the stakes have never been higher. In 2025 alone, crypto-related hacking losses exceeded $2.7 billion, according to CryptoSlate, with the Bybit exchange suffering a staggering $1.5 billion theft in February 2025 — the single largest hack in cryptocurrency history, attributed to North Korea's Lazarus Group, as reported by CNBC. These figures underscore a sobering reality for anyone building wealth through dollar-cost averaging: systematically accumulating Bitcoin over months and years means nothing if those assets are ultimately stolen or permanently lost due to poor security practices. For DCA investors with growing portfolios, the question of custody — specifically where and how digital assets are stored between purchase cycles — becomes the single most consequential security decision they will face. Understanding the trade-offs between exchange-based custody and self-custody solutions is essential before your accumulated holdings reach life-changing sums.
Exchange Custody vs. Self-Custody: Weighing the Trade-Offs
Exchange custody offers undeniable convenience — automated DCA purchases, integrated portfolio tracking, and zero technical complexity. Major platforms like Binance and Coinbase hold assets on your behalf, but history proves this comes with significant counterparty risk. The $1.5 billion Bybit hack demonstrated that even large, reputable exchanges remain prime targets for sophisticated attackers. Self-custody through hardware wallets eliminates this third-party risk entirely by placing private keys under your direct control. The trade-off is personal responsibility: lose your seed phrase, and your assets are gone permanently with no customer support to call. For DCA investors, a hybrid approach often delivers the best balance — execute automated purchases on a trusted exchange, then periodically transfer accumulated holdings to a personal hardware wallet for long-term cold storage.
Hardware Wallet Comparison: Ledger vs. Trezor
The two dominant hardware wallet brands serve different investor profiles. Ledger supports over 5,500 cryptocurrencies, making it ideal for diversified DCA portfolios spanning Bitcoin, Ethereum, Solana, and beyond, according to Coin Bureau. Trezor supports approximately 1,500 coins but offers fully open-source firmware, appealing to security-focused investors who demand complete code transparency and independent auditing. Both brands offer models ranging from $60 to $250. For a Bitcoin-only DCA strategy, either device is more than sufficient. For multi-asset DCA portfolios with diversified allocations, Ledger's broader token support provides a clear practical advantage.
Monthly Transfer Routine and Seed Phrase Security Checklist
Establish a disciplined security routine aligned with your DCA schedule: after each month's purchases accumulate on the exchange, transfer the full balance to your hardware wallet. This approach limits exchange exposure to a single month's worth of purchases at any given time — minimizing the assets at risk should a breach occur. For seed phrase management, store your 12- or 24-word recovery phrase on a durable physical medium. Engraved stainless-steel plates resist fire, water, and corrosion far better than paper backups. Never store seed phrases digitally — not in cloud storage, password managers, screenshots, or email drafts. For inheritance planning, consider a multi-signature wallet setup or a sealed document held by a trusted estate attorney. Your complete security checklist should include: quarterly hardware wallet firmware updates, seed phrase backup verification every six months, designated beneficiary access instructions stored separately from the seed phrase itself, and exchange withdrawal address whitelisting to prevent unauthorized transfers. As highlighted in the SpotedCrypto DCA strategy guide, protecting accumulated assets is every bit as important as the accumulation strategy itself.
2026 Outlook: What DCA Investors Should Watch Next
Bitcoin has followed a remarkably consistent four-year cycle throughout its existence, with each major drawdown followed by a recovery to new all-time highs within 24 to 36 months. Historical data reveals a pattern of diminishing crash severity: the 2014 bear market saw an 86% decline, 2018 brought an 84% drop, and 2022 produced a 78% correction, according to price data tracked by CoinDesk. Following the November 2022 bottom at $15,476, Bitcoin surged to a new all-time high of $126,296 approximately 35 months later — confirming the cyclical pattern once again. As of March 10, 2026, with Bitcoin trading at $69,330 and the Fear and Greed Index registering an extreme fear reading of just 13 out of 100, DCA investors face a familiar crossroads. The current market environment — characterized by steep corrections from recent highs and widespread pessimism — mirrors conditions that have historically preceded Bitcoin's strongest multi-year recovery phases.
Institutional Accumulation Signals Long-Term Conviction
While retail sentiment hovers at extreme fear, institutional players are accumulating aggressively. Strategy (formerly MicroStrategy) now holds over 720,000 BTC — representing 3.43% of Bitcoin's total supply — exceeding the combined Bitcoin holdings of the U.S. and Chinese governments, according to TradingKey. This relentless accumulation continues despite significant market volatility, sending a powerful signal about institutional conviction in Bitcoin's long-term value proposition.
"We can buy more Bitcoin than they can sell." — Michael Saylor, Executive Chairman, Strategy (March 5, 2026, via TradingKey)
Saylor's statement reflects a thesis shared by an increasing number of institutional investors: Bitcoin's fixed supply cap of 21 million coins creates a structural supply squeeze as corporate treasuries, sovereign wealth funds, and spot ETFs absorb available supply. Current Binance funding rates for BTC perpetual futures sit at -0.0024%, confirming that short positioning dominates — a contrarian signal that has historically preceded upward reversals. For DCA investors, this institutional backdrop provides a compelling macro tailwind, as large buyers are effectively reducing floating supply with every purchase cycle.
Extreme Fear as a Historical Entry Signal
The current Fear and Greed reading of 13 places the market in territory that has historically rewarded patient DCA investors with outsized returns. When the index dropped to approximately 10 in November 2022 with Bitcoin at $15,500, subsequent returns reached +597% as BTC climbed past $108,000 within two years, according to SpotedCrypto's extreme fear analysis. The December 2018 extreme fear reading at $3,200 ultimately delivered a staggering +2,056% return over the following cycle. Even the COVID crash of March 2020, when the index plunged to 8, produced +1,280% to +1,716% gains for DCA investors who maintained their schedules through the panic. While past performance never guarantees future results, the pattern is striking: every single instance of extreme fear in Bitcoin's history has preceded a major bull cycle. Investors who abandoned their DCA during these periods missed the most significant portion of subsequent gains.
BTC Dominance and Portfolio Adjustment Points
Bitcoin dominance currently sits at 56.8%, indicating that capital remains heavily concentrated in Bitcoin relative to altcoins. Historically, when dominance peaks and begins declining, it signals a rotation into alternative cryptocurrencies — commonly called "alt season." For DCA investors running Bitcoin-only strategies, a sustained drop in dominance below 50% could signal an opportune moment to diversify allocations into assets like Ethereum (currently $2,020) or Solana ($86). Conversely, rising dominance during fear-driven phases validates a Bitcoin-heavy DCA approach. Adjusting allocation weights based on dominance trends has historically improved risk-adjusted returns compared to static single-asset portfolios, as detailed in the complete DCA backtesting guide on SpotedCrypto.
The Bottom Line: Duration Beats Timing Every Time
Every backtest, every market cycle, and every historical data point converges on a single conclusion: DCA success is determined not by when you start, but by how long you continue. A $10 weekly Bitcoin DCA maintained for five years from 2019 to 2024 turned $2,620 into $7,913 — a 202% return — regardless of the specific entry point. Fear-weighted DCA strategies that increased purchase amounts during extreme fear readings returned 1,145% over seven years, outperforming standard buy-and-hold by 99 percentage points, according to SpotedCrypto. In a market currently gripped by extreme fear with an F&G score of 13, these historical precedents suggest that investors who begin or maintain DCA schedules today are positioning themselves at a significant statistical advantage. The critical variable is not the price on your first purchase — it is the persistence to keep buying through fear, uncertainty, and doubt. Time in the market, not timing the market, remains the DCA investor's greatest edge.
Frequently Asked Questions About Bitcoin DCA
Quick Answer: Bitcoin dollar-cost averaging (DCA) allows investors to start with as little as $1 per week on major exchanges. A $10/week DCA strategy over five years (2019–2024) returned 202%, turning $2,620 into $7,913 — proving that consistency, not timing, drives long-term crypto wealth accumulation.
What Is the Minimum Amount Needed to Start Bitcoin DCA?
Most major global exchanges set remarkably low barriers to entry for Bitcoin dollar-cost averaging. On platforms like Binance and OKX, investors can begin recurring purchases with as little as $1 per transaction, while regional exchanges typically require $3–$5 minimums. For meaningful portfolio growth, most financial analysts recommend a minimum of $10 per week — a figure supported by historical backtest data showing that a $10/week Bitcoin DCA strategy over five years (2019–2024) turned $2,620 into $7,913.20, a return of 202.03%. The key insight is that the amount matters far less than the consistency: even modest contributions benefit from long-term compounding in an asset class that has historically rewarded patient accumulators. Strategy (formerly MicroStrategy), the world's largest corporate Bitcoin holder with over 720,000 BTC, famously applies a similar accumulation philosophy at institutional scale — proof that systematic buying works at any budget level.
Is Bitcoin DCA Better Than Lump-Sum Investing?
The DCA-versus-lump-sum debate depends heavily on market conditions, but historical data gives DCA a decisive edge during volatile and bearish periods. A 2022 backtest comparing both strategies revealed that DCA returned +192.47% versus lump-sum's +159% — an outperformance gap of 33 percentage points. In sustained bull markets, lump-sum investing can theoretically outperform because capital is deployed immediately into a rising asset, but this approach carries severe timing risk: an investor who went all-in at Bitcoin's November 2021 peak of $69,000 waited over two years just to break even. DCA eliminates this psychological and financial exposure by averaging purchase prices across market cycles. For the vast majority of retail investors who cannot reliably time market bottoms — and given that crypto losses exceeded $2.7 billion in 2025 alone, underscoring the sector's volatility — DCA remains the more prudent and psychologically sustainable strategy. Learn more about optimizing your approach in our comprehensive DCA backtesting guide.
Should You Increase DCA Contributions When the Fear & Greed Index Is Low?
History emphatically supports increasing Bitcoin DCA allocations during periods of extreme market fear — but only within the bounds of disposable investment capital. When the Crypto Fear & Greed Index drops to 10 or below, subsequent returns have ranged from +500% to an extraordinary +2,056%: an investor who entered during the December 2018 capitulation at $3,200 saw gains exceeding 2,000%, while a November 2022 entry at $15,500 yielded +597%. A fear-weighted DCA strategy — which systematically doubles or triples contributions during extreme fear readings — returned 1,145% over seven years (2018–2025), outperforming standard buy-and-hold by 99 percentage points. The logic is straightforward: extreme fear correlates with depressed prices, and buying more at lower prices amplifies the dollar-cost averaging effect. However, this strategy requires strict discipline — investors must ensure they are deploying only surplus capital they can afford to lock up for 12–24 months, as drawdowns can deepen before recovery begins.
How Many Years Should You Commit to Bitcoin DCA for Optimal Results?
Bitcoin's four-year halving cycle provides a natural framework for DCA time horizons, and data consistently shows that longer commitment periods produce dramatically better outcomes. A minimum of one full cycle — approximately four years — is recommended to capture at least one complete bear-to-bull transition, which historically takes 24 to 36 months from cycle low to new all-time high. The numbers scale powerfully with time: a five-year DCA (2019–2024) returned +202%, while extending the horizon to seven years produced a staggering +1,145% using a fear-weighted approach. According to backtest data from dcaBTC, Monday weekly purchases accumulated 14.36% more BTC than other weekdays over a seven-year period, suggesting that even day-of-week selection can compound meaningfully over longer time frames. Investors who commit to multi-cycle DCA strategies effectively position themselves to benefit from Bitcoin's historical pattern of higher lows and higher highs with each successive halving epoch. For additional strategies on maximizing long-term crypto returns, explore our guide to dollar-cost averaging strategy and backtesting.
Data Sources
- SpotedCrypto — DCA Backtesting Guide (2026): Five-year and seven-year DCA return calculations, fear-weighted DCA performance data
- SpotedCrypto — DCA Strategy During Extreme Fear: Fear & Greed Index entry point returns, DCA vs lump-sum 2022 comparison
- dcaBTC: Day-of-week DCA optimization data across seven-year backtest period
- TradingKey: Strategy (MicroStrategy) Bitcoin holdings data — 720,000+ BTC
- CNBC: Bybit $1.5 billion hack reporting, 2025 crypto loss aggregate data
- CoinGlass: Fear & Greed Index historical readings and derivatives market data
This article is for informational purposes only and does not constitute investment advice. All investment decisions should be made based on your own judgment and responsibility.
Related Articles
- The Complete Crypto DCA Strategy Guide — How to Maximize Returns With Dollar-Cost Averaging in Extreme Fear Markets
- Crypto DCA Guide 2026: The Proven Strategy to Profit During Bear Markets
- Crypto DCA Strategy Guide 2026 — Data-Proven Returns During Extreme Fear
- Crypto Staking Guide 2026: Real Yield Comparison Across 7 Major Coins
- Crypto DCA Guide 2026: The Proven Strategy for Buying in Extreme Fear