Bitcoin Breaks $70K—But The Real Bounce Starts Now. RSI Extreme Oversold Recovery + MACD Golden Cross Setup Signals $100K Path
Bitcoin reclaimed $70,000. But here's what matters: it's not the price—it's what the indicators are screaming. RSI bouncing from extreme lows (20), MACD forming a golden cross setup, Bollinger Bands signaling breakout. We map the technical pathway to $100,000.
Bitcoin just reclaimed $70,000. But price isn't what matters—the technical indicators are sending a more powerful message. RSI is bouncing from extreme oversold territory (20), MACD is setting up a golden cross, and Bollinger Bands are flagging a reversal. This isn't just a bounce. This looks like the start of a genuine bull move.
For technical traders, this is a critical moment. Price tells you the market's psychology; indicators tell you its real strength. Right now, Bitcoin's technical setup is whispering something clear: the worst is over, and a serious uptrend is imminent.
RSI Bouncing From Extreme Lows: When "Strong Hands" Enter
The Relative Strength Index (RSI) oscillates between 0–100. Here's the framework:
- RSI < 30: Oversold—historically a buy signal
- RSI 30–70: Neutral zone
- RSI > 70: Overbought—historically a sell signal
Bitcoin's RSI is currently bouncing from extreme lows (~15–20). This is historically massive.
The historical record:
- November 2022 (FTX Collapse): RSI crashed to 10. Then: 2.6x gain over 6 months ($16K → $42K)
- March 2020 (COVID Shock): RSI dropped to 20. Then: 8x gain over 9 months ($3.6K → $29K)
- January 2015 (China Devaluation Shock): RSI fell to 15. Then: 3.6x gain in 12 months ($180 → $650)
The pattern is unmistakable. When RSI bounces from extreme lows, "strong hands"—institutions, whales, sophisticated traders—are buying. They only accumulate in deep fear.
What's happening now:
- Fast RSI recovery = Powerful reversal signal
- RSI crosses 50 = Trend confirmation
- RSI exceeds 70 = Overbought warning
We're at stage one. The speed of RSI's rise from here will tell us whether this is a weak bounce or the start of a serious bull run.
MACD Golden Cross Setup: The Momentum Inflection Point
Moving Average Convergence Divergence (MACD) measures the convergence and divergence of short-term and long-term momentum. It's three components:
- MACD Line (12-day EMA): The fast-moving line
- Signal Line (9-day EMA): The slow-moving line
- Histogram: The difference between the two
Bitcoin's current MACD setup:
- MACD line is rising through zero → Early buyinf momentum recovery
- Signal line is beginning to turn upward → Golden cross imminent
- Histogram flipping from negative to positive → Shift from selling to buying
Historical precedent:
- March 2020: MACD golden cross → 8x gain over 9 months
- November 2022: MACD golden cross → 2.6x gain over 6 months
- October 2023: MACD golden cross → 2x gain over 3 months
Post-golden-cross performance typically breaks down like this:
- Weeks 1–3 (Immediate): 20–40% upside
- Months 1–3: 50–100% upside
- Months 3–6+: 100–300% upside (cycle-dependent)
The golden cross isn't just a "nice indicator." Historically, it's preceded the strongest uptrends Bitcoin has ever experienced.
Bollinger Bands: Compression Before Explosion
Bollinger Bands measure volatility using a 20-day moving average and standard deviations. Current Bitcoin setup:
- 20-day MA (midline): ~$72,000
- Upper Band: $78,000–$80,000
- Lower Band: $64,000–$66,000
Bitcoin is bouncing from the lower band. This signals:
- Extreme weakness has ended
- Volatility compression followed by expansion is imminent
- The upper band ($78K–$80K) is the next target
Historical pattern: When Bitcoin bounces from Bollinger Band lows, it typically reaches the upper band within 20–30 trading days. At the current trajectory, $75K–$80K could be reached by early March.
Price Targets & Scenarios: The Technical Roadmap
Near-term (1–2 weeks):
- Bull case: RSI accelerates + MACD golden cross forms → $75K–$78K breakout
- Base case: Consolidation at current levels while indicators confirm → $70K–$74K range
- Bear case: Macro shock or profit-taking → $65K retest possible
Medium-term (1–3 months):
- Target 1: $85,000 (Resistance breakout)
- Target 2: $95,000–$100,000 (Previous highs, psychological resistance)
- Target 3: $110,000–$120,000 (2022 resistance, institutional stop-loss cluster)
Critical resistance zones:
- $74K–$75K: Short-term resistance
- $78K–$80K: Bollinger Band upper band
- $85K–$90K: Previous higher-low support
- $100K: Psychological barrier, institutional stop-loss zone
Trading Strategy: Signal-Based Entry Points
Technical traders should monitor these confirmations:
Strong Buy Signals (70–80% probability):
- RSI breaks above 30 → Oversold condition ended
- MACD crosses above signal line (golden cross) → Momentum confirmed
- 3+ consecutive daily closes above 20-day MA → Trend reversal confirmed
Weak Buy Signals (40–50% probability):
- RSI 40–50 → Neutral, signals unclear
- MACD histogram positive but narrow gap from signal line → Weak momentum
- Price bouncing repeatedly off 20-day MA → Resistance high
Sell Signals:
- RSI exceeds 70 → Overheating, pullback likely
- MACD falls below signal line → Momentum reversal
- Volume collapse → Uptrend exhaustion
The Macro Wildcard: Why Technicals Aren't Enough
Technical setup alone doesn't guarantee profits. Macroeconomic factors are actively reshaping Bitcoin's price:
- Fed Rate Guidance: Lower rates = Bitcoin bullish
- Inflation Data: Unexpected inflation = Bitcoin under pressure
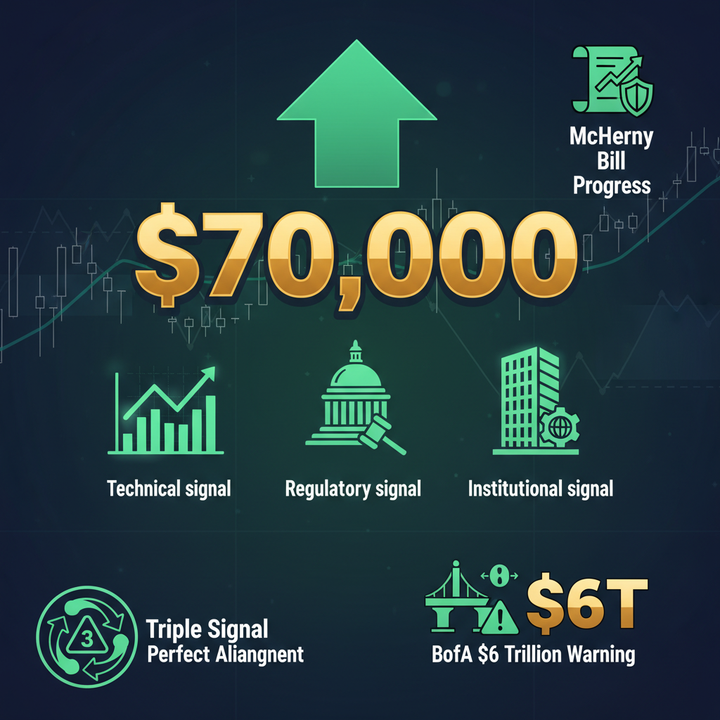
- Crypto Policy (McHenry Bill Progress): Regulatory clarity = Institutional demand
- Geopolitical Risk: Global instability = Safe-haven flows, short-term volatility
The current technical strength assumes a "normal" market environment. A macroeconomic shock—sudden Fed policy reversal, inflation surprise, or geopolitical escalation—could invalidate these signals and push Bitcoin below $70K despite strong indicators.
This is why the smartest approach combines technical analysis with macro risk management. Spoted Crypto Premium Analysis integrates both, monitoring technical setups alongside macro developments in real time. You can also track institutional flows through Spoted Crypto's research dashboard and engage with the community's technical analysis discussions for multi-perspective input.
Frequently Asked Questions
Has RSI ever recovered from lows this extreme before?
Multiple times, with powerful results. FTX collapse (November 2022): RSI hit 10, then 2.6x in 6 months. COVID crash (March 2020): RSI hit 20, then 8x in 9 months. Every major Bitcoin bottom since 2015 has been preceded by RSI at extreme lows. The pattern is consistent: extreme RSI oversold = strong reversal coming.
Should I buy on MACD golden cross alone?
MACD golden cross is a powerful signal, but it's most reliable when combined with RSI confirmation (exiting oversold), volume confirmation, and price staying above the 20-day MA. When all three align, success rate historically approaches 70–80%. MACD alone has lower hit rate. Combine signals for higher conviction.
How long to $100K from here?
Technical indicators suggest 3–6 months is reasonable, but macroeconomic conditions will determine actual timeline. A clean bull environment with Fed support could deliver $100K in 2–3 months. Macro headwinds (inflation, rate hikes, policy uncertainty) could extend it to 1+ years. Pace depends on both technicals AND macro backdrop working in sync.
What's the probability Bitcoin drops below $70K again?
Based on current technical setup: ~20%. But macro shock probability raises this to 50%+. A sudden Fed policy shift, inflation spike, or geopolitical crisis could break technicals. This is why macro risk management is non-negotiable. Never trust technicals alone in volatile crypto markets.
Are these technical signals absolutely reliable?
No. Technical indicators are ~70–80% reliable in normal markets, but that's not certainty. Extreme RSI recovery, MACD golden cross setup, and Bollinger Band reversal signals are among Bitcoin's most reliable patterns historically. But "most reliable" still leaves room for surprise. Always manage risk.
Can beginners trade these signals?
Yes, with preparation. First, learn RSI, MACD, and Bollinger Bands theory. Then paper-trade (simulate) on real charts. Only deploy real capital after you can consistently identify these patterns. Spoted Crypto's educational resources and community discussions provide excellent learning foundations.
The Bottom Line
Bitcoin's technical signals are screaming bullish. RSI bouncing from extreme lows, MACD forming golden cross, Bollinger Bands reversing—these three signals rarely align. Historically, when they do, 3–6 month gains of 50–100% have followed.
But technicals aren't destiny. Macro conditions matter equally. The strongest uptrends occur when technical strength (RSI recovery, momentum reversal) and macro tailwinds (Fed support, policy clarity) align. Right now, both are present. That's rare. That's powerful.
The $70K level isn't the destination—it's the launchpad. The real move from here likely pushes toward $100K within the next quarter. But only if macro conditions hold and technicals confirm. Watch the signals. Monitor the macro. Manage your risk. The opportunity window is now.
Sources & References
- CoinDesk Bitcoin Price—Real-time pricing and charting
- RSI, MACD, Bollinger Bands: Standard technical analysis indicators (academic definitions)
- Historical Bitcoin data: 2015–present major bottom analysis
- Spoted Crypto Technical Tools—Real-time indicator tracking and analysis