What Changed: Bulls Liquidated $70K Calls, Bears Piled Into $60K Puts
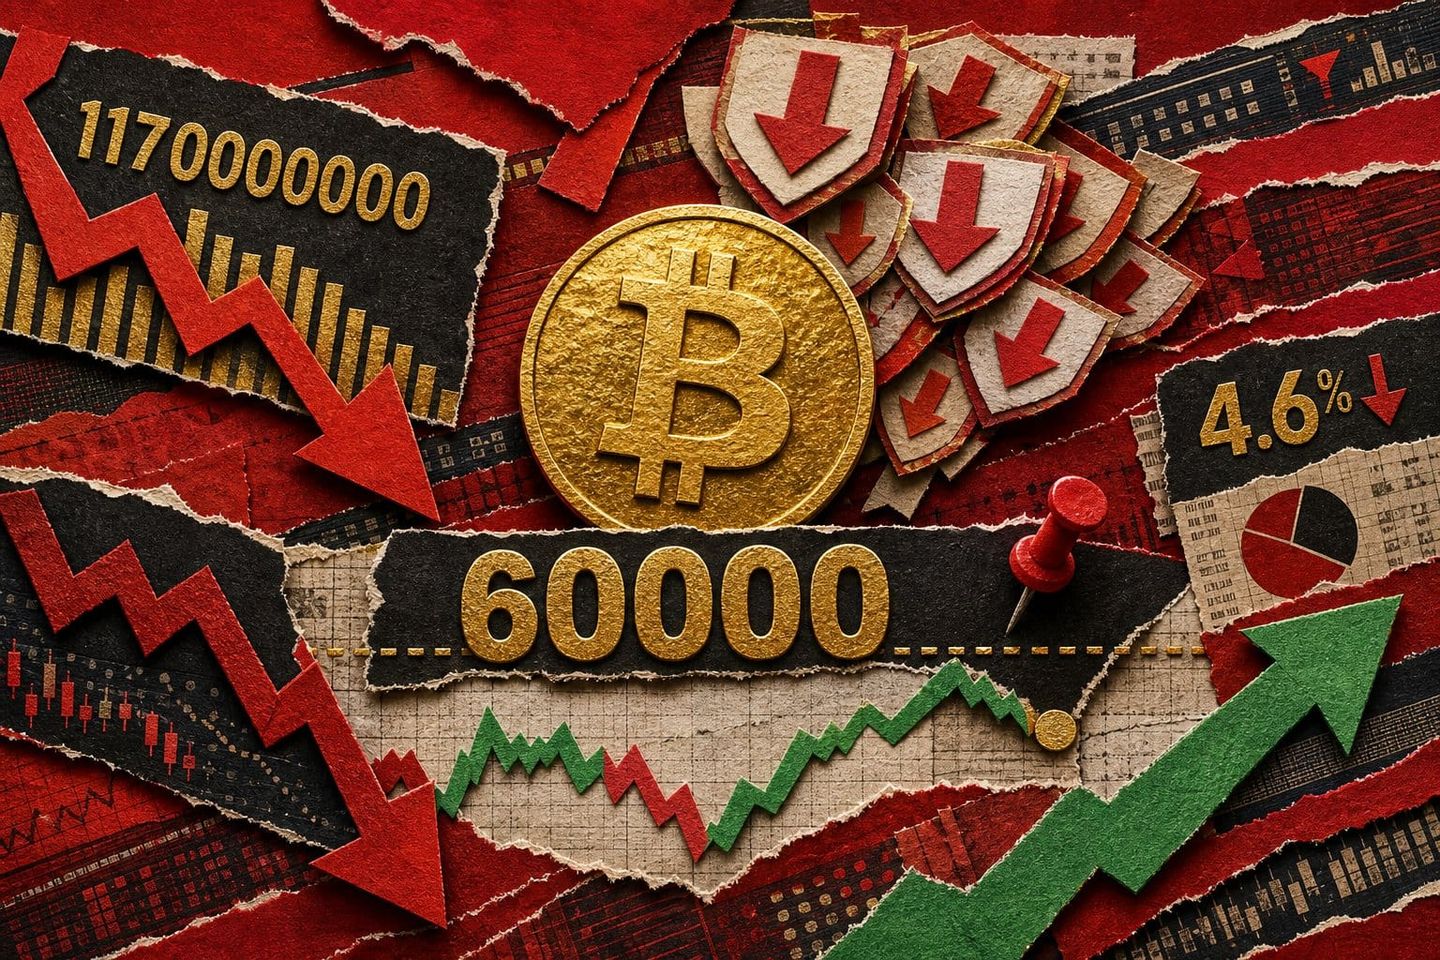
The $60,000 put became Deribit's single largest strike as of July 31, 2026, carrying roughly $1.17 billion in notional open interest. On the world's largest crypto options exchange, that is the clearest snapshot of where traders are hedging — and right now they are paying for downside protection, not upside.
Just one day earlier, the picture was the opposite. Bullish calls dominated the board: the $70,000 and $72,000 strikes each held about $2.5 billion in open interest ahead of the Federal Reserve meeting. After that decision disappointed the bulls, those positions were largely liquidated — the $70K call fell to about $943 million and the $72K call to roughly $888 million.
The rotation is the signal. Capital leaving upside calls and crowding into downside puts tells you hedgers no longer trust $60,000 as a reliable near-term floor. What was recently a bet on a breakout has become insurance against a breakdown.
The timing sharpens the risk. Deribit settled roughly $9.6–$10 billion in combined BTC and ETH contracts at the August 1 08:00 UTC monthly expiry. That settlement thinned order books heading into the weekend, reducing the liquidity buffer between spot and the $60,000 strike — and leaving individual market orders room to move price further than usual.
Why $1.17B in Puts Just 4.6% Below Spot Acts Like a Price Magnet
The $60,000 put behaves like a price magnet because it sits close enough to spot to be reachable in one bad session. Bitcoin traded near $62,900 into the weekend , leaving the $60,000 strike roughly 4.6% lower — inside the range of a single sharp move .
The pull is mechanical, not sentimental. Dealers who sold that $1.17 billion in puts hedge their exposure by shorting spot as price falls toward the strike . The closer Bitcoin drifts to $60,000, the more they must sell to stay hedged — a self-reinforcing loop that adds selling pressure exactly where the largest downside hedge already rests.
Analysts frame the trigger with precision rather than vibes. Bearish confirmation requires a sustained break below $62,000 — a level that holds through rebound attempts, not a brief wick . Alongside it, they want to see:
- Spot sales leading futures, rather than derivatives leading price.
- Open interest expanding during the decline — fresh positions, not closures.
- Perpetual funding holding near neutral or positive, signaling new shorts entering behind real coin sales.
Post-expiry liquidity thinning amplifies every one of those moves. With Deribit's monthly contracts settled, the buffer between spot and the strike is unusually shallow.
"Capital resting within 1% of spot across Binance, Coinbase, Kraken, OKX and Bybit will determine how far weekend orders travel," per analysis from CryptoSlate.
In a thin book, individual market orders carry outsized impact — meaning a modest wave of sells could travel farther than it would in a liquid market, handing the $60,000 overhang exactly the momentum it needs.
August Seasonality Piles On: Median -7.51% After Positive Julys
The calendar adds weight to that thin-book risk. Since 2013, July has delivered a median Bitcoin return of roughly 8.61%, and July 2026 tracked at +8.9% — squarely in line with the historical pattern (source: CoinDesk, 2026-07).
The problem is what tends to follow. A positive July has historically given way to a negative August, with a median return near -7.51%. Applied to current levels, that projects a slide into the high-$58,000s — below the $60,000 strike where the largest downside hedge already sits.
That level is not arbitrary. Between January 29 and February 6, 2026, Bitcoin fell from roughly $90,000 to about $60,000 as part of a correction that erased close to 50% from its October 2025 high. That acute leg down cemented $60,000 as the dominant psychological and options-market anchor traders keep returning to.
"The intermittent rebounds look fragile," analysts noted, pointing to put premiums that stayed richer than calls across expiries (source: BitcoinWorld).
There is a genuine offset. Spot Bitcoin ETFs still logged $233.1 million in net inflows on July 30, lifting cumulative net inflows to about $51.64 billion — evidence that longer-horizon institutional accumulation continued even as short-dated positioning turned defensive (source: CryptoSlate). The catch: steady inflows have historically struggled to override derivatives-led momentum on short timeframes. Over a weekend, options mechanics — not fund flows — set the near-term path.
What to Watch: The Exact Levels That Confirm or Abort the $60K Test
The near-term path resolves at a handful of specific levels, not headlines. A bearish confirmation requires a sustained close below $62,000 — a decisive break, not a brief wick — with spot sales leading futures, open interest expanding on the way down, and perpetual funding holding near neutral or positive. That combination signals fresh shorts entering behind coin sales, making $60,000 the next magnet.
Watch these markers over the weekend:
- Bearish trigger: price staying under $62,000 through attempted rebounds; $60,000 holds the largest downside hedge at ~$1.17 billion in put open interest.
- Bullish repair: $64,500 is the first intermediate level; a reclaim above $65,300 reopens $66,000 and $68,000 as targets.
- Deeper hedge: notable demand for $50,000-strike puts expiring September 2026 — roughly 15% below spot — flagged as a potential liquidation-cascade trigger if breached .
- Daily Deribit check: if $60,000 put open interest grows while Bitcoin holds above $62,000, hedgers are adding, not closing — a risk-off signal regardless of spot.
The takeaway: $62,000 is the line that decides everything. Above it, the puts stay theoretical; below it, they become the target.
Frequently asked questions
What does $1.17B in open interest at the $60,000 put mean for Bitcoin's price?
Large put open interest concentrated at one strike can act like a gravitational pull. As spot drifts toward $60,000, dealers who sold those puts hedge by selling Bitcoin spot, which amplifies downward momentum. With roughly $1.17 billion in notional open interest sitting just 4.6% below the weekend's starting price , that strike is comfortably within near-term range rather than a distant tail risk.
Why did Bitcoin's options market flip bearish so quickly?
Traders had loaded up on $70,000 and $72,000 calls ahead of the Federal Reserve meeting, each holding about $2.5 billion in open interest. When the decision disappointed, those positions were unwound rapidly: by July 31 the $70,000 call had fallen to roughly $943 million and the $72,000 call to about $888 million . That capital rotated into $60,000 downside puts, signaling hedgers no longer treat $60,000 as a reliable support floor .
What Bitcoin price level is most critical to watch right now?
$62,000 is the line analysts cite as decisive. The bearish trigger is a sustained break below it — not a brief wick — with spot sales leading futures and open interest expanding during the decline . Bitcoin traded near $62,900 into the window . If $62,000 holds, the downside scenario loses its mechanical support and the puts stay theoretical.
Is August historically bad for Bitcoin?
Historically, yes — in years following a positive July. Since 2013, August has posted a median Bitcoin return of about -7.51% after a green July. July 2026 finished up roughly 8.9%, fitting that exact precondition . Applied to current levels, that median projection would imply a slide toward the high-$58,000s . Seasonality is a tendency, not a guarantee.
Do $233M in ETF inflows change the bearish picture?
Not directly. Spot Bitcoin ETFs logged $233.1 million in net inflows on July 30, lifting cumulative net inflows to about $51.64 billion . Those flows confirm institutional demand at longer horizons, but they do not neutralize short-dated options pressure or post-expiry liquidity gaps. Both signals can coexist: accumulation buyers and derivatives-driven sellers simply operate on different timeframes.
Enjoyed this article? Subscribe to get new stories by email whenever they're published.