38% of Altcoins Hit All-Time Lows—Worse Than FTX Collapse: How Trend Research's $800M Liquidation Triggered the 2026 Crash
38% of altcoins near all-time lows, surpassing FTX collapse. How Trend Research's $800M ETH liquidation sparked the 2026 crash.
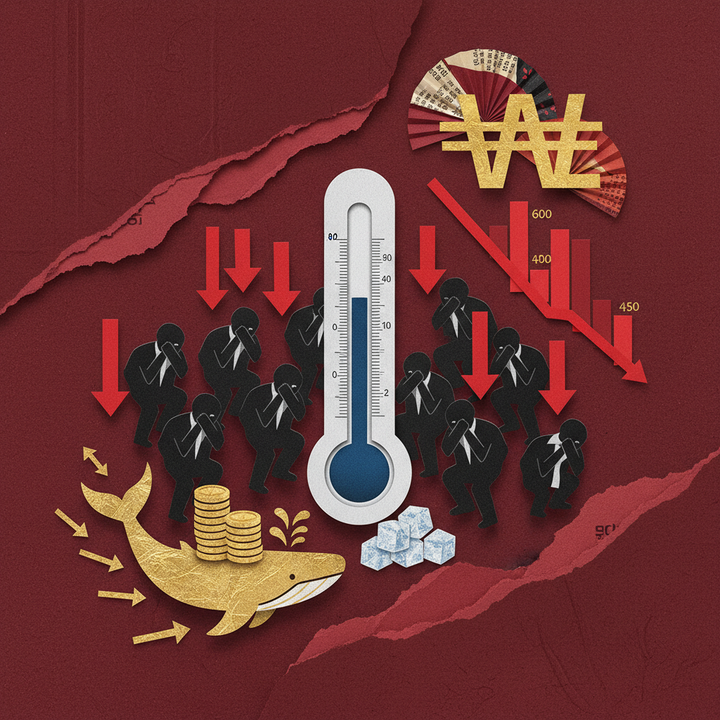
The crypto market is enduring its deepest altcoin capitulation since the FTX collapse of November 2022 — and by several critical metrics, the damage has already surpassed that historic crisis. With 38% of altcoins trading near all-time lows, the Fear & Greed Index pinned at 13, and an $800 million forced liquidation sending shockwaves through DeFi, March 2026 is shaping up to be one of the most punishing months in digital asset history.
38% of Altcoins Near All-Time Lows — How Severe Is the 2026 Crypto Crash?
Quick Answer: A record 38% of altcoins are now trading near all-time lows, surpassing the 37.8% recorded during the FTX collapse. The Fear & Greed Index sits at 13 (Extreme Fear), ETH dominance has cratered to a historic 10.0%, and total crypto market capitalization stands at $2.46 trillion with BTC dominance at 56.9% — signaling the most severe altcoin capitulation event of the current cycle.
The percentage of altcoins trading near their all-time lows is a distress barometer for the broader crypto market — and right now, the reading is historic. According to on-chain analytics from Spoted Crypto, 38% of tracked altcoins have fallen to within striking distance of their lowest-ever recorded prices, exceeding the 37.8% threshold last seen during the FTX implosion in November 2022. Total crypto market capitalization currently sits at $2.46 trillion, with Bitcoin dominance climbing to 56.9% as capital rotates aggressively out of altcoins and into perceived safety. Ethereum dominance, meanwhile, has collapsed to just 10.0% — a level not seen in years — while the Altseason Index reads a dismal 35 out of 100. The Fear & Greed Index at 13 confirms Extreme Fear across the board, worse than FTX-era readings of 20. This is not a correction; it is a structural capitulation event reshaping portfolio allocations across the entire digital asset class.
FTX Collapse vs. March 2026: A Direct Comparison
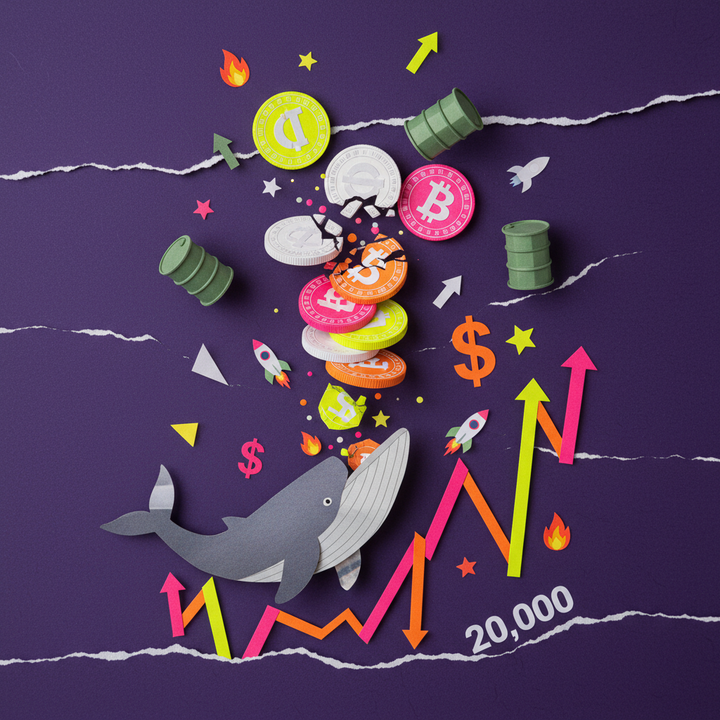
The most alarming aspect of the current downturn is how it compares, metric by metric, with what many considered crypto's darkest chapter. When FTX filed for bankruptcy in November 2022, total crypto market capitalization had plunged below $800 billion, BTC traded at roughly $15,500, and panic liquidations cascaded across centralized exchanges. Today, the overall market cap is substantially higher at $2.46 trillion and Bitcoin trades at $70,031 — yet altcoin distress is objectively worse. The divergence reveals a two-tier market: Bitcoin and a handful of large-caps are holding relatively firm, while hundreds of smaller tokens have been abandoned by both retail and institutional capital.
| Metric | FTX Collapse (Nov 2022) | Current (Mar 2026) |
|---|---|---|
| Altcoins Near ATL | 37.8% | 38.0% |
| Fear & Greed Index | 20 | 13 |
| BTC Price | ~$15,500 | $70,031 |
| ETH Dominance | ~18% | 10.0% |
| BTC Dominance | ~40% | 56.9% |
| Total Market Cap | ~$800B | $2.46T |
| Altseason Index | ~25/100 | 35/100 |
Derivatives Signal Structural Stress, Not Just Sentiment
Beyond spot market pricing, the derivatives landscape confirms that the current downturn is driven by forced deleveraging rather than orderly profit-taking. On Coinglass, BTC funding rates on Binance have turned negative at -0.0024%, indicating that short sellers are now dominant and willing to pay a premium to maintain bearish positions. DOGE funding sits at -0.0088%, the most negative among major tokens, reflecting acute retail capitulation in meme-sector assets. ETH funding, at +0.0043%, is a rare positive outlier — likely skewed by the massive Aave liquidation event forcing counterparty rebalancing rather than genuine bullish conviction. BTC traded between a 24-hour low of $66,853 and a high of $70,578 on Binance, a $3,725 range that underscores persistent volatility. SOL at $86 (+3.89%) has shown a modest dead-cat bounce but remains deeply underwater from cycle highs.
CryptoQuant analyst Darkfost summarized the severity of the situation: "This is the largest altcoin pullback of the current cycle — the decline has exceeded FTX levels," according to analysis published via Spoted Crypto. The critical distinction is context: during the FTX collapse, the entire market was contracting from speculative excess. Today, Bitcoin is holding above $70,000 while altcoins are being systematically abandoned — a divergence that suggests structural capital reallocation rather than a temporary panic flush.
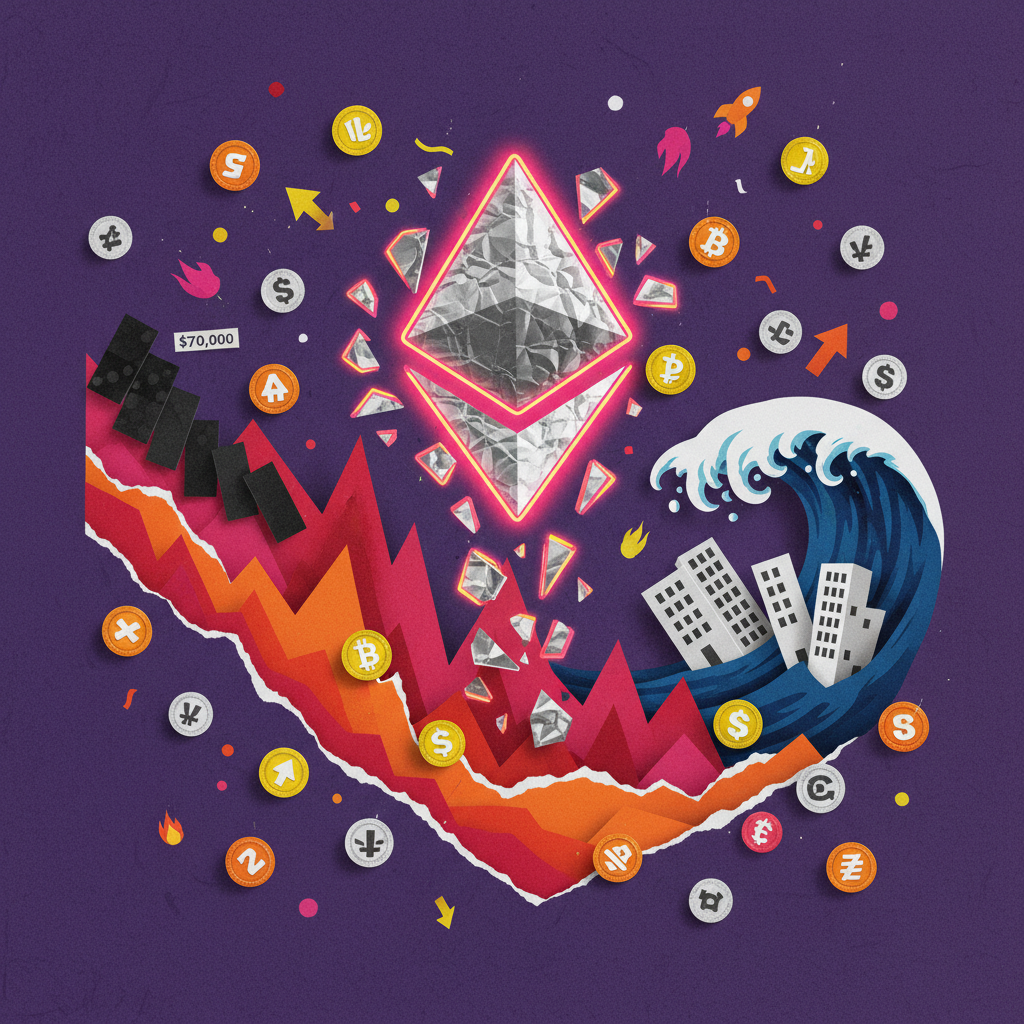
Trend Research's $800M ETH Liquidation on Aave — The Largest DeFi Forced Unwind Since Three Arrows Capital
A single leveraged position unraveling on a decentralized lending protocol has triggered the most consequential forced liquidation in DeFi history, sending shockwaves through the entire Ethereum ecosystem. Trend Research, a crypto-native fund, saw 411,075 ETH — approximately $800 million at liquidation prices — forcibly sold on Aave after its collateral ratio breached critical thresholds. The fund had maintained a leveraged long position valued at $2.1 billion, borrowing against ETH collateral to amplify upside exposure. When ETH prices accelerated their decline, crossing below the liquidation price, the Aave protocol's automated smart contracts executed the forced sale — resulting in a realized loss of $869 million, or 41.4% of the original position value. The event drove ETH down 30% in a single week and catalyzed $302.75 million in cascading liquidations within 24 hours, with long positions representing 91% of the total, as reported by CryptoSlate.
Anatomy of a DeFi Liquidation: The Trend Research Timeline
Unlike the opaque collapses of centralized entities, the Trend Research unwind played out entirely on-chain, visible to anyone monitoring Ethereum block explorers and Aave's liquidation dashboards. The fund had accumulated its 411,075 ETH long position over several months, using Aave's permissionless lending pools to borrow stablecoins against its ETH holdings and reinvest into additional ETH — a classic recursive leverage strategy designed to amplify returns in a rising market. As ETH began sliding from levels above $2,800 in late February, the position's health factor deteriorated steadily.
The critical cascade began when ETH broke below $2,100. At this level, Aave's liquidation bots — permissionless smart contracts that any arbitrageur can operate — began partially liquidating the position, selling ETH to repay borrowed stablecoins and protect the protocol's solvency. Each partial liquidation pushed ETH's price lower, triggering further liquidation thresholds in a textbook death spiral. The selling pressure was immense: 411,075 ETH hitting the market represented roughly 2-3 days of typical Binance ETH spot volume concentrated into hours. ETH plunged to a weekly low near $1,953, down approximately 30% in seven days, as the cascade rippled across every major exchange and pushed ETH dominance to a historic low of 10%.
Three Arrows Capital vs. Trend Research: Two Eras of Crypto Catastrophe
The most instructive comparison is to Three Arrows Capital (3AC), the Singapore-based hedge fund whose $3.5 billion collapse in June 2022 triggered a chain reaction that brought down Celsius, Voyager, and BlockFi — wiping out billions in customer deposits across centralized platforms. While the Trend Research event is smaller in absolute dollar terms, the structural implications are fundamentally different and, in some ways, more revealing about the maturity of crypto markets.
| Metric | Three Arrows Capital (Jun 2022) | Trend Research (Mar 2026) |
|---|---|---|
| Total Loss / Exposure | $3.5B+ | $869M realized loss |
| Loss Rate | ~100% (insolvency) | 41.4% of $2.1B position |
| Venue | CeFi (Genesis, Voyager, etc.) | DeFi (Aave v3) |
| ETH Price Impact | -77% over weeks | -30% in one week |
| Cascade Effect | Celsius, Voyager, BlockFi bankruptcies | $302.75M in 24h liquidations (91% longs) |
| Transparency | Opaque — months to uncover full scope | Real-time on-chain visibility |
| Counterparty Risk | Systemic — customer funds frozen | Contained — protocol remained solvent |
What the Trend Research Liquidation Reveals About DeFi Risk
The critical takeaway from the Trend Research event is paradoxical: it was simultaneously devastating for market prices and a vindication of DeFi's design philosophy. When 3AC collapsed, creditors spent months in bankruptcy courts trying to trace assets across opaque CeFi counterparties. Customers of Celsius, Voyager, and BlockFi lost access to their deposits, and the full scope of the damage took over a year to quantify. In contrast, the Trend Research liquidation was visible in real time on Ethereum block explorers. Aave's protocol remained fully solvent throughout — the smart contracts performed exactly as designed, protecting depositors by liquidating under-collateralized positions before the protocol itself could become impaired.
However, this transparency did nothing to prevent the market impact. The $302.75 million in cascading liquidations within 24 hours — 91% of which were long positions — demonstrates that DeFi's composability can amplify contagion just as effectively as CeFi's interconnected balance sheets. On Coinglass, ETH open interest on major exchanges contracted sharply as leveraged longs were wiped out en masse. The event pushed ETH to $1,953 intraday, roughly 60% below its all-time high of $4,950, and compressed ETH dominance to the 10% level that now defines the current market structure. For traders and protocols alike, the Trend Research unwind serves as a stark reminder: on-chain transparency does not equal on-chain safety. Leverage kills in DeFi just as efficiently as it does in traditional finance — the only difference is that everyone can watch it happen in real time.
Ethereum Dominance at 10%: A Historic Low — What Is Happening to ETH?
Ethereum dominance — the share of total crypto market capitalization held by ETH — has collapsed to 10.0%, marking an all-time record low that underscores the severity of the current altcoin crisis. According to live CoinGlass data, ETH is trading at $2,044 on Binance with a 24-hour gain of +3.37%, yet it remains approximately 58.7% below its all-time high of $4,950. Bitcoin dominance has simultaneously surged to 56.9%, reflecting a dramatic capital rotation from altcoins into BTC as risk appetite evaporates. The Trend Research forced liquidation of 411,075 ETH ($800 million) on Aave — the largest single DeFi liquidation since Three Arrows Capital in 2022 — has amplified selling pressure and accelerated the erosion of ETH's market share. With the Fear & Greed Index at just 13 out of 100, Ethereum is trading at dominance levels that challenge its long-held status as the undisputed second-largest cryptocurrency.
ETH Price and Dominance: Key Metrics
| Metric | Value | Context |
|---|---|---|
| ETH Price (Binance) | $2,044 | +3.37% (24h), 58.7% below ATH $4,950 |
| ETH Dominance | 10.0% | All-time record low |
| BTC Dominance | 56.9% | Multi-year cycle high |
| Total Market Cap | $2.46T | Fear & Greed Index: 13/100 (Extreme Fear) |
| ETH Funding Rate (Binance) | +0.0043% | Recovering from -0.0088% earlier this week |
| Trend Research Liquidation | 411,075 ETH ($800M) | Largest DeFi liquidation since 3AC (2022) |
The data reveals a troubling divergence between Ethereum and Bitcoin. While BTC has maintained relative resilience at $70,031 (+4.26% in 24 hours), ETH has significantly underperformed across every major timeframe. ETH dominance has declined from approximately 18% in early 2025 to today's 10.0%, driven by multiple structural headwinds: the rise of competing Layer-1 ecosystems like Solana, ongoing debate around Ethereum's deflationary thesis following the Dencun upgrade, and overwhelming institutional preference for Bitcoin exposure through spot ETFs over Ether-based products. The ETH perpetual futures funding rate recently plunged to -0.0088% before recovering to its current +0.0043%, reflecting a brief but intense period of extreme short-side dominance in the derivatives market.
Regional Price Differentials Signal Broad-Based Selling Pressure
Cross-exchange price differentials — commonly tracked through regional premiums and discounts — have turned negative for ETH across multiple Asian trading venues. The Asian regional discount for ETH widened to approximately -0.60% in recent sessions, according to data compiled by The Block, indicating that sellers in these markets are accepting below-global-average prices to exit positions. This pattern is typically associated with accelerated retail capitulation and stands in stark contrast to the 2–5% premiums observed during bullish phases, when strong regional demand pushes local prices above global benchmarks. The so-called "Kimchi premium" — a well-known gauge of Asian retail sentiment — flipping to discount territory reinforces the extreme fear narrative driving indiscriminate selling across all market segments, with ETH absorbing disproportionate damage as capital consolidates into Bitcoin.
For investors tracking Ethereum's trajectory, the 10% dominance floor represents entirely uncharted territory. Historical data suggests that extreme dominance lows have preceded significant mean reversion — but the current macro environment, marked by persistent ETF outflows and ongoing DeFi deleveraging, may extend this period of relative weakness before any structural recovery can materialize.
On-Chain Data Reveals the Anatomy of Fear — Funding Rates, Liquidations, and Whale Activity
On-chain analytics and derivatives data provide a granular view of the fear gripping crypto markets in March 2026, with funding rates, liquidation cascades, and whale wallet movements collectively revealing a story of retail panic meeting institutional opportunism. CoinGlass data shows Binance perpetual futures funding rates plunged into negative territory across virtually all major assets earlier this week — BTC at -0.0011%, ETH at -0.0088%, and SOL at -0.0169% — before partially recovering to current levels. In the past 24 hours alone, $302.75 million in leveraged positions were liquidated across centralized exchanges, with a staggering 91% of those liquidations hitting long traders. Yet beneath the surface of this carnage, the most significant signal may come from whale wallets: large Bitcoin holders have accumulated approximately 270,000 BTC — worth $18.7 billion — over the past 30 days, executing a classic contrarian strategy that has historically preceded major price reversals in a market where 38% of altcoins are trading near all-time lows.
Derivatives Snapshot: Funding Rates and the Liquidation Cascade
| Metric | Value | Detail |
|---|---|---|
| BTC Funding Rate (Binance) | -0.0024% | Negative — short-biased positioning persists |
| ETH Funding Rate | +0.0043% | Recovering from -0.0088% earlier this week |
| SOL Funding Rate | +0.0030% | Recovering from -0.0169% earlier this week |
| 24h Total Liquidations | $302.75M | 240,000+ traders affected across exchanges |
| Long vs Short Liquidations | 91% vs 9% | Extreme long-side destruction |
| Spot BTC ETF Net Outflows | $7.8B (12% of AUM) | Sustained outflow trend since November 2025 |
| Whale BTC Accumulation (30d) | 270,000 BTC ($18.7B) | Contrarian buying by 1,000+ BTC wallets |
The derivatives data tells a story of systematic leverage destruction. The 91%-to-9% long-versus-short liquidation ratio is one of the most extreme readings of 2026, confirming that the market's decline was driven primarily by the forced unwinding of bullish leveraged positions rather than fresh short-selling pressure. Adding to the bearish backdrop, spot Bitcoin ETFs have experienced cumulative net outflows of $7.8 billion — representing approximately 12% of total assets under management — since November 2025, according to The Block. This sustained institutional withdrawal contrasts sharply with the optimism that characterized the ETF launch period in early 2024, when inflows exceeded $12 billion in the first three months alone.
Whale Accumulation vs. Retail Capitulation: The Smart Money Divergence
While retail traders have been liquidated en masse, on-chain data reveals a starkly different story among large holders. According to Glassnode analytics, wallets holding 1,000+ BTC have added approximately 270,000 BTC ($18.7 billion) to their positions over the past 30 days. This accumulation pattern — buying aggressively during periods of maximum fear — mirrors the behavior observed during previous market bottoms, including the March 2020 COVID crash and the November 2022 FTX collapse.
Brian Quinlivan, Marketing Director at Santiment, contextualized this divergence: "When Fear and Greed enters extreme fear, it coincides with retail capitulation and smart money accumulation," he told Spoted Crypto. Historical data supports this observation. When the Fear & Greed Index has dropped below 15, BTC has delivered positive 90-day returns approximately 80% of the time. The March 2020 crash — index reading of 8, BTC at $3,800 — preceded an extraordinary 1,100% rally over the following 12 months. The November 2022 FTX bottom, with an index reading of 6 and BTC at $15,500, led to a 300% gain within a year.
The current market structure presents a classic contrarian setup: extreme fear, massive deleveraging, and negative funding rates at the retail level, combined with aggressive whale accumulation and historically bullish smart money positioning. Whether this divergence resolves in favor of the accumulators — as it has in prior cycles — or whether structural factors like sustained ETF outflows and ongoing DeFi liquidation risk create a fundamentally different outcome, will likely define the trajectory of crypto markets through the second quarter of 2026.
Institutional Capital Defies the Crash — KAST's $80M Raise, Nasdaq-Kraken Tokenization, and Stablecoin Insurance Payments
While 38% of altcoins languish near all-time lows and the Fear & Greed Index sits at a brutal 13, institutional capital is pouring into crypto infrastructure at an accelerating pace. KAST, a stablecoin payments platform, closed an $80 million Series A at a $600 million valuation, according to CoinDesk. Nasdaq and Kraken announced a landmark partnership to tokenize listed equities via the xStocks platform, targeting a first-half 2027 launch. Meanwhile, global insurance broker Aon completed the industry's first-ever stablecoin premium payment using USDC on Ethereum and PYUSD on Solana. These developments reveal a critical divergence: while speculative markets collapse under leverage-driven liquidations, the institutional infrastructure layer — stablecoins, tokenized real-world assets, and enterprise payment rails — continues to expand. Stablecoin total supply has reached $309 billion, and the tokenized RWA market stands at $25.26 billion, a staggering 4.4x increase from 2023 levels.
KAST: Stablecoin Payments Platform Reaches $600M Valuation
KAST's $80 million Series A, co-led by QED Investors and Left Lane Capital, positions the stablecoin payments startup among the most well-funded fintechs of 2026. The platform has surpassed 1 million active users, processes an annualized transaction volume of $5 billion, and is targeting an ARR of $100 million for 2026, as reported by Bloomberg. With over 250 employees, KAST represents a new generation of crypto-native payment infrastructure that operates entirely independently of speculative token markets — a key reason investor appetite remains robust even as altcoin portfolios hemorrhage value. For more on how stablecoin adoption is reshaping global payments, see our in-depth analysis.
Nasdaq-Kraken Partnership: Tokenized Equities Targeting 2027
Nasdaq and Kraken's partnership to launch xStocks — a platform enabling 1:1 tokenization of listed equities with full shareholder rights — marks a watershed moment for traditional finance's convergence with blockchain settlement rails. According to CoinDesk, the platform will go live in European and international markets in H1 2027, preserving voting and dividend rights on-chain through Payward's infrastructure. This initiative places tokenized securities on a direct collision course with legacy T+2 clearing cycles, potentially compressing settlement to near-instant finality while opening 24/7 equity trading to global participants.
Aon Completes First Stablecoin Insurance Premium Payment
Global insurance giant Aon executed the insurance industry's first stablecoin premium payment, partnering with Coinbase for USDC on Ethereum and Paxos for PYUSD on Solana. The transaction was conducted under the regulatory framework established by the GENIUS Act (2025), signaling that stablecoin rails are now mature enough for enterprise-grade financial operations in regulated industries.
"This is what the internet financial system looks like in practice. Not theory — operations." — Jeremy Allaire, CEO, Circle (via Spoted Crypto)
| Infrastructure Metric | March 2026 | 2023 Baseline | Growth |
|---|---|---|---|
| Stablecoin Total Supply | $309B | $137B | +125% |
| Tokenized RWA Market Cap | $25.26B | $5.74B | +340% (4.4x) |
| KAST Annualized Volume | $5B | N/A (pre-launch) | — |
| KAST Series A Valuation | $600M | N/A | — |
The data reveals a compelling narrative: even as speculative crypto markets shed trillions in value and the Fear & Greed Index plumbs extreme lows, the infrastructure layer — stablecoins, tokenization platforms, and enterprise payment systems — continues attracting institutional capital at record pace. For investors navigating the current downturn, these institutional commitments may serve as leading indicators of where long-term value creation is quietly compounding beneath the surface of market panic.
Exchange Compliance Crackdowns Escalate — Global Regulators Tighten AML Enforcement in 2026
Regulatory enforcement against cryptocurrency exchanges has intensified globally in 2026, with authorities from Asia to North America imposing severe penalties for anti-money laundering (AML) and know-your-customer (KYC) failures. South Korea's Financial Intelligence Unit (FIU) issued a preliminary notice for a six-month partial business suspension against Bithumb, the country's second-largest exchange, citing AML/KYC violations and transactions with unregistered overseas platforms, according to CoinDesk. This action follows a broader pattern: in 2025, competitor Upbit (operated by Dunamu) received a three-month partial suspension and a ₩35.2 billion (~$27 million) fine for similar infractions. Across the Pacific, the EU's Markets in Crypto-Assets (MiCA) framework — fully enforced since June 2024 — has compelled dozens of exchanges to either obtain licenses or exit European markets entirely. The final ruling on Bithumb is expected from Korea's sanctions review committee on March 16.
The Global Exchange Enforcement Pattern
Bithumb's potential suspension is not an isolated incident but part of a synchronized global crackdown on exchange compliance. The precedent in Korea was set in 2025 when Upbit faced a three-month partial suspension and a ~$27 million penalty for AML violations — a case that sent shockwaves through Asian crypto markets. Globally, the enforcement trend is unmistakable: Binance paid a $4.3 billion settlement with U.S. authorities in 2023, OKX restructured operations across multiple jurisdictions to meet licensing requirements, and MiCA has created a unified compliance floor that effectively bars non-compliant platforms from the world's second-largest crypto market. For exchanges, the compliance cost has become existential — either invest heavily in AML/KYC infrastructure or face forced operational shutdowns. Korea's FIU has confirmed that existing user balances and active trades on Bithumb will remain unaffected by any potential suspension, a safeguard designed to prevent bank-run dynamics that could destabilize broader markets.
Altcoin Volatility Amid Regulatory Uncertainty
Regulatory actions against major exchanges frequently trigger sharp, unpredictable price movements in smaller tokens. FLOW exemplifies this dynamic: after plunging to an all-time low of $0.0335 on March 5, the token surged 63% in the following days, gaining 16.79% in a single session to enter the top five by trading volume on Korean exchanges, according to CoinMarketCap data. Such violent rebounds are characteristic of extreme fear environments — with the index at 13, thin liquidity amplifies both cascading sell-offs and recovery rallies in equal measure. For traders tracking altcoin recovery signals in 2026, regulatory clarity has become as consequential as on-chain metrics. The March 16 Bithumb ruling could set the tone for exchange compliance enforcement across Asia for the remainder of 2026, with implications extending well beyond Korea's borders to any platform serving cross-border users in the region.
How Markets Moved After Extreme Fear — Historical Return Comparison
Extreme fear in crypto markets is a statistical anomaly that has paradoxically preceded some of the most explosive recovery periods in Bitcoin's history. With the Fear & Greed Index plunging to 13 on March 10, 2026 — near the cycle low of 10 recorded just five days earlier — the current reading mirrors conditions last seen during the COVID crash of March 2020 and the FTX collapse of November 2022. Both events triggered widespread capitulation, mass liquidations, and sentiment readings in single digits, yet investors who deployed capital during these extreme fear windows captured outsized returns over the following 12 months. The central question now is whether March 2026's sell-off, driven by $800 million in Trend Research liquidations and 38% of altcoins trading near all-time lows, represents another generational buying opportunity — or whether structural differences render historical parallels unreliable.
Return Profiles From Prior Fear Extremes
History provides a compelling — though never guaranteed — template for what follows extreme sentiment collapses. The table below compares Bitcoin's performance following the three most severe fear episodes of the past six years:
| Event | Date | Fear & Greed Low | BTC Price at Low | 90-Day Return | 12-Month Return |
|---|---|---|---|---|---|
| COVID-19 Crash | March 2020 | 8 | $3,800 | +170% | +1,100% |
| FTX Collapse | November 2022 | 6 | $15,500 | +45% | +300% |
| Trend Research Liquidation | March 2026 | 10 (cycle low) | $66,853 | TBD | TBD |
The pattern is consistent: when the Fear & Greed Index drops below 15, Bitcoin has historically delivered positive 90-day returns approximately 80% of the time, according to backtested data compiled by CoinGlass. The COVID crash produced a staggering 1,100% gain over 12 months, transforming $3,800 Bitcoin into $45,000 by March 2021. The FTX collapse, while less dramatic in percentage terms, still delivered a 300% return from $15,500 to above $60,000 within a year. Both episodes shared defining characteristics with today's environment: cascading liquidations, negative funding rates, and widespread calls for further downside.
2026 Outlook — U-Shaped Recovery or Extended Drawdown?
Not all extreme fear episodes resolve identically. The current cycle differs in one critical dimension: Bitcoin entered this drawdown from significantly higher absolute price levels ($70,031 as of March 10), which mathematically limits the potential for four-digit percentage recoveries. Bitwise CIO Matt Hougan has characterized 2026 as a "U-shaped bottoming year," projecting Bitcoin to trade within a $75,000–$100,000 range during H1, according to Spoted Crypto. This implies a grinding, multi-month recovery rather than the V-shaped rebounds witnessed in 2020 and late 2023.
Rony Szuster, Head of Research at Mercado Bitcoin, reinforces the contrarian thesis: "Buying during periods of fear has been more effective than buying during euphoria," he stated in a recent analysis cited by Spoted Crypto. The historical data supports this view — investors who purchased Bitcoin when the Fear & Greed Index registered below 15 have outperformed those who bought during readings above 75 by a median margin of over 40% across subsequent 90-day windows.
Current derivatives data adds nuance to the contrarian case. Binance perpetual funding rates for BTC stand at -0.0024%, with DOGE at -0.0088% — signaling that short sellers are paying longs, a condition that frequently precedes short squeezes. Combined with BTC dominance at 56.9% and ETH dominance at a historic low of 10.0%, the market appears coiled for a rotation back into risk assets. The historical record is clear on the direction; only the timing remains uncertain.
Key Events to Watch in March — Investor Strategy and Positioning
March 2026 is shaping up as a pivotal month for crypto markets, with a convergence of regulatory deadlines, monetary policy decisions, and institutional milestones that could define price trajectories for the remainder of the year. The Federal Reserve's FOMC meeting on March 17–18 carries particular weight, with the current federal funds rate at 3.5%–3.75% and futures markets pricing in cuts toward approximately 2.5% by year-end. Meanwhile, the SEC faces a March 27 deadline on 92 pending crypto ETF applications — the largest single batch in U.S. regulatory history. On the institutional front, ZODL's $25 million seed round backed by Paradigm and a16z crypto signals renewed venture conviction in privacy-focused blockchain infrastructure, while the U.S. Treasury's formal acknowledgment of legitimate privacy uses for crypto mixers represents a meaningful shift in the global regulatory paradigm.
FOMC and Rate Path — The Macro Catalyst
The March 17–18 FOMC decision is the single most consequential macro event for crypto this month. With rates at 3.5%–3.75%, markets are pricing a dovish trajectory toward 2.5% by December — a cumulative 100–125 basis points of easing. Historically, rate-cutting cycles have been bullish for risk assets including Bitcoin. A dovish statement or any signal of accelerated cuts could provide the catalyst needed to push Bitcoin above $70,000 resistance. Conversely, hawkish language around persistent inflation risks extending the current fear cycle and pressuring prices below the $66,853 support level established during last week's liquidation cascade.
SEC ETF Deadline — 92 Applications at Stake
The March 27 deadline covers 92 crypto ETF filings, spanning spot applications for altcoins such as Solana, XRP, and Litecoin, alongside leveraged and inverse Bitcoin products. Approval of even a fraction of these could unlock significant institutional inflows. The precedent set by spot Bitcoin ETF launches in early 2024 — which attracted over $30 billion in net inflows within their first year — confirms that ETF expansion remains the most reliable demand catalyst for the asset class. Investors should monitor for batch approvals, partial rejections, or deadline extensions that could swing sentiment sharply in either direction.
Bottom-Signal Checklist for Contrarian Investors
Traders tracking capitulation signals can assess the following framework to evaluate whether current conditions constitute a durable market bottom:
- Negative Funding Rates: BTC at -0.0024% and DOGE at -0.0088% on Binance — shorts are dominant, creating short-squeeze potential. ✅
- Regional Premium Discounts: Asian exchanges showing negative premiums (approximately -0.57%), indicating local selling exhaustion — a historically reliable reversal indicator. ✅
- Whale Accumulation: On-chain data from Glassnode shows addresses holding 1,000+ BTC increasing balances over the past two weeks, even as retail investors exit positions. ✅
- Sustained Extreme Fear: The Fear & Greed Index has remained below 20 for over five consecutive days — matching the duration of prior bottoming patterns in March 2020 and June 2022. ✅
With regulatory clarity advancing through the U.S. Treasury's privacy mixer framework, institutional adoption deepening via stablecoin payment integrations, and top-tier venture capital flowing into privacy coin infrastructure, the structural backdrop is arguably stronger than headline fear levels suggest. The next three weeks will determine whether these catalysts can override the liquidation-driven downdraft — or whether March 2026 adds another chapter to crypto's catalog of extended drawdowns.
Frequently Asked Questions
What does it mean that the percentage of altcoins near all-time lows now exceeds the FTX collapse era?
According to Spoted Crypto research, approximately 38% of tracked altcoins are currently trading near their all-time lows — surpassing the 37.8% recorded during the November 2022 FTX implosion. This signals that the breadth of altcoin capitulation across the market is now historically unprecedented, even though individual drawdowns vary significantly from token to token. The primary structural driver is Bitcoin dominance surging above 60%, which reflects a sustained rotation of capital out of altcoins and into BTC as a perceived safe haven within crypto. Essentially, while the FTX crash was a sudden liquidity shock triggered by a single entity's fraud, the current environment represents a prolonged grinding decline where speculative capital has systematically exited lower-conviction assets over months. For investors, this distinction matters: a broader base of distressed altcoins does not necessarily mean the market is in worse shape than FTX — it indicates a different kind of stress, one driven by macro uncertainty and shifting risk appetite rather than contagion from a single point of failure.
How does the Trend Research ETH forced liquidation affect everyday investors?
The Trend Research liquidation event — involving 411,075 ETH (roughly $800 million) unwound through Aave's on-chain protocol — ranks as the largest single DeFi liquidation since Three Arrows Capital (3AC) in 2022, according to CryptoSlate. The immediate impact on retail investors is significant: large-scale forced selling of this magnitude creates intense downward pressure on ETH prices — which have already plunged roughly 30% in a single week to around $1,953 — and triggers cascading liquidations across correlated altcoin positions. When ETH dominance drops to historic lows near 9.9%-10.0%, altcoins that rely on ETH trading pairs suffer amplified losses. However, there is an important silver lining compared to the 3AC disaster: because this liquidation occurred transparently on-chain via DeFi smart contracts rather than through opaque CeFi counterparty relationships, the systemic risk of cascading exchange bankruptcies is considerably more contained. Retail investors should monitor Coinglass open interest and funding rate data for signs of further forced selling before considering new positions.
Is it a good time to buy when the Fear and Greed Index reads 13?
Historically, purchasing crypto assets when the Fear and Greed Index drops below 15 has produced positive 90-day returns approximately 80% of the time — but past performance emphatically does not guarantee future results. A reading of 13 places the market in "Extreme Fear" territory, which typically reflects maximum pessimism and historically has coincided with attractive entry points for patient, long-horizon investors. That said, the current macro environment introduces variables that previous fear-driven buying opportunities did not face: upcoming FOMC rate decisions, pending spot ETF regulatory outcomes, and large on-chain liquidation overhangs (such as the Trend Research ETH unwind) could all extend or deepen the drawdown before any recovery materializes. Rather than attempting to time an exact bottom, most risk-management frameworks favor a dollar-cost averaging (DCA) strategy during extreme fear periods — deploying capital in measured tranches over weeks rather than a single lump sum. This approach reduces the impact of further downside while still capturing the statistical edge that extreme fear readings have historically offered.
What happens to user funds when a major exchange faces a partial business suspension?
Recent regulatory actions — such as South Korea's FIU issuing a proposed six-month partial suspension to Bithumb over AML/KYC compliance failures — highlight a growing global trend of regulators enforcing operational restrictions on exchanges rather than outright shutdowns. A "partial suspension" typically restricts new user registrations, marketing activities, and certain product offerings, while existing users retain full access to their assets and trading capabilities. This pattern mirrors enforcement precedents seen across jurisdictions: the EU's MiCA framework, for instance, empowers regulators to impose graduated sanctions, and U.S. agencies like the SEC and CFTC have similarly pursued operational restrictions before considering full cease-and-desist orders. For users of any exchange facing regulatory scrutiny, the prudent steps remain consistent: ensure withdrawal functionality is operational, consider diversifying custody across multiple platforms or self-custody wallets, and monitor official regulatory announcements for final rulings. In Bithumb's case, a final decision is expected from South Korea's sanctions review committee by March 16, 2026 — underscoring that uncertainty itself can impact market sentiment even before any action takes effect.
Data Sources
- Spoted Crypto — 38% of Altcoins Near All-Time Lows (2026)
- Spoted Crypto — Trend Research ETH Liquidation & Altcoin Impact
- Spoted Crypto — Fear & Greed Index at 12: Extreme Fear & Negative Funding Rates (March 2026)
- CryptoSlate — Trend Research ETH Unwind Analysis
- CoinDesk — Bithumb Faces Proposed 6-Month Partial Ban
- Cointelegraph — Bithumb Partial Suspension Over AML/KYC
- Coinglass — Derivatives & Liquidation Data
This article is for informational purposes only and does not constitute investment advice. All investment decisions should be made based on your own judgment and responsibility.
Related Articles
- 38% of Altcoins Near All-Time Lows — Inside the 2026 Alt Massacre Worse Than FTX
- Trend Research's $800M ETH Liquidation — A 3AC Déjà Vu? How 411K ETH Dump Shook the Altcoin Market
- Stablecoin Transfer Volume Hits \.8T Record — Doubles Visa and PayPal Combined as Fear Grips Crypto
- Fear & Greed Index Hits 12: Extreme Fear Grips Crypto as Every Funding Rate Turns Negative
- NEAR Protocol Surges 41% While Fear & Greed Hits 12 — AI Catalysts Power a Counter-Trend Rally